


Share your thoughts
placeholder
Article
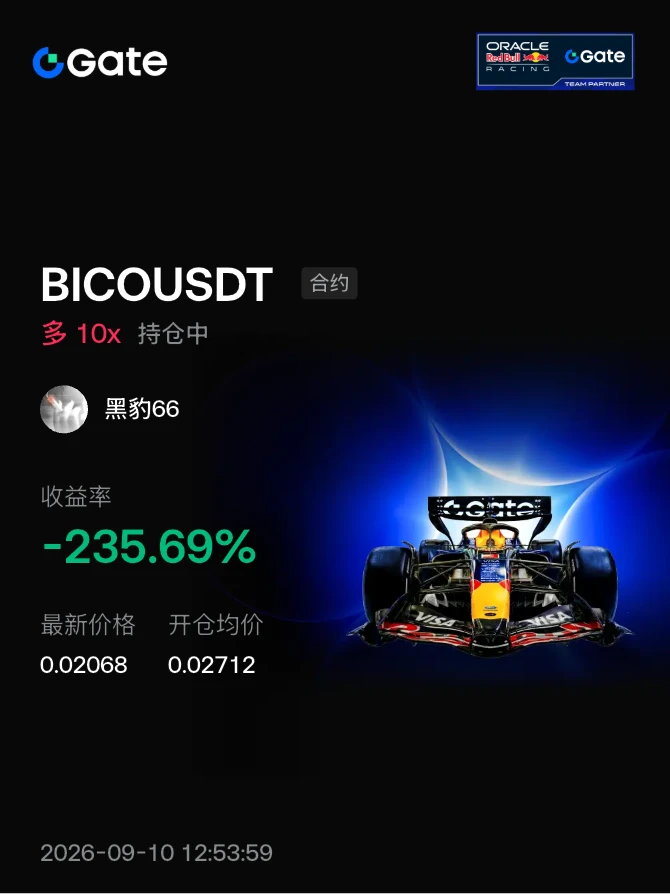
#交易机器人 I’m using the STORJUSDT futures grid bot on Gate, with a total return of -318.54% since creation. Get on board.
post-image
MARKET ALERT - HYPE
Based on the HYPEUSDT chart, the trend is in a strong bullish condition. The EMA 20, 50, and 200 indicators are diverging upward on both timeframes, confirming dominant buying momentum.
​Analysis & Trading Opportunities
​5-Minute Timeframe (TF 5m): The price around 87.853 is very close to the local high of 87.965. Buying directly (buy/long) in this area carries the risk of a pullback due to short-term overbought conditions.
​Strategy: Wait for a healthy correction to the EMA 20 support area (around 87.239) before opening a Long position.
​Target & Stop Loss: Take-profit (TP
HYPE+3.71%
  • 4
  • 2
The year-end Bitcoin target price given by major global financial institutions and top AI models has reached $95,000–$150,000 per coin, while Ethereum’s target is $3,175–$4,500 per coin; patiently hold spot #BTC收复8万美元
TradingKingGaoYuliang
Core Logical Reasoning
Driver 1: Macroeconomic Monetary Environment (the Biggest Short-Term Variable)
• Current Headwind: The probability of a rate hike in September has risen to 62%, while the rate cut previously expected by the market has yet to materialize. The Fed’s dot plot shows rates at around 3.25%–3.40% by the end of 2026, but CME FedWatch pricing puts the probability of a rate cut this year below 10%.
• Key Timing: The September FOMC meeting (mid-to-late September) is the short-term watershed moment. If a rate hike is implemented, BTC could fall to $72,000–$75,000 in the short term; if the Fed unexpectedly pauses, the Q4 rally could begin immediately.
• Powell’s Term: His term expires in May 2026. Changes in the Fed’s leadership will bring policy uncertainty, but the market has gradually priced this in.
Driver 2: ETF Fund Flows (Structural Support)
• Pressure in the First Half: Spot BTC ETFs saw monthly net outflows of $4.06 billion in June, the largest redemption record since their launch, directly causing BTC to fall from $110,000+ to the July low of $59,000.
• A Turning Point in August: Over the past 60 days, Bitcoin whales have accumulated approximately $2.75 billion, while ETFs turned back to net inflows in late August (exceeding $1 billion in a single week). Exchange balances continue to decline, with investors shifting to cold storage, indicating that selling pressure is drying up.
• Solid Cumulative Base: Cumulative net inflows into spot BTC ETFs remain at approximately $55 billion, with total assets under management of around $109 billion. This is the biggest difference between this cycle and previous ones—institutional capital is already in the market rather than waiting on the sidelines.
Driver 3: Cycle Position (Deeply Corrected)
• BTC’s maximum decline in the first half of 2026 was approximately 30% (from $111,000 at the beginning of the year to $59,000 in July), and its current price of $80,000 is in the middle of a rebound.
• Historically, in post-halving cycles (the April 2024 halving), the second Q4 often sees a second wave of gains due to reduced miner selling pressure and an institutional allocation window.
• However, it should be noted that this cycle is more institutionalized, so volatility may be smoothed out, making a repeat of the multi-fold gains seen in 2021 unlikely.
Driver 4: Ethereum’s Independent Logic
• ETH/BTC Exchange Rate: Currently around 0.031, it is in a historically low range. If risk appetite recovers in Q4, ETH typically has greater upside elasticity.
• Stablecoins and Tokenization: Standard Chartered raised its year-end ETH target from $4,000 in June to $7,500, primarily because the growth in network utility driven by stablecoin issuance and asset tokenization has not yet been reflected in the price.
• Yield Characteristics: ETH staking provides an annualized yield of approximately 3%–4%, making ETH more attractive than BTC as an “interest-bearing asset” in a falling-rate environment.
• Risk: Spot ETH ETF inflows remain consistently weaker than those of BTC. If this trend continues, ETH may continue to underperform.
IV. Key Indicators to Watch (Tracked Over the Next 3 Months)
1. September FOMC Decision: Rate hike vs. pause will determine the direction of Q4’s opening
2. Weekly Net Inflows into Spot BTC ETFs: Three consecutive weeks of positive inflows = confirmation of a bottom
3. Whether BTC Can Hold Above $85,000: This is the 200-day moving average level; holding above it would open up room toward $100,000
4. ETH/BTC Exchange Rate: A break above 0.035 = a signal that ETH is beginning to outperform
5. U.S. Inflation Data: If CPI continues to decline, rate-cut expectations will heat up again#美国8月非农超预期
BTC+0.47%
ETH+1.81%
IOST, an old public chain, saw a sweep.
There was no new mainnet upgrade today to account for this jump; it is a catch-up move among low-priced public chains.
$IOST
post-image
IOST+20.03%
The rate-hike knife went dull in two days
Friday’s nonfarm payrolls blew past expectations
The probability of a rate hike hit 70%
I bet this knife would cut down risk assets
Gold took a hit
Then recovered in two days and is still rising
Crypto wasn’t scared
SOL led the way, up 3%
I bet the rate-hike knife would cut the market down for a week
It cut air instead
I admit it
Rate hikes can’t scare this market
I was wrong and need to rethink it
But SOL rallied 3% on its own over the weekend in thin liquidity
I can’t tell whether it’s a breakout or distribution, so I’m st
post-image
GLDX-1.02%
PAXG-0.09%
SOL+3.96%
$ADA Signal】Long + 1H buying support/critical turning point
$ADA 1H buying pressure share surged to 0.61, with order book imbalance of 4.91% favoring buyers, while the price moved sideways along the EMA20. 4H MACD bullish momentum is weakening, but the histogram has not turned green. The 1H Bollinger Bands narrowed to 0.2173-0.2223, indicating the turning-point window is approaching. The funding rate is 0.01%, OI is stable, and long-short fees are balanced. The current risk-reward ratio is 1.5, with a stop-loss distance of approximately 1%, keeping the cost of testing the trade controllable.
post-image
ADA+2.91%
MARSCOIN market cap surpassed $265 million, setting a new all-ti
live-cover
LIVE1,607
Bingtang Orange precisely targeted a $51.3 million short position near 79.8K, which happens to be the core resistance zone recently. Daring to place such a huge bet at this critical level most likely means it detected some structural topping signal, or is convinced that the strong resistance at 81–82K cannot be overcome. The logic may not be absolutely correct, but as a reference for reading the market, it is highly worth observing.$BTC
post-image
BTC+0.47%
J.P Morgan will be at the Emirates today.
Arsenal Fans:
post-image
Everyone’s cheering NEAR’s green daily chart—but my 4h just whispered a 84% short. Are you long the wrong timeframe?

$NEAR /USDT - SHORT

Trade Plan:
Entry: 2.3645 – 2.3907
SL: 2.5406
TP1: 2.2554
TP2: 2.1739
TP3: 2.0516

Why this setup?
- Daily trend is bullish, yet the 4h momentum is cracking. RSI (15m) at 63.2 shows local exhaustion, not strength.
- Entry zone 2.3776–2.3907 is a magnet for late buyers—exactly where liquidity gets swept.
- ATR (1h) at 0.0522 means volatility is alive; a rejection here can slide to TP1 (2.2554) before the daily bulls wake up.
- Why now? Price is stal
NEAR+6.49%
$ZAMA
UPDATE
#ZAMA is getting ready for a good bullish wave. Expecting 50%+ gain here ✍🏻
#ZAMAUSDT #ZAMABTC #BTC #Bitcoin #NFTs
post-image
ZAMA+13.67%
BTC+0.47%
Everyone’s staring at DASH’s range—but the 4h chart just whispered a secret that most will ignore until it’s too late.

$DASH /USDT - SHORT

Trade Plan:
Entry: 68.55 – 70.27
SL: 77.71
TP1: 63.19
TP2: 59.04
TP3: 52.81

Why this setup?
- Price is hugging 69.41 while RSI (15m) sits at 48.05—no momentum, just a coiled spring.
- ATR (1h) at 3.45 means volatility is about to snap; the range’s middle is the perfect trap zone.
- Why now? The 1D trend says “range,” but the 4h SHORT signal (55.4) is armed—TP1 at 63.19 is a 9% drop before you blink.
- If we lose 68.55, the path to 59.04 (TP2) op
DASH+0.80%
Only one of these prints in 2026.
$TAO at $1,000
or
$ONDO at $5
One is a supply squeeze on decentralized AI.
The other is a fee switch on tokenized Treasuries.
Both are real. Only one gets there first.
Pick one. Defend it in one line.
post-image
TAO-0.94%
ONDO+2.87%
$FLOCK 24-hour surge of 49.92%, but smart money is voting with its feet—are you still chasing the pump to become exit liquidity?
Look closely: the current price is 0.0781, with a high of 0.0818, a low of 0.0508, and $179 million in trading volume. This kind of volume is lively for an altcoin, but the problem is that the pump is happening too fast. It took just one day to rise from 0.05 to 0.08—a classic tactic of coordinated buying to drive up the price before dumping. I’ve been monitoring on-chain data: the number of addresses making large transfers into exchanges has increased by 17% over th
FLOCK+40.69%
Most traders will ignore $LINK /USDT at 12.24—that’s exactly why this 95% confidence signal is dangerous.

$LINK /USDT - LONG

Trade Plan:
Entry: 12.212 – 12.274
SL: 11.943
TP1: 12.468
TP2: 12.618
TP3: 12.844

Why this setup?
- 4h timeframe says LONG, with a 1D trend still bullish—no fight between timeframes.
- RSI (15m) at 54.59 gives room to run before overbought, not exhaustion.
- Entry window is tight (12.212–12.274). TP1 at 12.468 is just 1.8% away—momentum is armed, not fading.
- Stop at 11.943 keeps risk defined below the invalid line (11.458).
- Why now? ATR (1h) of 0.125 sh
LINK+4.46%
Market prediction
live-cover
LIVE1,900
My hand trembled slightly when I set the stop-loss a few days ago; this morning, I realized that extra precaution had been unnecessary. Before the market had fully kicked into gear, I saw constant selling pressure on $TRUMP /TRUMP during the rebound, and the volume looked off too—classic low-volume rebound. Veteran traders know that this kind of rebound is a paper tiger, collapsing at the slightest poke.
The last thing I saw before bed was 2.36 starting to move downward, and the short position opened at 2.566 played out perfectly. It felt great—the high-level resistance trade was executed with
post-image
TRUMP-0.84%
BNB+1.16%
LAB-2.32%
$XRP A long position has been entered.#BTC收复8万美元
post-image
XRP+1.13%
Everyone’s cheering the 1D uptrend, but my 4h chart just whispered a dirty secret about HYPE.

$HYPE /USDT - SHORT

Trade Plan:
Entry: 87.624 – 87.974
SL: 89.980
TP1: 86.164
TP2: 85.073
TP3: 83.438

Why this setup?
- RSI on the 15m is already at 66.74—overheated in a downtrend.
- ATR (1h) at 0.6989 means volatility is ripe for a snap.
- The 1D bullish trend is the bait; the 4h SHORT (84 confidence) is the trap door.
- Entry zone 87.62–87.97, with TP1 at 86.16—that’s a 1.8% drop before the daily bulls even wake up.
- Why now? Because price is stalling right under 88.00, and the inval
HYPE+3.71%
SOLV leans toward Bitcoin staking/on-chain bonds. No new large TVL announcement was singled out today, making this a secondary catch-up rally following the recovery in risk appetite.
$SOLV
post-image
SOLV+15.75%
Load More

Join 40 M users in our growing community

⚡️ Join 40 M users in the crypto craze discussion

💬 Engage with your favorite top creators

👍 See what interests you

View More