Square
Following
Hot
News
Profile
Share your thoughts
placeholder
Article
$Lobster breakout is imminent! Technical indicators have all formed golden crosses—are you on board? Where is the next target? #Gate.io 🔥🚀 #Gate广场中秋团圆局
龙虾+24.41%
10/09 07:00 Market Brief|Coinbase 24h
All three fell; falling less does not mean they have strengthened. BTC -1.64%, SOL -4.94%, a difference of 3.30 percentage points.
SOL is currently $110.23, 5.60% below its 24h high. This is relative performance, not a breakout signal.
#Crypto
post-image
BTC-1.65%
SOL-5.99%
I do believe this remains $BTC the most likely scenario.
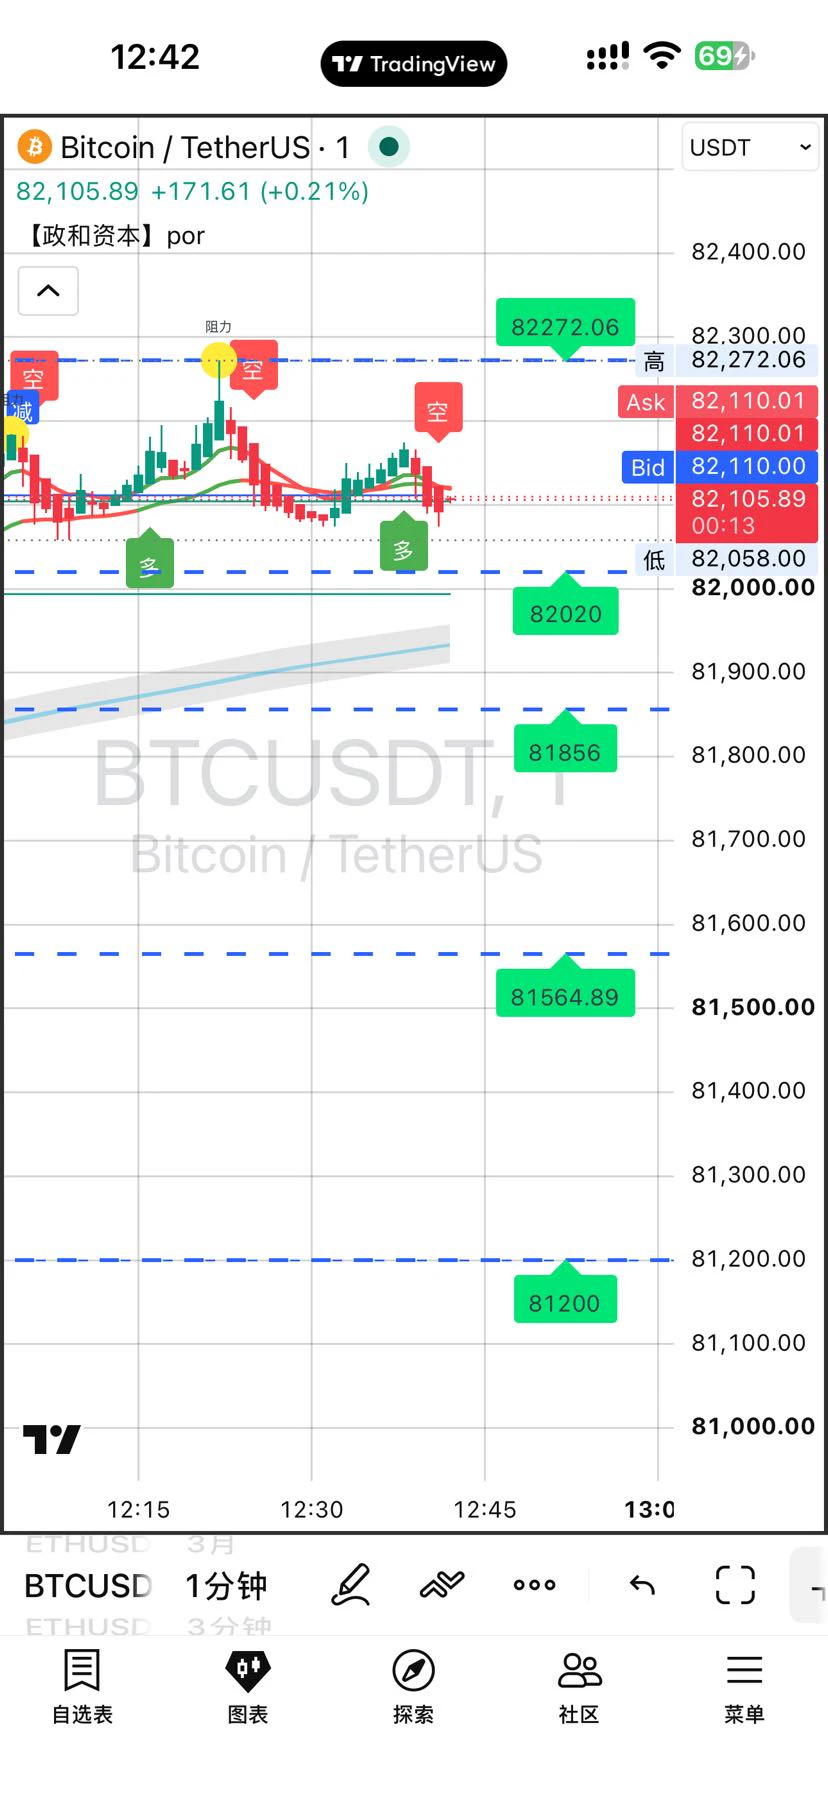
Shorting could become interesting around the $82,000–$82,500 area.
Since we failed to hold $82,000, this level has now turned into resistance.$BTC
post-image
BTC-1.68%
Layout: Bitcoin, Ethereum, Dogecoin
live-cover
LIVE880
  • 6
ETH rose 0.91% within a 15-minute window, marking a technical rebound after a sharp drop: short-term RSI was deeply oversold and a hammer candlestick appeared, but ETH spot ETFs have recorded net outflows for seven consecutive trading days, while whales’ $252 million in long positions are nearing liquidation prices. Buying support is limited, with the rebound coexisting with pressure.
post-image
ETH-3.51%
I did nothing—just went to the restroom, and when I came back, the candlestick chart had already done the work for me.

I was watching $HOOKED while it was bottoming out intraday. It held after the pullback, and buying pressure was clearly strengthening. My bullish call was simply to wait patiently for confirmation. While others were still doubting, I had already written out the plan: hold if it doesn’t break down; accept it if it does. At levels like this, impatient people get nothing—only the steady-handed get their share. I don’t guess the top or the bottom; I only trade the move after con
post-image
BNB-4.81%
SNDK-4.95%
Gate Web3 – your bridge to the blockchain era:
The Federal Reserve's September meeting minutes reshaped market expectations regarding the interest rate path. The 25 basis point rate hike decision at the September 15-16 meeting was supported by all 19 officials, raising the federal funds rate to the 3.75-4.00% range. The minutes show that a large majority of participants considered another hike by the end of the year "likely appropriate." However, the immediate emphasis on "data dependence" and the lack of clear guidance regarding the October meeting led the market to interpret the minutes as "hawkish but unhurried."
This interpretation is
post-image
Gate_Square
🎉 Win Up to 100 USDT Weekly! Gate Square #WeeklyShare Is Ongoing!
📌 How to Join
① Sign up 👉 https://www.gate.com/campaigns/6244
② Post with #ShareWeekly and #FedSeptemberMinutesLeanHawkish, share analysis
💬 This Week’s Hot Topic
September’s minutes were hawkish, but October hike odds have fallen below 20%. The Oct. 14 CPI could be key. Will the Fed hike in October?
💡 Discussion
1️⃣ How would hotter-than-expected CPI affect hike odds?
2️⃣ How could Fed expectations impact crypto & U.S. stocks?
3️⃣ Is the current outlook already priced in?
Share your market view to win rewards 👉️ https://www.gate.com/post
repost-content-media
CME+2.29%
BTC-1.65%
ETH-3.51%
  • 1
  • 1
Today, we are only verifying one question about $BCH : whether buying support remains after a breakout above 302.
The 1-hour and 4-hour trends are weak, with RSI at 29 and 8, respectively. The current price is 273.9, about 2.01% from the 1-hour support at 268.4 and 10.26% from the resistance at 302. The 24-hour change is -8.97%, but it cannot replace confirmation at key levels.
My view is not based on chasing rallies or selling into declines: first wait for a breakout above 302 or a drop below 268.4; whichever happens first will determine how we revise our assessment.
Would you rather be
post-image
BCH-8.48%
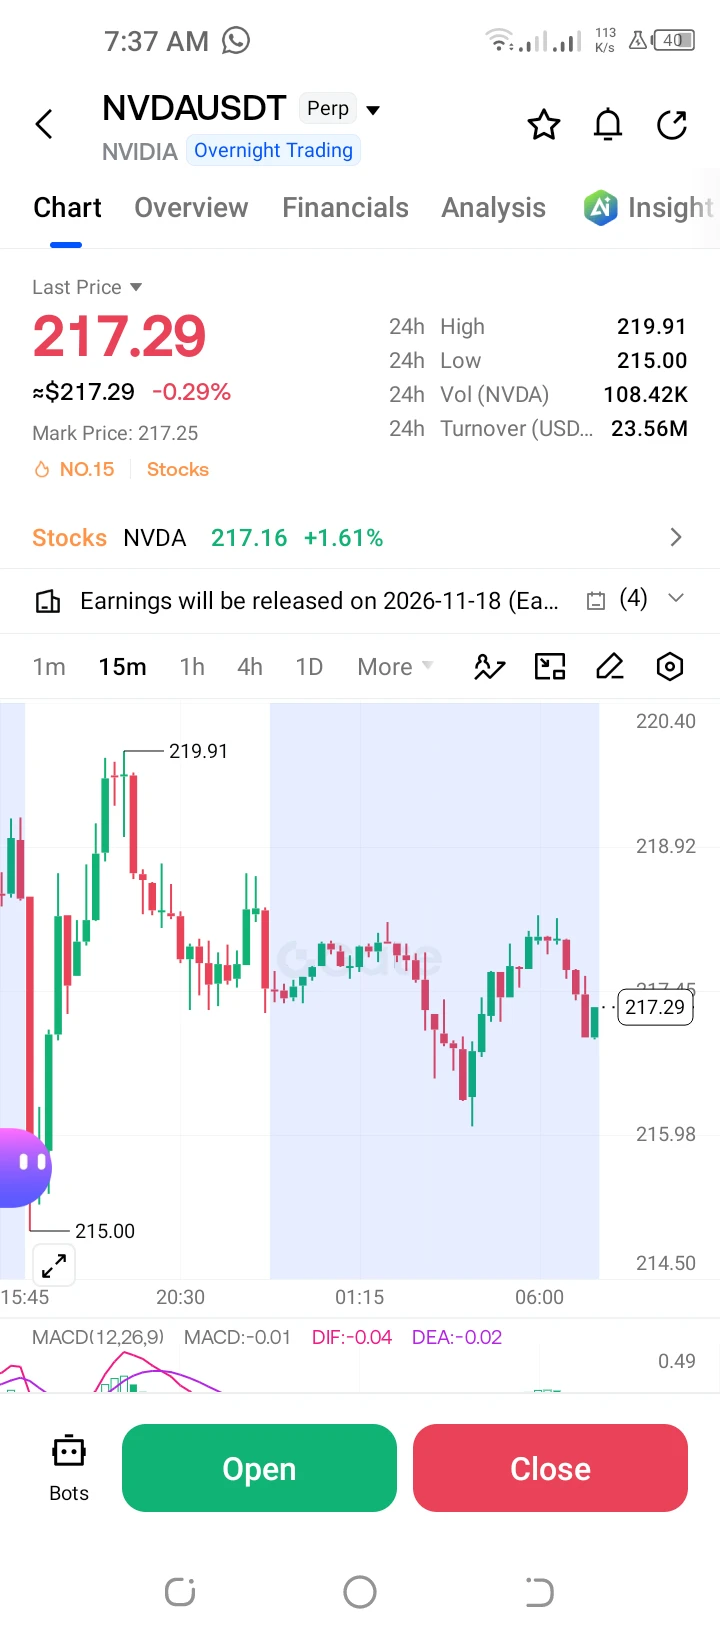
The day before yesterday, someone said NVIDIA hit a new high, and many retail traders started fantasizing that the AI bull market would continue. How is that any different from FOMOing into BTC at $126k?
In many cases, the final subwave of Wave 5 has to set a new high,
This is not the bull market continuing, but a signal that the bull market has reached its highest point.
If you short it at this point, the win rate is absurdly high.
#NVDA #英伟达 #BTC
post-image
NVDA-2.86%
BTC-1.65%
$OGN ’s strength remains, and so does the rising crowding risk
$OGN 24-hour +85.19%, current price 0.04228. The 1-hour and 4-hour RSI are 62 and 77, respectively. The strength is real, and so is the crowding. The question is not whether it can continue moving higher, but who will be willing to catch it on the first pullback.
The bears also have clear invalidation lines. A break below the 1-hour support at 0.02243 would mean short-term buying support has failed the test; if the 4-hour support at 0.02034 is also broken, the previous assessment of strength or recovery must be rewritten. Views can
post-image
OGN+81.92%
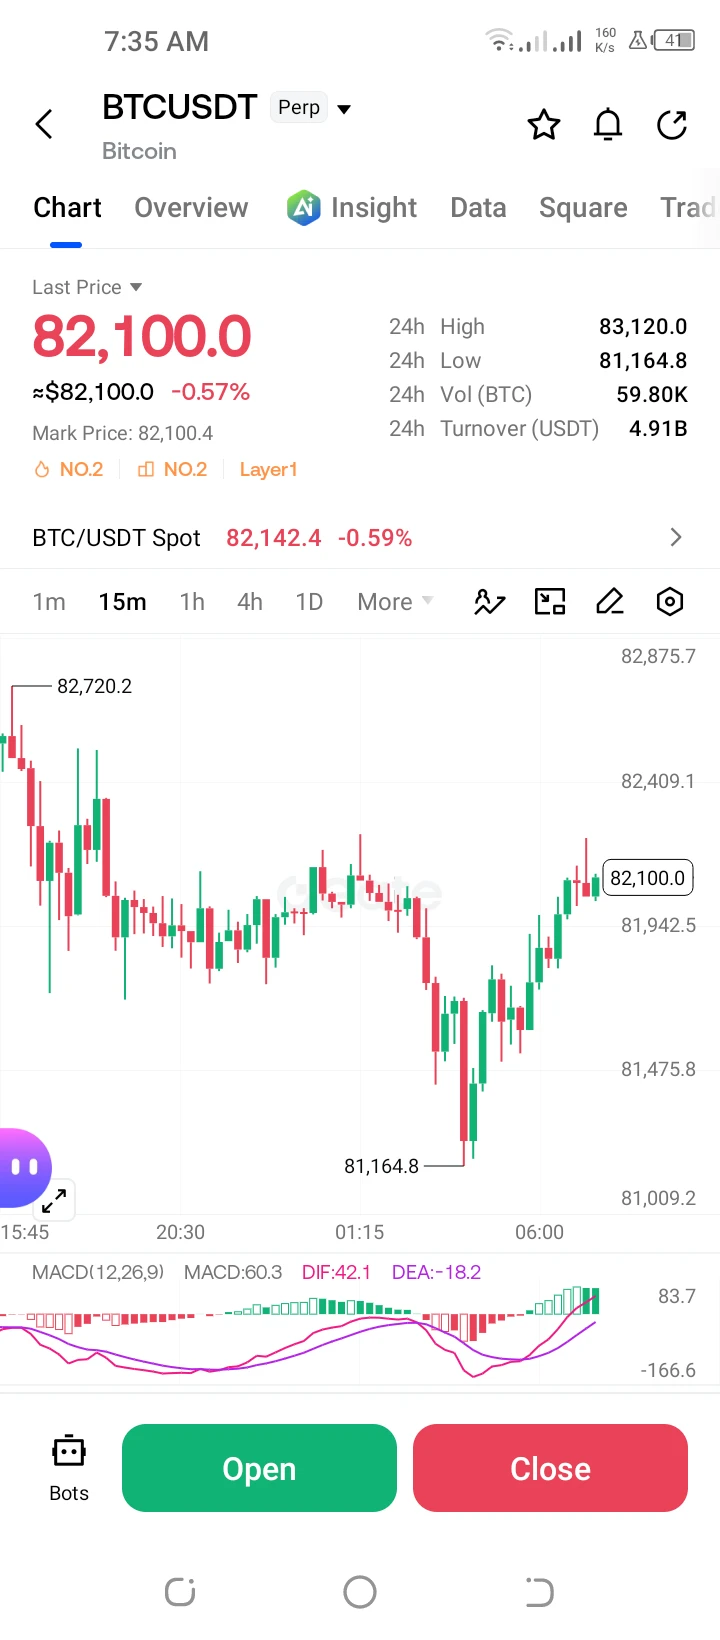
Despite such a steep drop, Dogecoin remains remarkably resilient.
post-image
DOGE-5.52%
$WLD Conclusion first: The trend has not recovered; the rebound is a recovery rather than a reversal. The current bias is bearish: only buy dips within the range, and do not chase longs.
Use moving averages to determine whether the trend is healthy, focusing only on two things: the price’s position relative to the moving averages, and the arrangement of the short- and long-term moving averages. Currently, MA5=0.48182 is below MA20=0.49909, confirming a bearish alignment and indicating that the medium-term trend is still dominated by sellers. Any rebound will first face selling pressure near M
post-image
WLD-7.57%
LDO-11.85%
UNI-9.59%
$ETH A pullback and lower prices are a good opportunity to enter. Position in advance and build positions in batches to reduce investment risk. The AI futures grid bot strategy splits funds into multiple portions and buys and sells at different price levels. Compared with investing all at once, it can effectively diversify risk and is particularly suitable for emerging assets such as highly volatile cryptocurrencies. .#GateMoney正式上线 #美联储9月纪要偏鹰
ETH-3.51%
$SAND is currently the weakest of the three candidates, but precisely this combination of oversold conditions and negative funding gives me a reason to go long in the short term.
First, looking at relative strength: SAND fell 14.20% over 24h, significantly more than $CRV ’s 10.60% and $XRP ’s 2.41%; although the RSI of 35.5 has not reached an extreme, combined with the 25.66% amplitude across 30 candlesticks, it shows that selling pressure has been released in a concentrated manner. By comparison, $XRP ’s RSI is 47 and its MACD histogram remains positive, making it a relatively resilient asse
post-image
SAND-13.23%
CRV-13.67%
XRP-2.32%
crypto market update
live-cover
LIVE21
$SOL has entered the oversold zone, but “it’s due for a rebound” and “it has bottomed” are completely different things.
I’m watching just one divergence: whether there is still buying support after breaking above 116.81. The current price is 110.33, with volume at 0.11x. The 1-hour and 4-hour trends are both weak, with RSI at 33 and 18, respectively.
If volume continues to expand after breaking above 116.81, control will favor the bulls; if it breaks below 105.71 and fails to reclaim it, the short-term outlook is invalidated. Stop trying to call the bottom for now and wait for a new support s
post-image
SOL-5.99%
The entire sector is broadly up, so why is AMP more worth watching?
The answer lies in the mismatch between relative strength and volatility elasticity. $AM is up 17.65% over 24h, outperforming $PYTH at +14.11% and $AERO at +3.99%, yet its RSI is only 55.4, the lowest among the three—AERO has reached 60.9, while PYTH is as high as 66.5 and nearing the Bollinger upper band at 0.08389. AMP, meanwhile, is currently at 0.00068, still above the Bollinger middle band, with approximately 11% room remaining to the upper band at 0.00075698. This means AMP combines “leading gains with non-overheated
post-image
AERO+4.33%
  • 1
A hand that set the stop-loss a few days ago trembled slightly; this morning, I realized that filial piety was unnecessary. 😐
A few days ago, while the market was grinding out a bottom in the afternoon session, I had already set my sights on this rebound. Every push upward fell just short, with heavy selling and no one buying higher. I judged that the price was stagnating at the highs, so a short could be tried. Someone asked whether it would break out, and I said: the volume isn't enough; the breakout is just a fake move. While everyone else was running, I was calmer because I knew the trapp
post-image
NMR-9.47%
XRP-2.35%
SNDK-4.95%
$NEAR enters oversold territory; a rebound and a bottom are two different things
$NEAR 24-hour -15.82%, current price 4.519. The 1-hour and 4-hour RSI readings are 16 and 34, respectively. Oversold conditions create demand for a rebound, but a rebound only shows that the decline was sharp; a bottom still requires the price to stop breaking down structurally.
Volume has not backed the move: current 1-hour trading volume is only 0.12 times the average volume of the previous 20 candles. Low volume can still move the price quickly, but sustainability must be proven by the next leg of the move. A s
post-image
Load More

Join 40 M users in our growing community

⚡️ Join 40 M users in the crypto craze discussion

💬 Engage with your favorite top creators

👍 See what interests you

Trending Topics

Gate Money Officially Launches

3.46k Views12.88k Discussing

Gate officially launches Gate Money, a global integrated financial services app that brings digital assets, fiat, stocks, ETFs, gold, bank accounts, and payments into one Gate App. Users can manage assets, invest, send and receive funds, convert currencies, and make payments — all from a single account. Which use case are you most excited about? [👉 Learn more](https://www.gate.com/announcements/article/102094)

Fed September Minutes Lean Hawkish

64.17k Views2.72k Discussing

Samsung Q3 Operating Profit Surges 782.5%

36.94k Views1.93k Discussing

View More