Square
Following
Hot
News
Notifications
Profile
Share your thoughts
placeholder
Article
$HUMA Only 9 hours left to determine whether 0.0116 is rock bottom or just halfway down. It’s at 0.0117 now, down 9.3% in 24 hours, with the low of 0.0116 right beneath us. Trading volume of 17.3M shows panic selling on rising volume—this kind of high-volume plunge is either the final drop or the prelude to a sell-off, with no middle ground.
Let’s run through the scenarios. First, if the 4-hour candle at 0.0116 closes with a lower wick and shrinking volume, that’s a spot to try for a short-term bounce: enter near 0.0117, set a stop-loss at 0.0112 (exit if it breaks the previous low), and targe
HUMA-1.99%
🐋 WHALE WATCH : The US Treasury is buying back up to $95B of its own debt over the next three months. $70B targets older Treasuries to improve trading liquidity. $25B covers short-term Treasuries to manage cash balances.
Smoother Treasury markets push fresh liquidity into the financial system. Stocks and crypto tend to notice.
post-image
Trenches
ZIG
Z
bade
b
ZIG
0x8c...1145
Market Cap
$.
Change
.
24h Vol
$.
Holders
.
STONK
S
bade
b
STONK
6GmA...UNgx
Market Cap
$.
Change
.
24h Vol
$.
Holders
.
IDOL
I
bade
b
IDOL
0x3b...ab07
Market Cap
$.
Change
.
24h Vol
$.
Holders
.
MAGGIE
M
bade
b
MAGGIE
8rHo...PmZV
Market Cap
$.
Change
.
24h Vol
$.
Holders
.
FLOAT
F
bade
b
FLOAT
Bv1a...BMmr
Market Cap
$.
Change
.
24h Vol
$.
Holders
.
#StakeOnLaunchpoolToShare450KVLX #ShareWeekly
Stake Your Tokens on Gate Launchpool to Share in ~450,000 VLX Rewards – A Clear Opportunity to Put Idle Assets to Work
Gate continues to deliver practical ways for users to earn new tokens without forced selling or complex trading. The latest Launchpool (Project #386) centers on ValueX (VLX) and offers participants the chance to share a total reward pool of 454,546 VLX (commonly referred to as the 450K VLX pool) by staking eligible assets. Rewards distribute hourly and unlock fully into your spot account. This is a straightforward staking campaign
  • 3
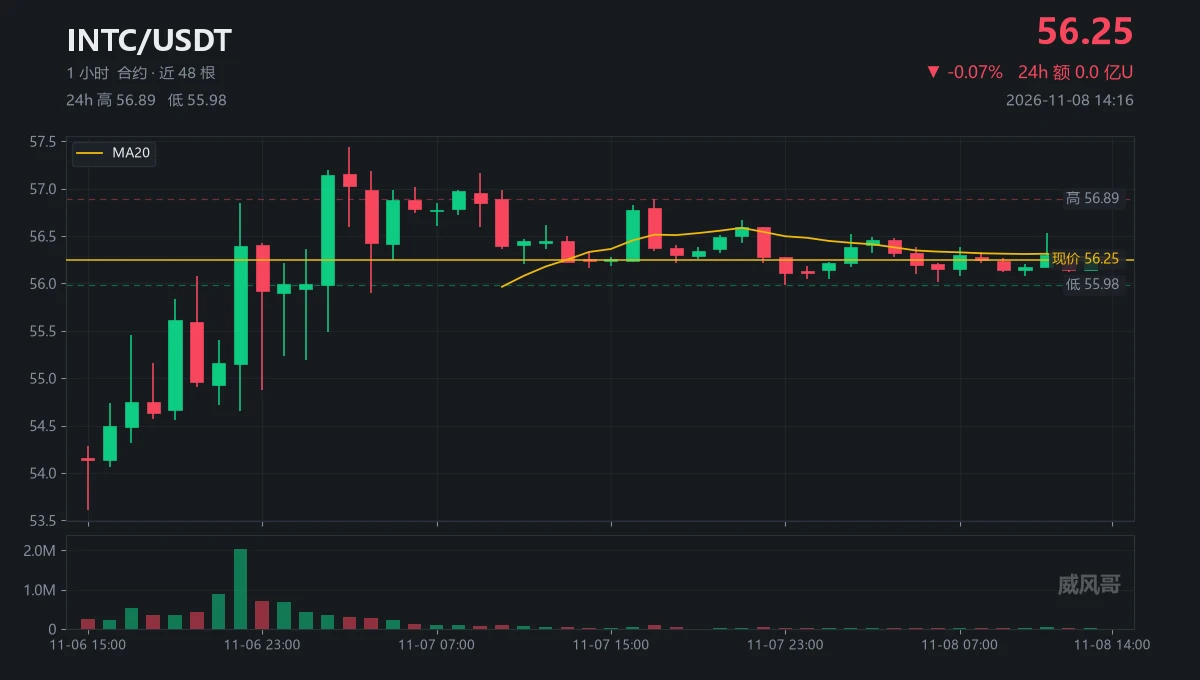
53.61 to 57.44
Twelve hours, 7.15%; this stretch had nothing to do with me.
$INTC That move happened while I had no signal; when I looked back, the price was already above 56.
The money from the second move wasn't mine; chasing in would just mean holding the bag for someone else.
Now it's 56.25, ma20 is 56.274, a difference of 0.024, right on this line.
The high of 57.44 was touched at 11-07 03:00, and it hasn't been touched again in the eleven hours since.
The low of 55.98 was at 11-07 23:00; it didn't manage to hold there either.
Funding rate: -0.0103%; shorts are paying overnight fees, but
post-image
INTC+0.05%
Tong Ge's 11.8 ETH outlook
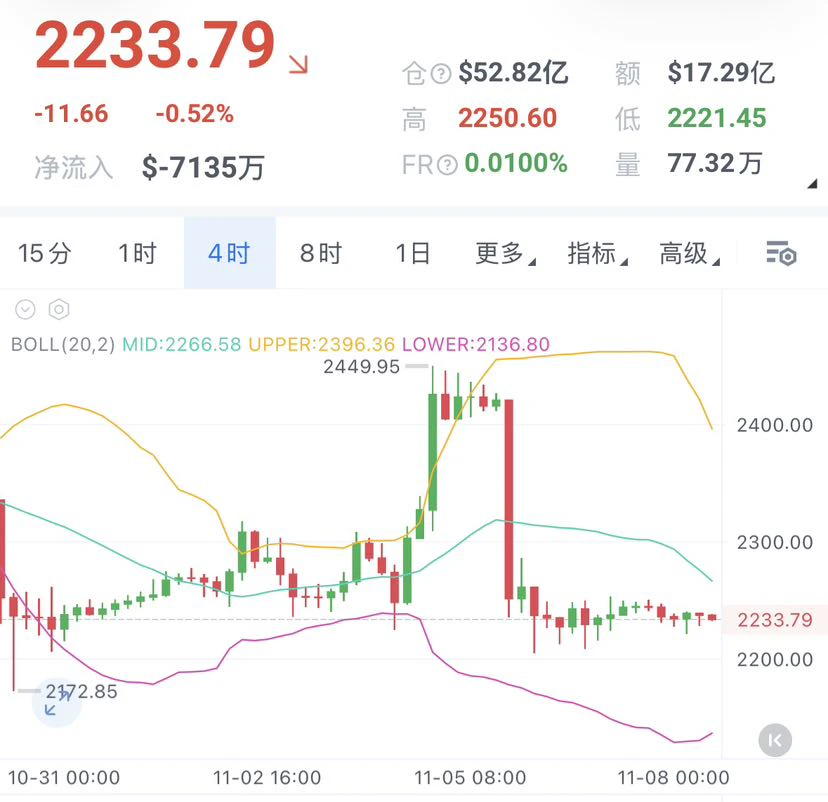
$ETH Short around 2250-2270, stop loss at 2290, targets: 2210-2180-2150.

After the nearly 500-point A-shaped crash a few days ago, ETH has clearly lost momentum over the past two days, grinding back and forth within a range of just 20 to 30 points.
Seeing that it has stopped falling, many people are starting to wonder if the bottom is in, with their hands already reaching for the buy-the-dip button.
A reminder from Tong Ge: the fact that it has stopped falling doesn't mean it's ready to rise.
Looking at the charts, the 1-hour Bollinger Bands continue to contract, an
post-image
ETH-1.23%
After going through the period from May to October, I’ve been cramming lately and studying A-shares in depth. I’ve started to get a tiny bit of a feel for how things work 😎
I used to think that if a company had good performance and a great financial report, it was safe to buy in. But after learning more, damn, there are so many frauds. You have to pore over every word of the financial reports.
I have to say, the listed companies in A-shares really have some deep tricks. As soon as the stock price hits a peak, major shareholders immediately announce personal share reductions, cashing out hundr
post-image
#CPI数据前瞻 October CPI is expected to be released around 9:30 Beijing time on November 11. The market broadly expects inflation to cool, so weak data may have a limited impact; only hotter-than-expected figures are likely to trigger significant volatility.

How BTC, U.S. stocks and gold could react under three scenarios
·In line with or slightly below expectations: Rate-hike expectations are unlikely to change much. U.S. stocks may trade unevenly, while gold and Bitcoin may see a muted reaction.
Headline inflation elevated, core inflation cooling: The market may think the Fed can wait and see. T
BTC-0.67%
SPX500+0.19%
NDAQ+0.28%
Bitcoin is currently trading at around $75,834. Based on the 4-hour and daily charts, the overall trend remains in a correction phase. There are signs of short-term stabilization, but no clear reversal signal has emerged on the daily chart.
On the 4-hour chart, the price is fluctuating around $75,800, and the MACD histogram has turned slightly positive, indicating that short-term downward momentum has weakened somewhat, though the strength of the rebound remains to be seen.
On the daily chart, the MACD remains bearish, indicating that medium-term correction pressure persists. A trend reversal
post-image
BTC-0.65%
Will Gold Take Off or Plunge? U.S. CPI Is Coming, and Gold Prices Are at a Critical Moment!

Gold may be busier than investors lately, dealing with dollar fluctuations while also keeping an eye on the Fed’s interest rate outlook!
On November 10, the U.S. October CPI report is due, and the data could give the gold market a new direction.
First, the logic:
If CPI comes in below market expectations, it could signal easing inflationary pressure and fuel expectations for rate cuts.
If the dollar and Treasury yields fall in tandem, the opportunity cost of holding gold could decline, potentially supp
NVDA+2.80%
  • 29
$NVDA backed artificial intelligence infrastructure company Groq is seeking fresh funding at an $8 billion valuation, more than doubling its valuation in three months despite a selloff in publicly traded data center operators, Bloomberg reported exclusively, citing investor documents.
Reuters
post-image
NVDA+2.80%
[New Streamer] Market Prediction
live-cover
LIVE1,548
#USStocksFaceHistoricSelloff #ShareWeekl
US Stocks Face Historic Selloff: Market Volatility and Investor Concerns
The U.S. stock market is facing growing pressure as investors navigate heightened volatility, economic uncertainty, and changing expectations about interest rates. A historic selloff can significantly influence investor sentiment, global financial markets, and cryptocurrency prices.
Why Are U.S. Stocks Facing Selling Pressure?
Several factors can contribute to a major stock market decline:
1. Technology and AI Stock Valuations
Technology and artificial intelligence companies have a
post-image
BTC-0.67%
The Nasdaq fell 6.4% in a single day, a sharp drop even by the standards of recent years. The last time it was this bad was March 2020. Back then, the pandemic shock collided with tight dollar liquidity, sending markets into a series of steep declines. Many high-quality assets were sold indiscriminately until the Fed slashed rates and restarted monetary easing, and the sell-off gradually began to ease. So I’m more inclined to see this downturn as a systemic valuation reset amid tightening liquidity, rather than a problem with any one company. I don’t think this correction is over, but I’m not
post-image
NVDA+2.80%
  • 14
BTC Market Cycle Analysis: How to Identify the Different Stages of Bull and Bear Markets?
In the BTC market, many investors are accustomed to judging market conditions based on short-term price movements, while overlooking a more important question: Which stage of the market cycle are we currently in? Understanding market cycles can help traders develop better strategies instead of using the same trading approach at every stage.
First, the accumulation phase. After a downturn, prices gradually stabilize, market interest is low, and trading volume may be relatively subdued. This phase is usuall
post-image
BTC-0.67%
$LYN Down 17.49% in 24 hours—this isn’t a shakeout; it’s capital scrambling for the exits.
The current price is 0.0246, hovering right above the 24-hour low of 0.0240. From today’s high of 0.0307, it has now given up a full 20% of its range. The 67.0M in trading volume says it all: this is a high-volume drop, not a low-volume slide. It means people are genuinely cutting losses and exiting, not that this is a dead market with no buyers. These are fundamentally different patterns—don’t confuse them.
My take: the main driver of this drop is concentrated profit-taking by earlier buyers, not some d
LYN-0.44%
2x1 on Doritos until Bitcoin recovers its value.
post-image
BTC-0.67%
EVENT CONTRACT
live-cover
LIVE2,273
#CPI数据前瞻 #广场交易达人 #WCTCS9 Countdown to CPI Night: 77% Rate Hike Bets Await a Verdict, Three Scenarios for BTC, U.S. Stocks, and Gold

At 21:30 Beijing time on November 10 (Tuesday), U.S. October CPI will be released.
This is no ordinary inflation data release—it is the final gate before the Fed's December meeting.

【First, take stock】
September CPI rose 0.6% month over month, its biggest increase in five months; year over year, it was up 3.7%. Core CPI rose 0.3% month over month and 2.6% year over year, rebounding across the board and exceeding expectations, with energy prices the main drive
BTC-0.65%
GLDX-0.40%
NAS100-0.07%
Load More

Join 40 M users in our growing community

⚡️ Join 40 M users in the crypto craze discussion

💬 Engage with your favorite top creators

👍 See what interests you

Trending Topics

USCPIDataIncoming

3.48k Views1.52k Discussing

The U.S. October CPI report will be released on November 10 at 8:30 a.m. ET. September CPI came in at 3.7% year over year, and markets will be watching closely for signs that inflation is cooling, especially in core CPI. A softer-than-expected reading could strengthen rate-cut expectations, while hotter inflation may pressure risk assets through higher Treasury yields and a stronger dollar. How do you think this CPI print will move $BTC, U.S. stocks and gold?

USAIStocksHitHard

24.54k Views3.7k Discussing

USNonfarmPayrolls

43.56k Views4.43k Discussing

View More