
Share your thoughts
placeholder
Article
I think the biggest difference between me now and me in 2024 is that I’ve given up some childish ideas, such as thinking that everyone can be “saved”···
I only choose; I don’t force anything. If I feel we can’t communicate, I don’t communicate. If a conversation feels uncomfortable, I don’t continue it. If I feel someone can’t be carried along, I don’t carry them. Suddenly, the whole person feels much more relaxed.
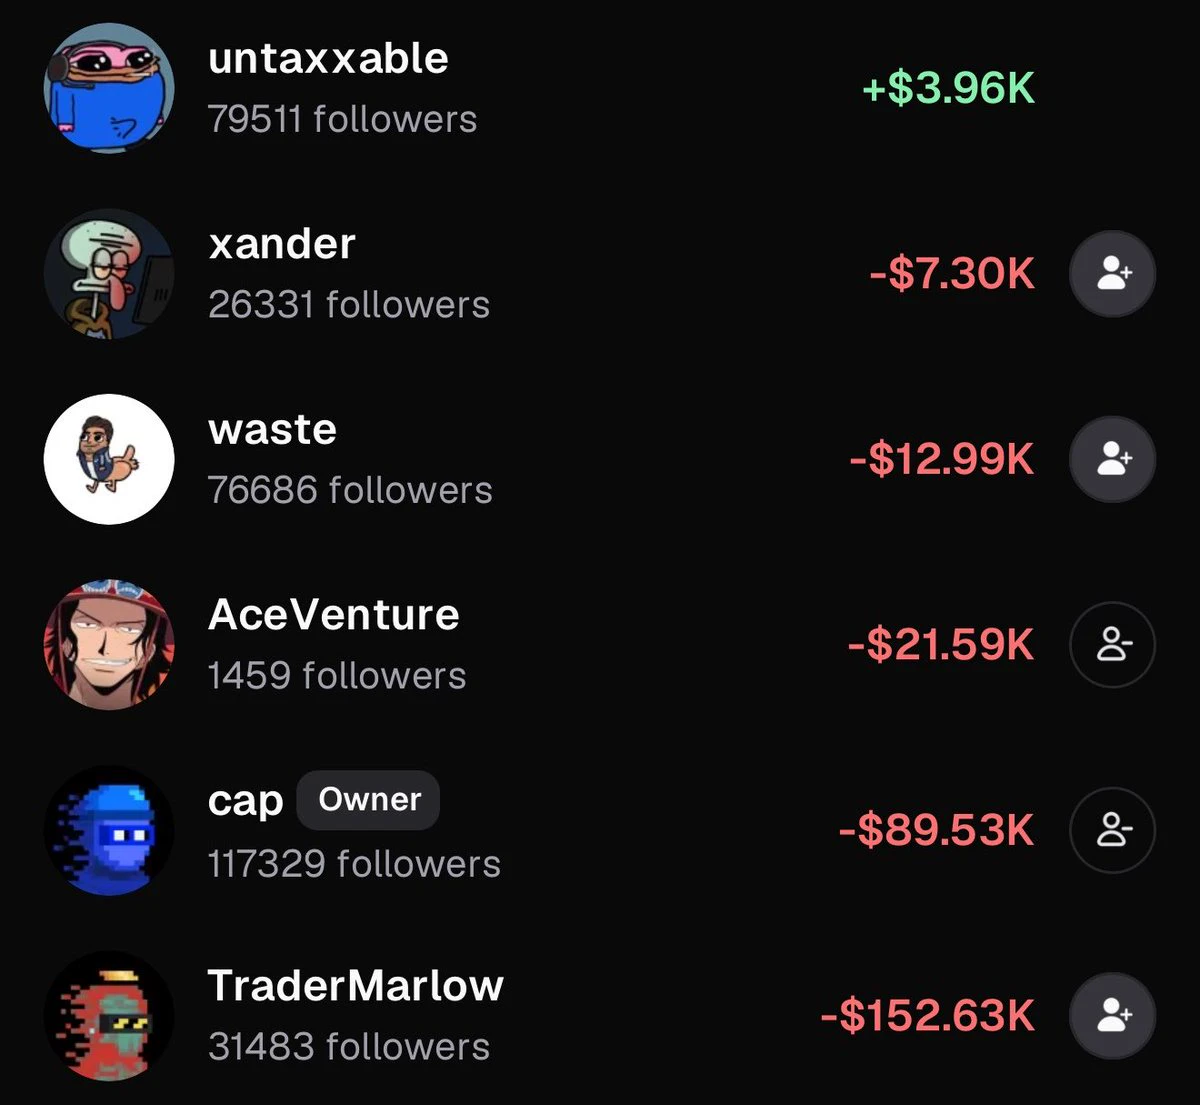
After all, making money won’t get me a single cent, while there are simply too many people who whine and complain when they lose money···
I shouted to buy the dip, but they
post-image
BTC BOLD MOVES
live-cover
LIVE51
With just hours remaining until the weekly close, I thought it was worth sharing this fractal from the last time $BTC attempted to break above the 50-week MA, just in case it proves relevant this time around 👀
post-image
BTC+0.13%
#GateTops7DayNetInflowsGlobally
Weekly Net Inflow Crown Goes To Top Trading Venue
A fresh weekly read on capital flow shows a clear leader at the top. One major trading venue has posted the largest net inflow across the global market for the past weekly window, pulling ahead of all rivals. The data points to strong user trust and a wave of fresh deposits aimed at spot and derivatives books. In a time when traders move funds with care, this kind of lead is seen as a strong vote of confidence.
① Why Net Inflow Matters For Market Health
Net inflow tracks the gap between funds added and funds tak
MU+5.89%
NVDA+0.87%
SNDK+11.88%
TSLA-5.96%
AAPL-2.51%
  • 9
time to change this
post-image
Layout for Bitcoin, Ethereum, and Dogecoin
live-cover
LIVE3,598
  • 1
Hope you touch some grass today?
See you tomorrow.
post-image
  • 6
Since early February 2026, Bitcoin has remained in a bear market after falling below both the True Market Mean and Short-Term Holder Cost Basis.
The Short-Term Holder Cost Basis has now dropped to $68.5k, below the True Market Mean at $75.8k. This means Bitcoin is trading below the cost basis of both recent buyers and the broader investor base.
Historically, this setup is linked to the capitulation phase, where market bottoms often form. As long as Bitcoin stays below the Short-Term Holder Cost Basis, the market remains in a capitulation phase—creating opportunities for new buyers, but leaving
post-image
BTC+0.13%
  • 3
  • 2
Everyone’s staring at ENA’s 4h chart—but the 15m RSI just whispered a secret that 90% of traders missed.

$ENA /USDT - SHORT

Trade Plan:
Entry: 0.17465 – 0.17637
SL: 0.18375
TP1: 0.16933
TP2: 0.16521
TP3: 0.15903

Why this setup?
- Price is pinned at 0.17551, but our MTF (4h) says SHORT with 55.4 conviction.
- Daily is *range*, not trend—so this is a scalp, not a story.
- 1h ATR (0.003434) is tight; the real juice is below: TP1 at 0.16933, TP2 at 0.16521.
- Why now? The 15m RSI (62) is hot while price stalls—classic bull trap fuel before a flush to the low 0.17s.

Debate:
If ENA sli
ENA+7.02%
I didn’t chase the first rally because the price was too far above the moving average, and entering then would have made it easy to get stopped out by a wick. After the pullback stabilized, I entered at 828.40 for this $ZEC long.
After entry, the market entered a weak consolidation, with increasingly narrow fluctuations and sharply declining volume. This kind of situation tests patience the most, and many people were worn down into manually stopping out. I held my core position without moving it and only gradually tightened my stop-loss.
When the consolidation range broke out on increased volu
post-image
ZEC+20.79%
SOL+2.25%
BNB-2.80%
YO WTF JUST HAPPENED???
post-image
i just cooked a video i think you guys will love, had fun shooting it as well
but for now its time to goodnight
and the trenches have me feeling that way below
#Gate事件合约晒单挑战
#XRP Ledger Shows Bigger Value Despite Fewer Active Accounts
Q2 ACTIVITY SHIFT
The latest XRP Ledger data shows an interesting divergence in network activity. Daily active accounts fell 24% year over year to 16,600, but average daily order-book volume increased 79% to 3.57 million XRP.
That combination matters. Fewer active accounts are participating, yet the amount being traded through the order book has increased significantly. This suggests that the activity that remains is becoming more concentrated around larger transactions rather than being driven purely by a growing num
post-image
XRP-0.17%
RLUSD0.00%
The first three are alpha
The latter three are boomer assets
post-image
#CBRS
$CBRS ‌/ Cerebras Systems - 4-Hour Chart Detailed Support / Resistance Analysis
Data: Price 209.94 +10.26% - Intraday High 216.90 Low 190.45 - Range 13.89% very volatile. MA5:197.02 MA10:188.20 MA30:196.42 MACD:4.59 DIF:-2.07 DEA:-6.66
1. GENERAL STRUCTURE
The chart is in a bottom-reversal formation. There is a 40% drop from the 269.39 top on the left to the 160.81 bottom. After 08/03 it rallied to 261.54 and then got sold again and returned to a bottom near 160s. Now it is the second bottom reversal. The TD Sequential signals with red 9 (bottom) and green 9 (top) on the chart have wor
CBRS+10.26%
  • 8
No vision, can’t hold on—this round’s profit is indeed as thin as paper, but I love it. When I opened the chart this morning, $OP didn’t break out directly; instead, it kept making fake moves around 0.11747. There were no buyers on the way up, and volume didn’t follow, so the short position was put in place just like that 💪.

The price has now moved to 0.10892 on its own, with a paper gain of +350.92%%. The rhythm was timed perfectly—this is exactly the feeling. Brothers on board, enjoy this bite of profit.

Don’t lose patience grinding through the range, only to try to regain your dignity
post-image
OP+5.40%
ETH+0.78%
SNDK+1.09%
This trend is so obvious I don’t even need to think—the account is out there partying on its own 😂 When it plunged intraday, everyone else was buying the dip; I just wanted to see who was swimming naked.
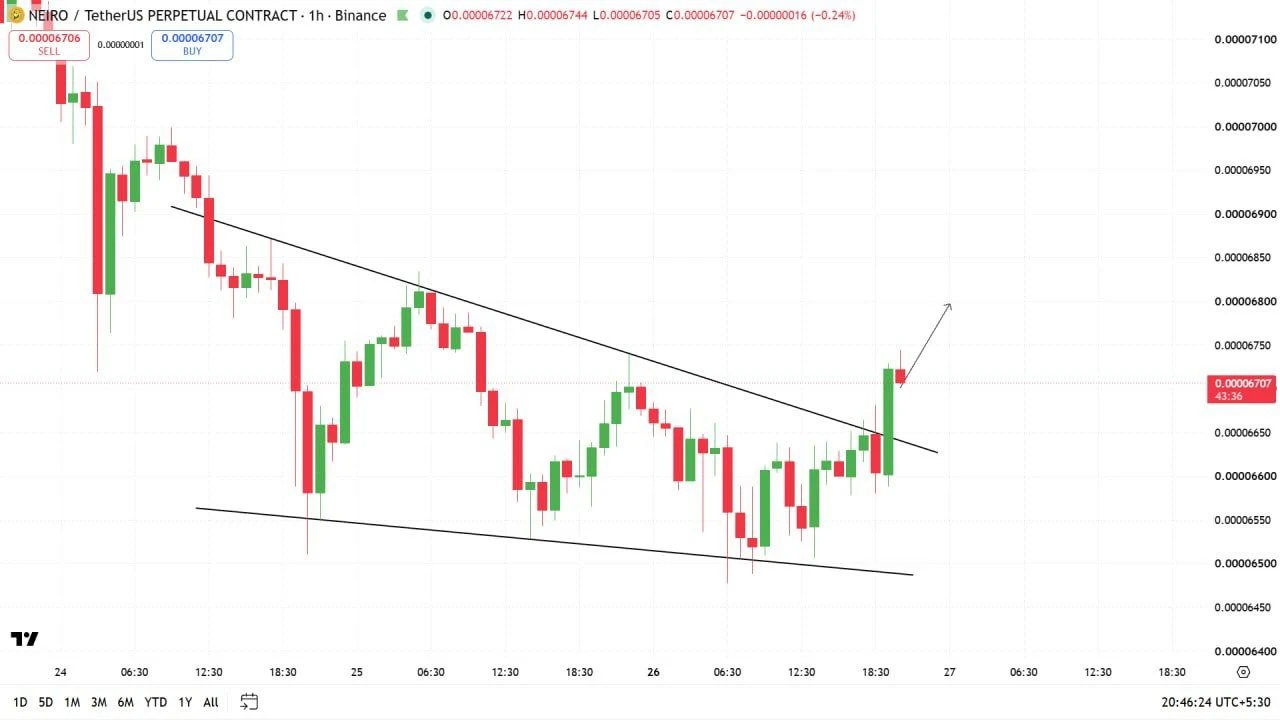
It repeatedly tried to break higher from the top but kept losing steam. Every push upward was just short of breaking through, with no buyers above—the baiting-long smell was too strong. I went short directly around 0.007226. As long as the key level holds, there’s no need to panic holding the short.
The price has now slid to 0.006451, with returns at +263%. It was genuinely sluggish at first,
post-image
ADA+0.27%
DOGE-1.06%
$SUI broke out a few days ago, but I didn’t chase it directly and waited for a pullback confirmation before entering. The core logic at the time was that after breaking above a key level on strong volume, it failed to quickly fall back below it. Once that level was confirmed, there was an air pocket above. I entered a long via a limit order, and the market moved smoothly after entry without any major pullback.

I took partial profits at the first target during the rally, with roughly 70% of the position locked in at around +214.75%. I moved the protection level for the remaining orders above
post-image
SUI-0.15%
ADA+0.27%
DOGE-1.06%
Everyone’s watching UNI’s 4H breakout, but the 95% confidence score is the quiet tell nobody sees yet.

$UNI /USDT - LONG

Trade Plan:
Entry: 7.114 – 7.192
SL: 6.778
TP1: 7.434
TP2: 7.621
TP3: 7.902

Why this setup?
- 1D trend is bullish, and price is holding above the 7.153 reference—this isn’t a random bounce.
- RSI 15m at 52.97 shows room to run before overheating, not exhaustion.
- ATR 1h at 0.156 gives clean volatility for a fast move toward TP1 7.434, then TP2 7.621.
- Why now? The setup is “Armed” with invalidation far below at 5.781—risk is defined, momentum is fresh.

Debate
UNI-0.10%
Load More

Join 40 M users in our growing community

⚡️ Join 40 M users in the crypto craze discussion

💬 Engage with your favorite top creators

👍 See what interests you

View More