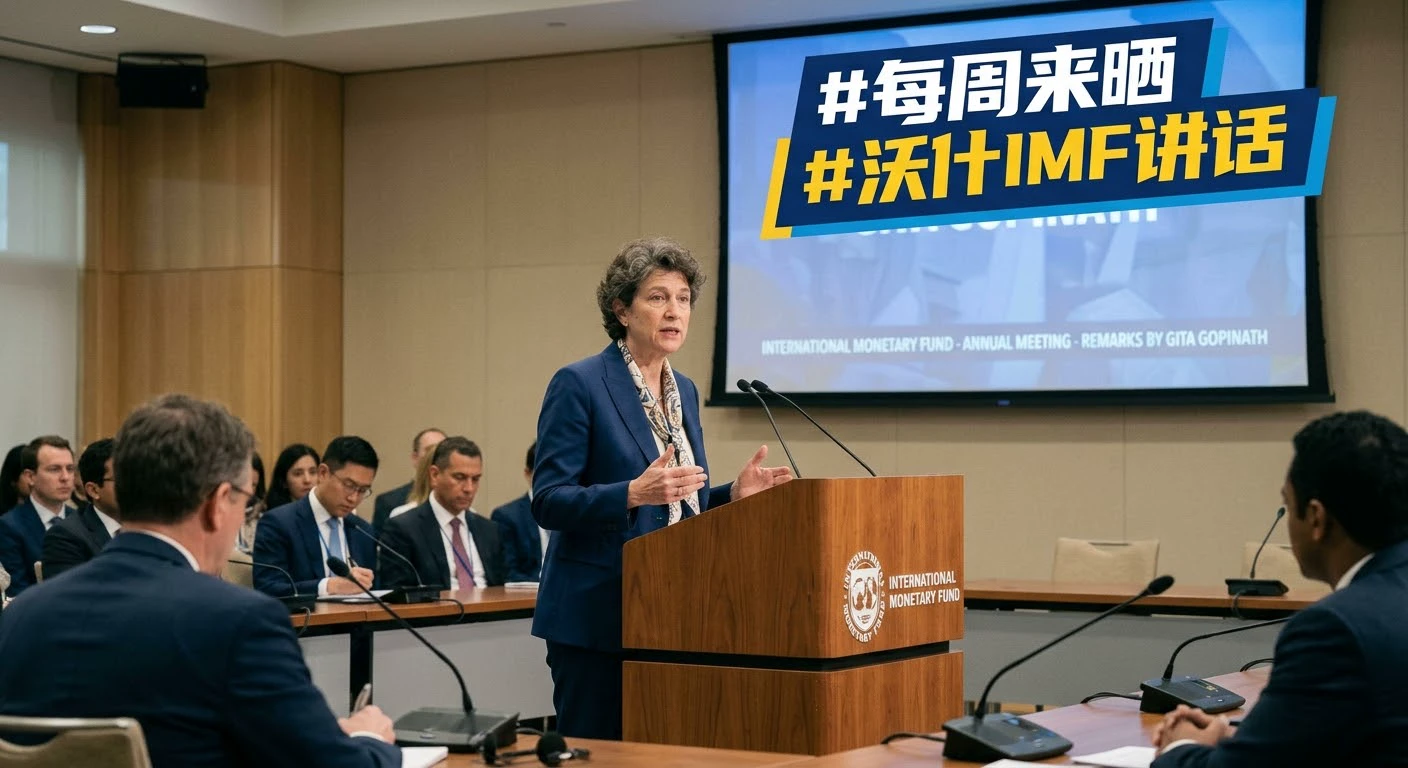
#ShareWeekly #WarshIMFSpeech Warsh at the IMF: why the Bangkok remarks matter for rate hikes and for BTC
Fed Chair Kevin Warsh joined IMF Managing Director Kristalina Georgieva for a fireside chat at the IMF-World Bank meetings in Bangkok, and the two questions in this topic are the right ones. Is the tone hawkish or dovish, and what does it mean for Bitcoin? Here are the answers, backed by the numbers that moved after he spoke.
Tone: neutral on the surface, hawkish underneath
Warsh did not choose a side. He reiterated the Fed's commitment to price stability while refusing to prejudge upcoming policy meetings. He also avoided forward guidance and pointed to a synchronous tightening by central banks worldwide, which frames inflation as a global problem, not only an American one. On growth, he described a surge in investment as the primary upside force in the global economy. That sounds constructive, but it also gives policymakers room to keep rates elevated if prices stay stubborn.
The context explains why silence was read as relief. September CPI rose 3.7% against 3.6% expected, and producer prices rose 1.3% on the month and 6.3% on the year, with energy up 10.8%. Core PPI jumped 0.7% against a 0.3% forecast. With data that hot, any hawkish hint could have hit markets hard. No hint came. One analysis summed it up this way: markets interpreted the absence of hawkish warnings as relief rather than an outright dovish turn.
Can the Fed hike again in October
Yes, but the market now rates it as unlikely. The implied probability of a hike in two weeks fell from around 27% to 15% after the remarks, according to the Financial Times. Rate futures showed a similar picture at 14.9%, down from 28%. The case for another hike has not disappeared, though. New York Fed President John Williams has said one more hike this year is appropriate, and the next policy meeting is October 27-28. The decisive inputs between now and then are the next inflation prints, energy prices and any shift in Fed speakers' language. Another hot reading would likely push odds back up quickly.
How the other markets reacted
The cross-asset response was consistent with softer hike fears:
- Dollar: the US Dollar Index hit a fresh 10-day low near 101.80. The euro rose and the Australian dollar moved toward 0.6950.
- Bonds: the 10-year Treasury yield held near 5.08%.
- US stocks: S&P 500 futures traded near 7,800 and Nasdaq 100 futures near 30,150.
- Korea: the KOSPI, which crashed 7.57% on Thursday, rose 2.05% to close at 5,668.05, its first higher close in eight sessions.
- Gold: it plunged toward $4,073 on bets of more hikes before recovering as yields and the dollar reversed.
What it means for BTC
The impact was a relief bounce, not a regime change. Bitcoin jumped more than 2% over 24 hours to trade near $82,300, and it is around $81,650 now. The reason is mechanical: a weaker dollar and calmer rate expectations ease pressure on risk assets. The contrast with August is useful. When Warsh delivered a clearly hawkish message at Jackson Hole, Bitcoin dropped below $77,000. This time the tone was neutral, and the market responded the other way.
Even so, the relief has limits. One analysis called the effect on Bitcoin mixed, with high rates possibly lingering. Bitcoin is also still recovering from this week's flush, when it dipped below $80,000 and liquidations approached $1 billion.
Key BTC levels:
- Support: the 50-day EMA at $80,443, then the 100-day EMA at $76,824 and the 200-day EMA at $75,751.
- Resistance: a daily close above $82,538 would strengthen the recovery toward $84,049 to $84,250.
- Risk line: a close below $80,443 would put $80,206 and the recent low near $79,694 back in play.
Scenarios into the Fed meeting
Rally case: inflation data cools or hike odds fall further, and BTC clears $82,538 toward $84,250. Range case: no new catalyst, and BTC trades between $80,400 and $83,000. Pullback case: hot data revives hike odds above 30%, the dollar firms and BTC retests $80,000.
My view:
Warsh did not give guidance, so the market is trading its own expectations. The balance of evidence favors a modest relief move, with the Fed meeting and the next inflation reports as the real tests. I would keep leverage low, respect $80,000 as the key level, and treat any rally as conditional on the data.