Square
Following
Hot
News
Notifications
Profile
Share your thoughts
placeholder
Article
Is this the K-line guru, the guy involved in the incident where a female KOL came over to suck his dick?
Seeing her like this reminds me of a saying: A man should know what to do—and what not to do...
This dude was really hungry
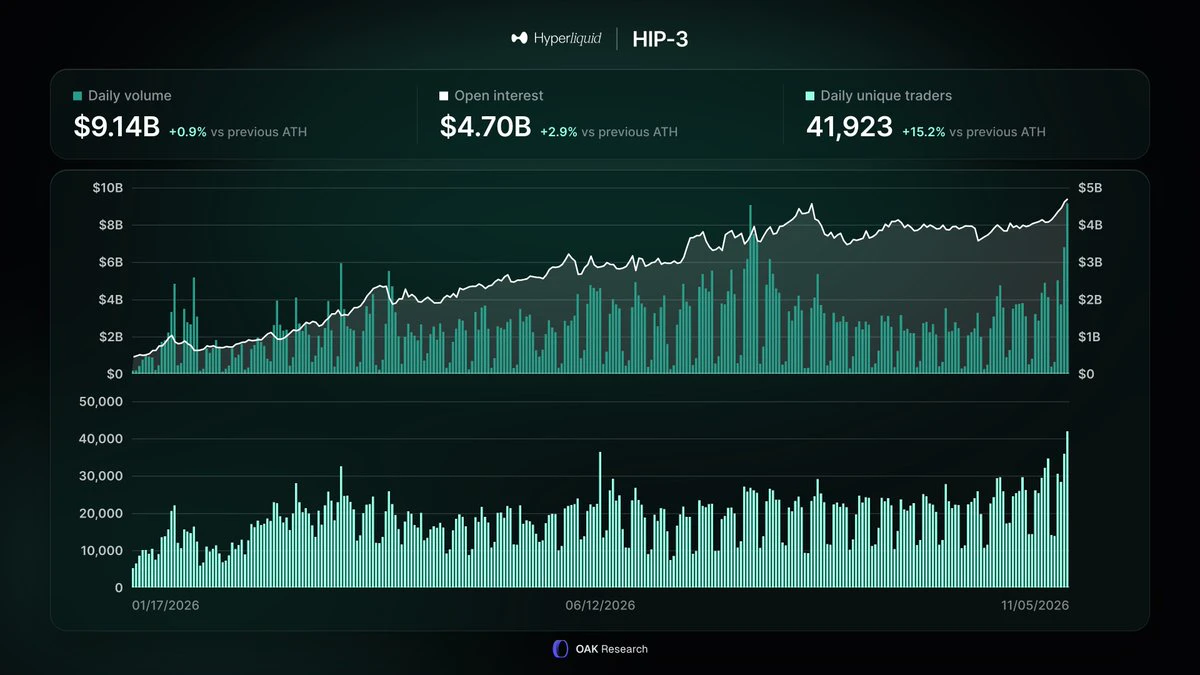
🟣 New all-time highs for volume, open interest and unique traders on HIP-3 yesterday.
You couldn't miss it. Yesterday, AI and semiconductor stocks crashed across Wall Street, dragging the major US indices down with them.
As is often the case, HIP-3 was a big winner, setting 3 new records:
◻️ $9.14B in volume (+0.9% over the previous ATH)
◻️ $4.70B in OI (+2.9%)
◻️ 41,923 unique traders (+15.2%)
Unsurprisingly, more than 98% of the volume went through @tradexyz. The platform's most-traded contracts were:
◻️ XYZ100 - $1.19B in volume - 13.2% of total volume
◻️ SP500 - $935M - 10.4%
◻️ SKHX - $8
post-image
SOXL-1.16%
SNDK-0.18%
Trenches
BTC
B
bade
b
BTC
C5xp...pump
Market Cap
$.
Change
.
24h Vol
$.
Holders
.
ZIG
Z
bade
b
ZIG
0x8c...1145
Market Cap
$.
Change
.
24h Vol
$.
Holders
.
GM
G
bade
b
GM
0x13...7777
Market Cap
$.
Change
.
24h Vol
$.
Holders
.
STONK
S
bade
b
STONK
6GmA...UNgx
Market Cap
$.
Change
.
24h Vol
$.
Holders
.
DESSA
D
bade
b
DESSA
npz2...pump
Market Cap
$.
Change
.
24h Vol
$.
Holders
.
The bold ones have already pocketed tens of thousands of dollars $GM
GM-3.34%
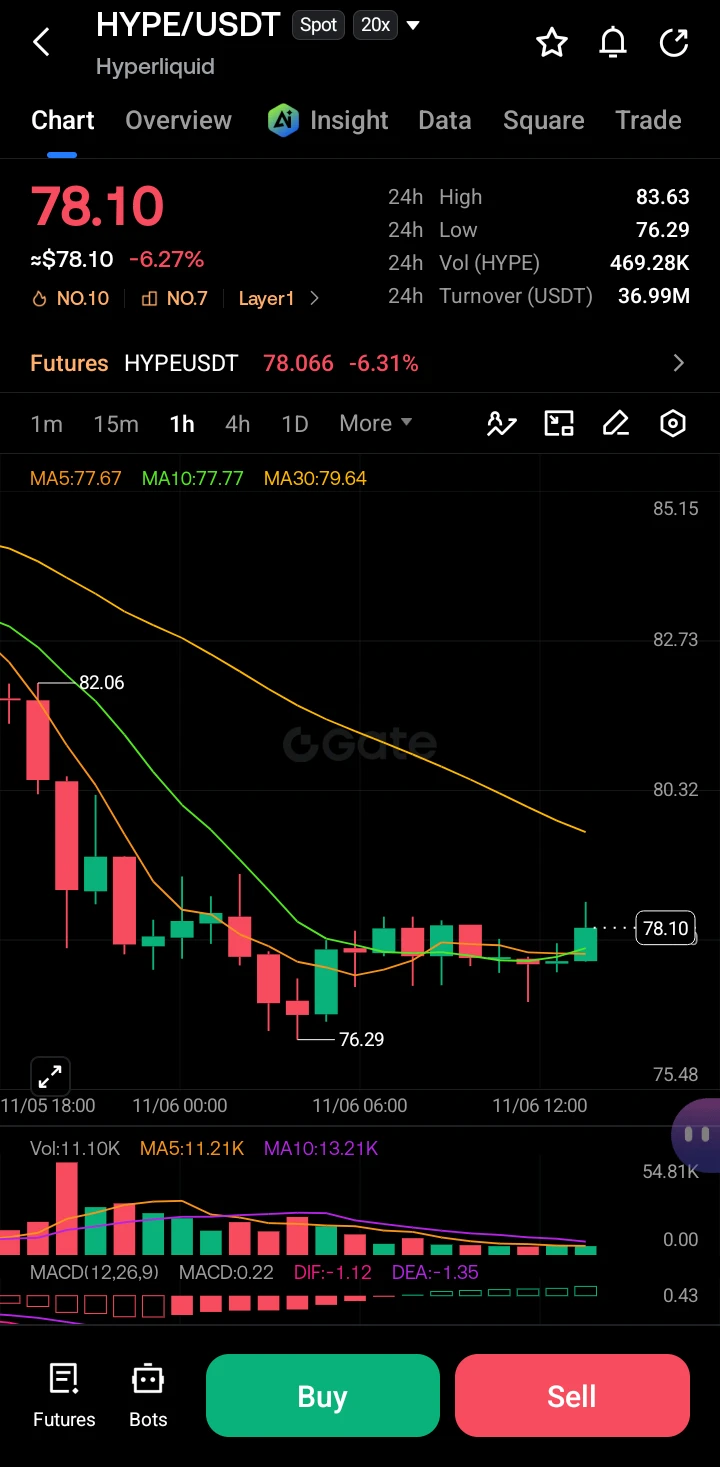
$HYPE ‌
HYPE is currently experiencing a short-term corrective downtrend, trading at $78.10 (-6.27%) after a sharp drop from the $82+ region. The price has found temporary support near $76.29 and is attempting to stabilize, but broader momentum remains bearish.

Key Levels

· Resistance: $79.64 (MA30) and $80.32 (previous breakdown zone).
· Support: $76.29 (local low) and $75.48 (lower structural support).

The 1H chart shows a massive initial sell-off, followed by a period of consolidation. Candles are currently printing smaller bodies with wicks on both sides, indicating indecision. The MAC
post-image
HYPE+0.24%
  • 6
  • 1
U.S. Stocks Plunge After the Midterm Elections, Led by AI Stocks, Dragging BTC Down Too! When Will T
live-cover
LIVE1,381
The long position from the livestream is taking off; I took profit and got out.
Account: +800u, currently 5800u
  • 4
🎁 Get rewarded for talking stocks, with an extra bonus for your first post
Gate Square’s stock discussion season is underway
Complete event registration to receive a 10 USDT stock contract position trial coupon.
👉 Sign up now: https://www.gate.com/campaigns/6898

If you haven’t posted on Gate Square before, publish your first eligible original stock-related post during the event:
🆕 The first 1,000 eligible new Square creators
Each will receive an additional 5 USDT in stock trading trial funds

Start with a stock you follow and share your views, reasoning, or trade recap. All are welcome.
In
post-image
  • 10
  • 4
I didn’t get carried away; there was strong resistance at 75, and with profits as a cushion, I held on a little longer, only to get liquidity-swept at 80 again
post-image
  • 2
When I make a profit, I eat noodles to remind myself not to get carried away;
when I take a loss, I eat meat to tell myself not to be afraid.
post-image
Gm ☕️
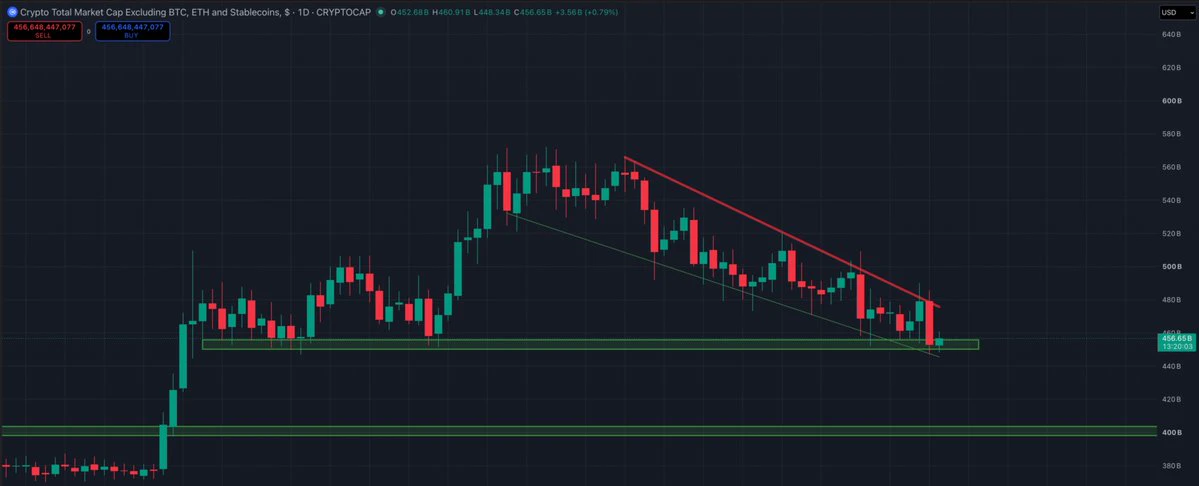
bullposted for a whole day, then watched the entire move get retraced the next day while stocks had one of their worst days in history.
still, crypto doesn't look structurally weak. ugly candle, sure, but the uptrend structure is clean everywhere, and that's where most of my bullish bias comes from.
look at #TOTAL3ES (1D)
a hold here and a bounce look likely to me
but i'm curious how the stock market behaves into the weekend
post-image
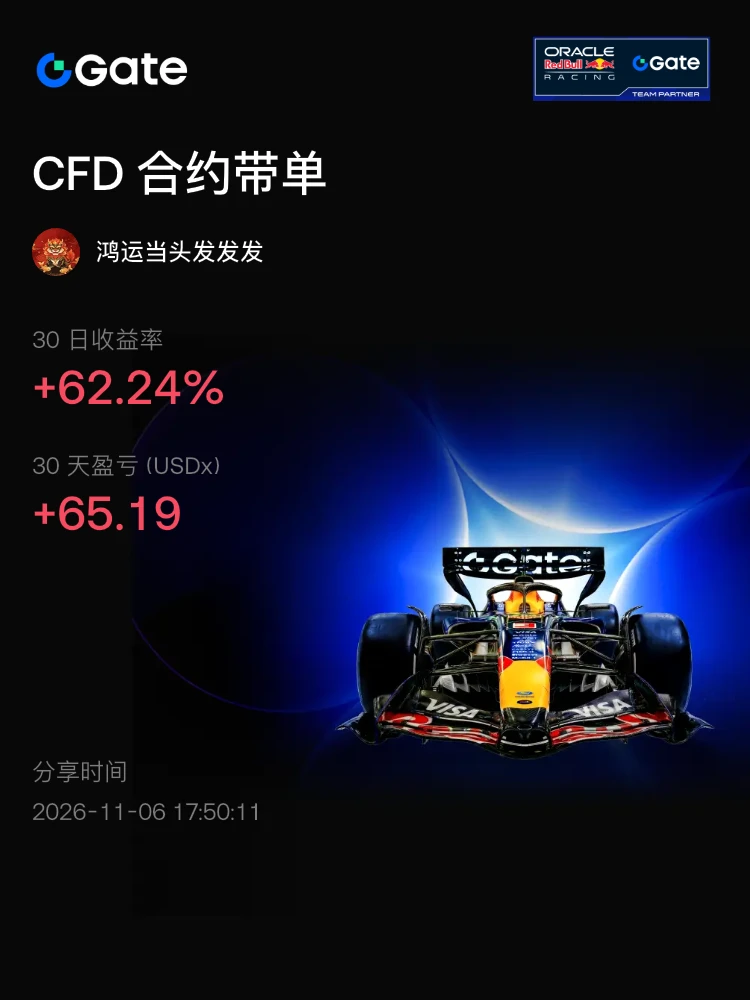
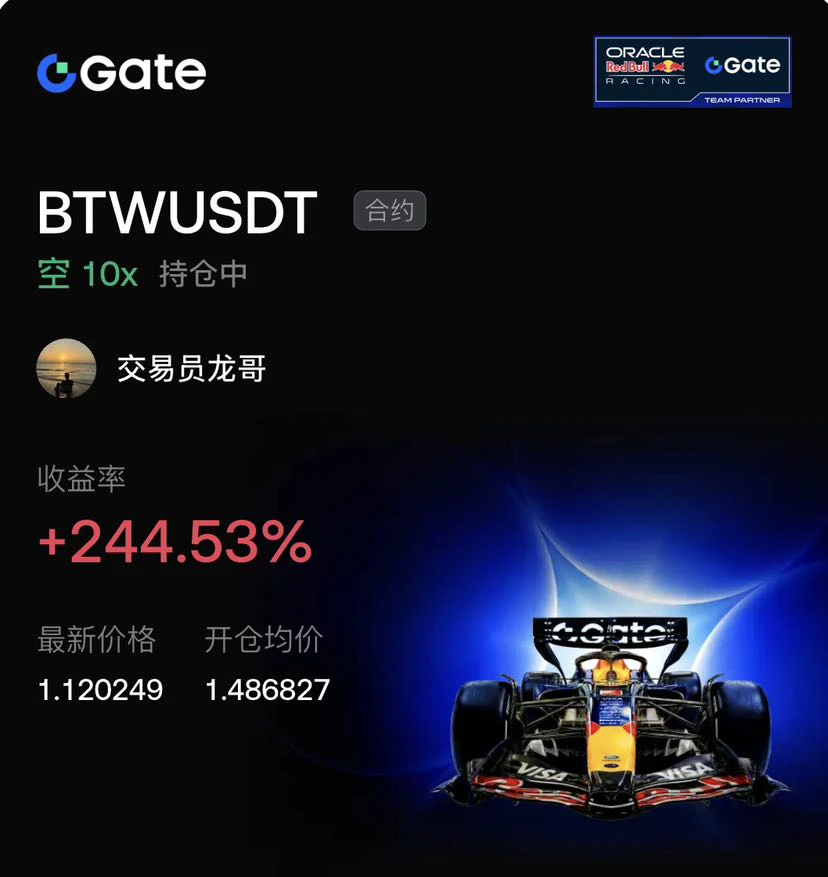
10x leveraged short on $BTW , raking in 244.53%! 💰Gate position screenshot revealed: latest price 1.120249, perfectly called the top at 1.486827! Backed by a Red Bull Racing backdrop, this trade was executed at full speed.

Behind the 10x return lies a knife-edge gamble; an adverse move would wipe out everything. Sharing the screenshot is not just bragging, but also a sign of respect for the market. Bearish sentiment is strong in the current market, but extreme conditions often brew extreme reversals.

Outlook: Bearish sentiment is strong, and prices may continue to fall in the short term, bu
post-image
BTW-7.75%
BTC-0.65%
ETH-1.23%
Why Can Mismanagement Occur Even With a Multisig Wallet?

In the Web3 world, multisig wallets are often seen as an important tool for improving the security of digital assets.

The basic idea is simple: a transaction no longer relies on just one person's signature. It can only be executed once a preset threshold of signatures has been met.

For example, a 3/5 multisig wallet requires at least three of its five signers to jointly approve a transaction.

This means that even if one signer's key is compromised, an attacker usually cannot complete a transaction with that key alone.

But this raise
post-image
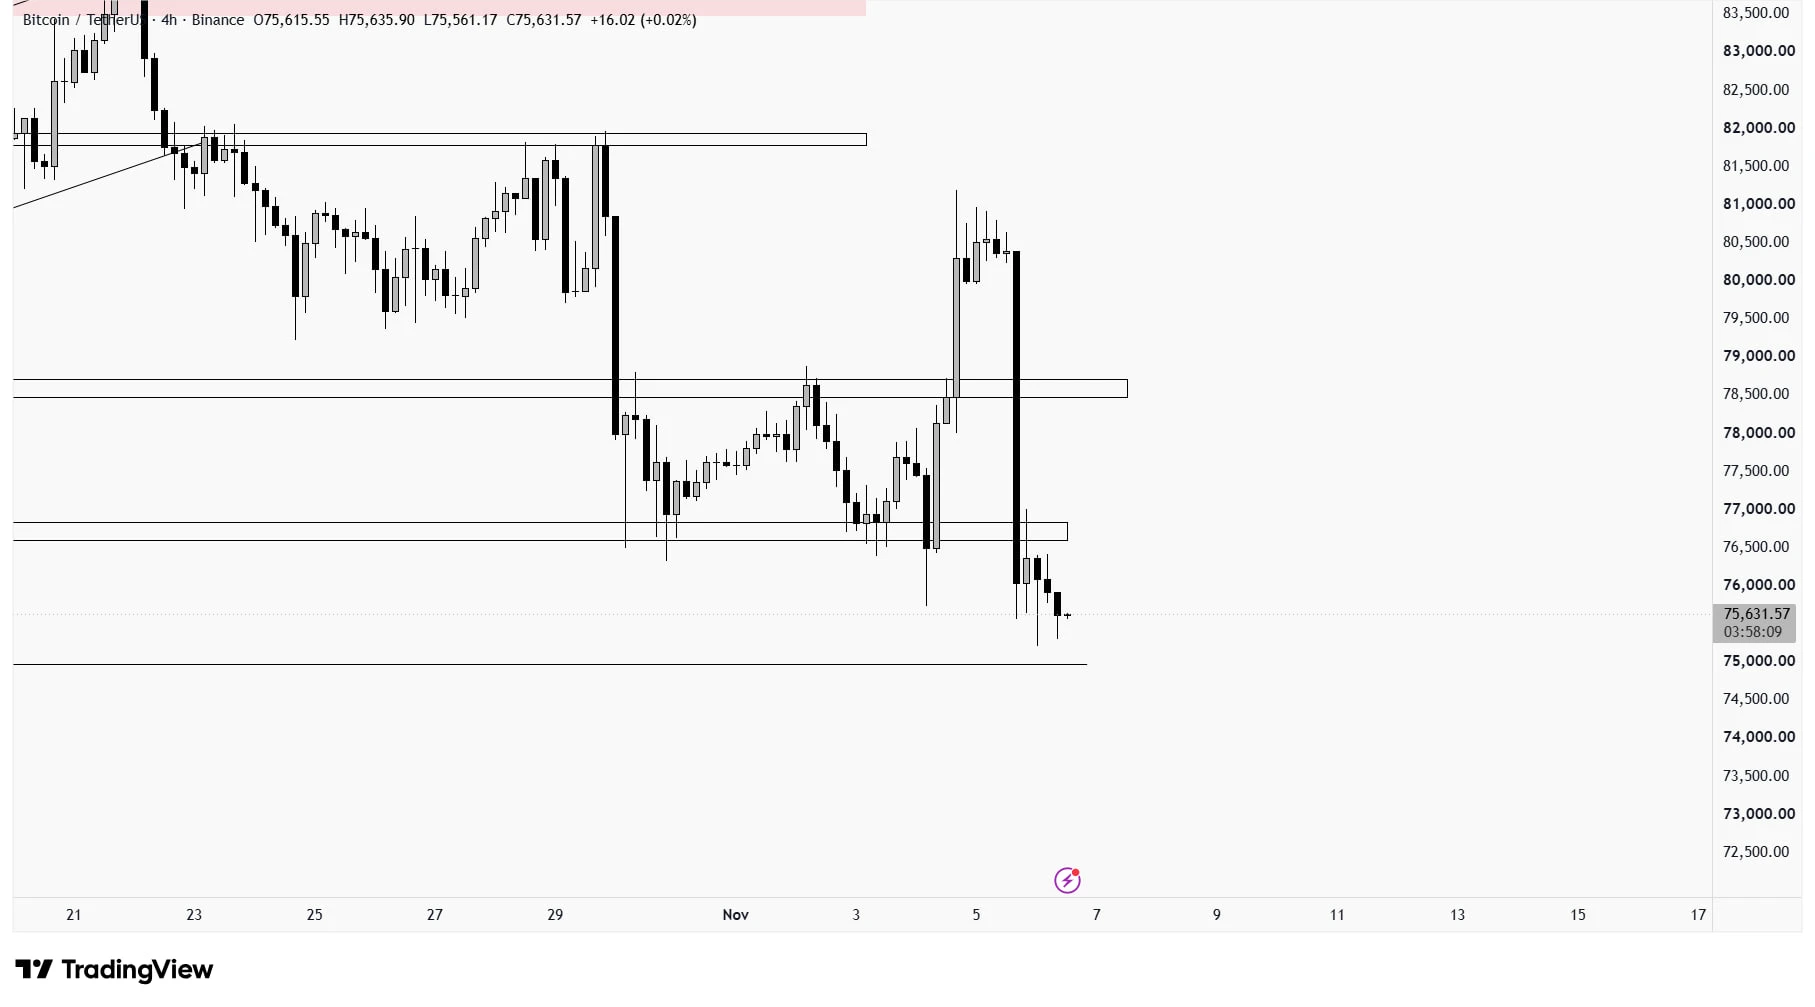
$BTC is under heavy pressure after breaking below its key support zone.

Price has already retested the broken level and is now moving toward the previous low, where liquidity could be waiting.

I'm watching for a possible liquidity sweep followed by a strong reversal. If buyers step in and reclaim support, BTC could make a sharp recovery.

One liquidity grab could change the entire market structure. Eyes on BTC
post-image
BTC-0.67%
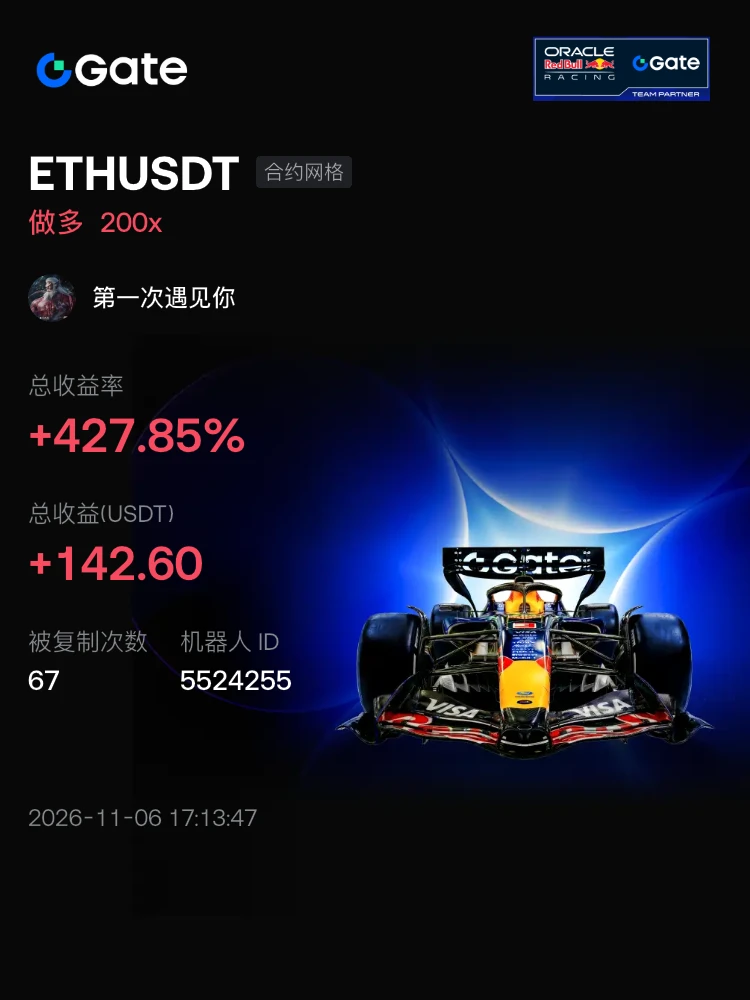
#交易机器人 I'm using the ETHUSDT contract grid bot on Gate; join me and copy my trades
post-image
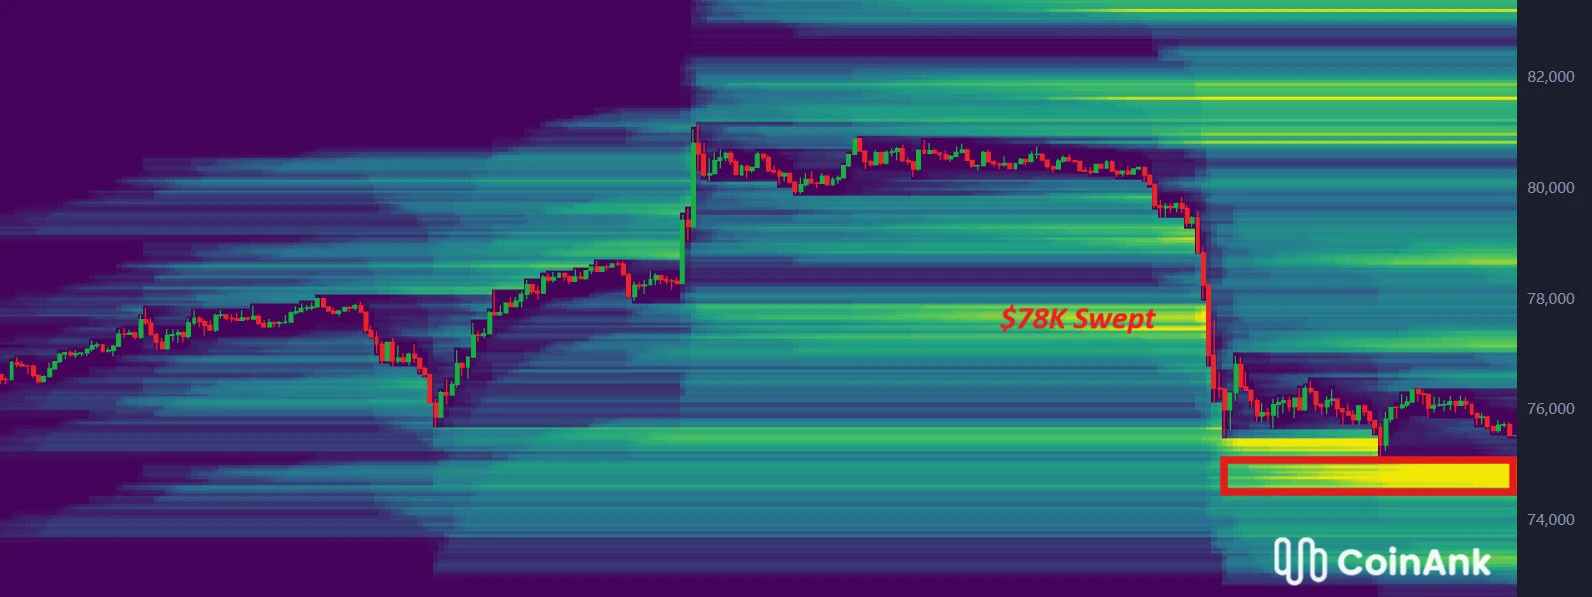
$BTC Yesterday, I pointed out that a sweep of $78K was very likely.

Despite some disagreement in the comments, that's exactly what we got.

Interestingly, even after yesterday's selloff, the largest remaining liquidation cluster is still sitting below price.

This suggests that leveraged longs continue to build up aggressively, leaving significant liquidity to the downside.

With that in mind, I think a continuation lower toward $75K is becoming increasingly likely.
post-image
BTC-0.67%
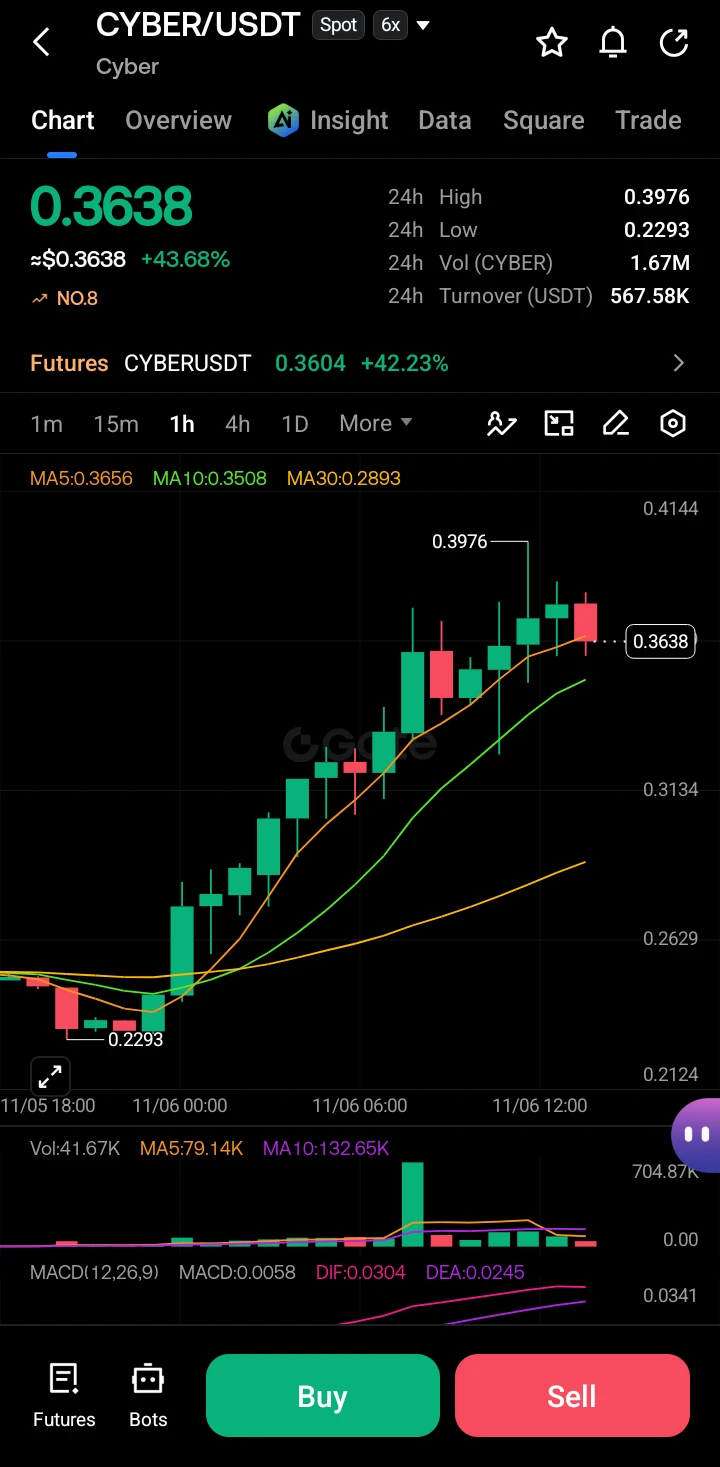
$CYBER ‌
CYBER is experiencing a massive bullish breakout, surging over 43% in 24 hours to trade near $0.3638. The market is highly volatile with strong upward momentum, heavily outperforming the broader market.

Key Levels

· Resistance (24h High): $0.3976
· Immediate Support: $0.3508 (MA10) and $0.3656 (MA5)
· Strong Structural Support: $0.2893 (MA30)

The 1-hour chart shows a parabolic upward trend characterized by consecutive strong green candles. However, the most recent candle is red with a long upper wick, indicating profit-taking and selling pressure near the $0.39 peak. Volume spiked
post-image
CYBER-5.40%
  • 6
  • 2
That’s so impressive—why even bother going to school?
post-image
[New streamer] Crypto Market Trends
live-cover
LIVE1,766
Load More

Join 40 M users in our growing community

⚡️ Join 40 M users in the crypto craze discussion

💬 Engage with your favorite top creators

👍 See what interests you

Trending Topics

USStocksFaceHistoricSelloff

6k Views3.66k Discussing

U.S. stocks suffered a sharp selloff on Thursday, with the Nasdaq closing down more than 5% and the Philadelphia Semiconductor Index falling over 12%. AI and chip stocks including $NVDA and $AMD were hit especially hard. Markets are reassessing AI valuations, data-center spending and future returns. Is this just short-term deleveraging, or the start of a deeper correction in the AI trade? Which sectors are you watching next?

GateLaunchesPoSECProofOfSecurity

15.6k Views594 Discussing

USNonfarmPayrolls

13.73k Views4.06k Discussing

View More