Square
Following
Hot
News
Notifications
Profile
Share your thoughts
placeholder
Article
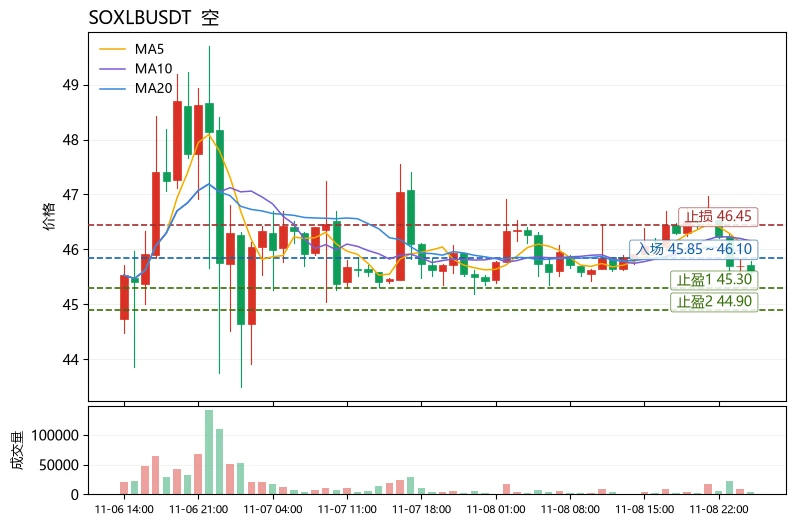
$SOXLB$SOXLB is currently at 45.59, with key support at 45.30 (Bollinger lower band) and first resistance at 45.95 (where MA5 and MA20 converge). Price is hugging the lower band, MA5 has crossed below MA20, RSI at 42.5 is weak but not oversold, and the MACD histogram at -0.0313 shows bearish momentum continuing. The range over 30 candles is about 3.9%, with volatility at a neutral-to-low level—under this setup, the biggest mistake is trying to catch a rebound because “it hasn’t fallen much yet.” A slow decline amid low volatility often trades time for price movement, and stop-losses can easily
post-image
WLD-5.61%
NEAR+1.17%
The crowd is waiting again, while corporations are buying Bitcoin by the billions #bitcoin #trading #crypto #indicators
BTC-0.67%
Trenches
ZIG
Z
bade
b
ZIG
0x8c...1145
Market Cap
$.
Change
.
24h Vol
$.
Holders
.
STONK
S
bade
b
STONK
6GmA...UNgx
Market Cap
$.
Change
.
24h Vol
$.
Holders
.
BTC
B
bade
b
BTC
C5xp...pump
Market Cap
$.
Change
.
24h Vol
$.
Holders
.
CLAUDIA
C
bade
b
CLAUDIA
2j5S...W2ZM
Market Cap
$
Change
.
24h Vol
$.
Holders
.
MAGGIE
M
bade
b
MAGGIE
8rHo...PmZV
Market Cap
$.
Change
.
24h Vol
$.
Holders
.
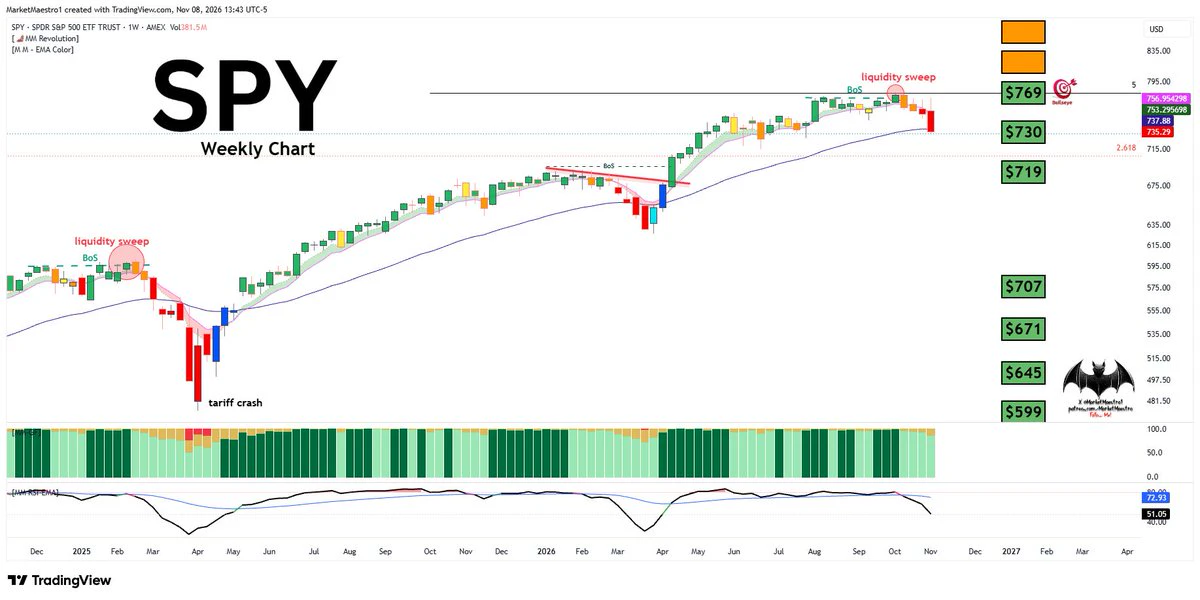
$SPY
A sharp correction began after the liquidity sweep. The last time we saw a pattern like this was during the tariff crash. A move below $740 means the correction has started. Below $736, selling pressure will continue
post-image
SPY+0.06%
The most easily overlooked cost in crypto: attention.

BTC and ETH prices are moving, and your attention is being fragmented too:
checking prices, reading group chats, chasing trends, then refreshing once more.

After a busy day, it feels like you’ve seen everything, yet you can’t say which logic you actually believe in.

More information doesn’t necessarily mean you see things more clearly. Sometimes it just means your emotions shift faster.

When you spend the longest time watching the market, is the market clearest—or are you feeling the least sure?

‍#BTC #ETH
post-image
BTC-0.67%
ETH-1.26%
$ETH Weekly still working on that right shoulder, as well. Going to have to be open-minded to more downside possibly, but we still have the track line underneath us at ~$2,085. And I know it doesn't look like it, but the Daily has a wonky H&S still playing out. Just waiting for that downtrend to end.
ETH-1.26%
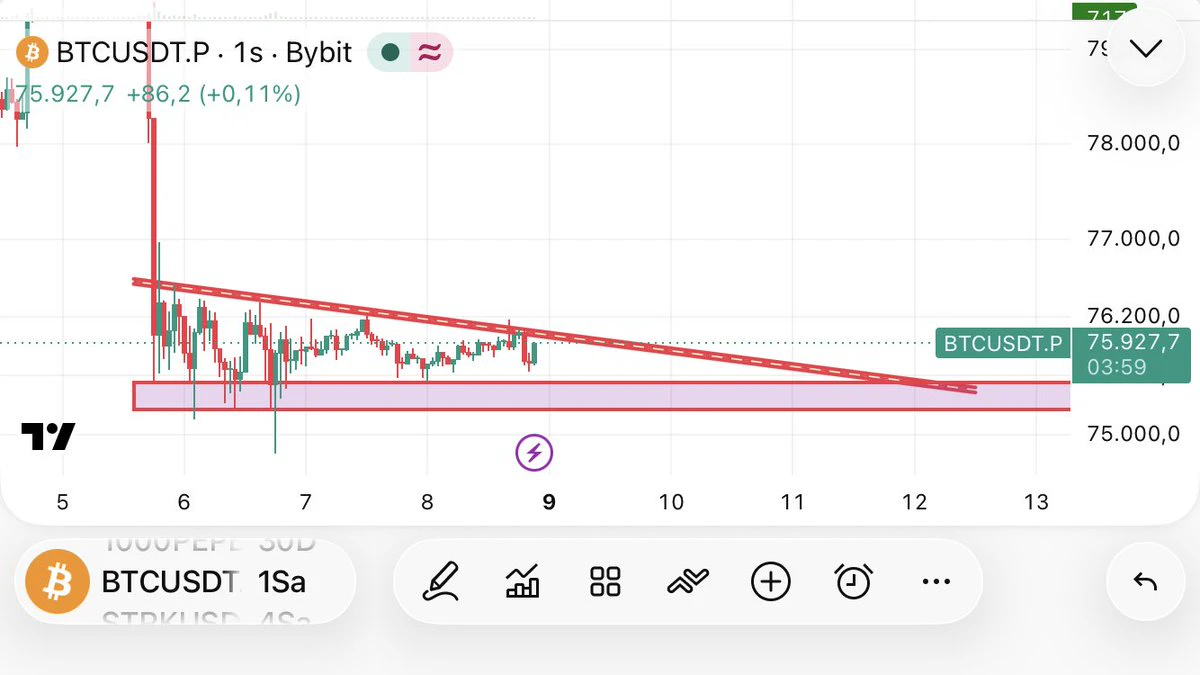
#Btc If the lower range holds, why not an inverted Bart? 🤔
#Bitcoin #eth #Ethereum #Crypto #cryptocurrency
post-image
BTC-0.67%
ALT-1.40%
ETH-1.26%
#Share My Holding Returns
another way up to the moon 🌝 if the market is going to respect the structure so we are good and catch the exact point and let's eep pushing it towards upside first to take the liquidity instead of downside. ♥️🎇🎆
#StockTalkSeason
post-image
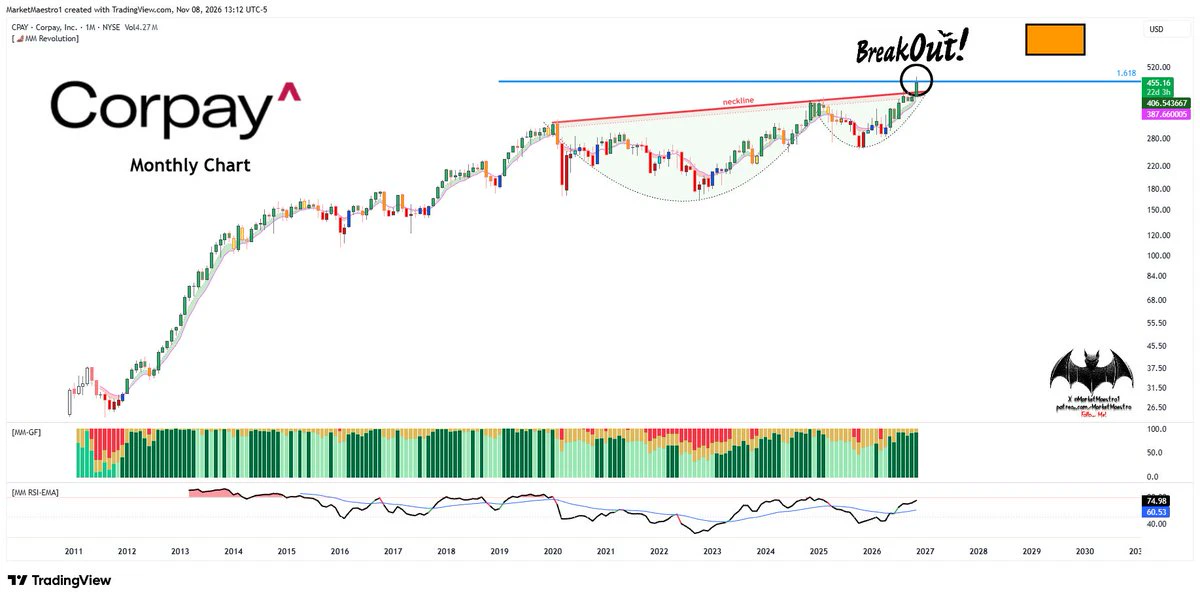
$CPAY
We haven’t seen bullish setups like this in a long time. It reached a key resistance level but broke out 💥 of its cup+handle pattern
post-image
CPAY+1.98%
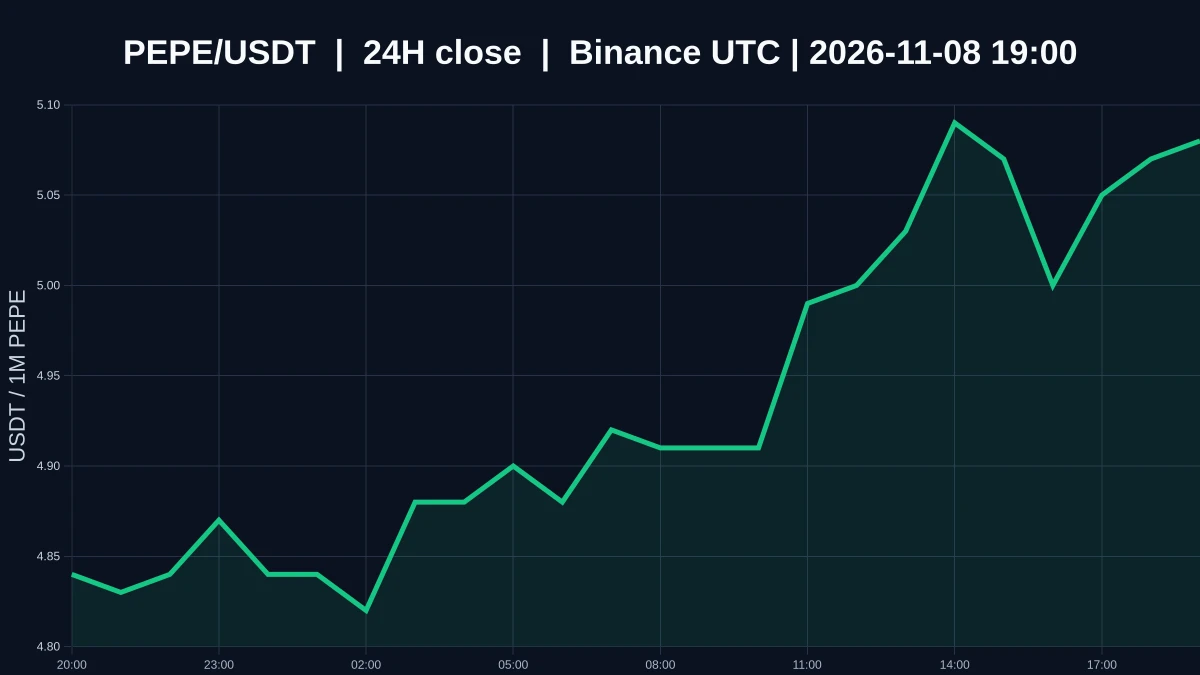
$PEPE ’s price has already moved. Why hasn’t trading volume followed?

$PEPE is currently priced at 0.00000508, up 3.885% over 24 hours, with an intraday high of 0.00000513 and a low of 0.00000478. The 1-hour and 4-hour trends are both relatively strong, but the volume ratio is only 0.030028783815234078. The direction looks clear, but volume hasn’t weighed in, which makes this move less convincing.

On the 1-hour chart, support is at 0.00000478 and resistance is at 0.00000513. At 0.00000508, the current price is about 0.00000030 above support and about 0.00000005 below resistance, putting it ve
post-image
PEPE+0.97%
🚨 ARGENTINA BRINGS REAL-WORLD ELECTRICITY TO THE XRP LEDGER!
⚡ $JMWH = 1 MWh OF REAL ELECTRICITY, BACKED BY ENERGY CONTRACTS YPF Luz × Justoken
✅ REAL ENERGY | REAL‑WORLD ASSETS | POWERED BY XRPL
⚠️ Note: JMWH is a separate token (NOT XRP), a corporate closed-loop system, check official project updates!
#XRPL #RWA #JMWH #XRP
post-image
XRP-1.15%
YPF-0.09%
RWA-0.39%
Crypto Trade Now
live-cover
LIVE684
The U.S. Consumer Price Index (CPI) data for October will be released on Tuesday—with economists expecting annual inflation to rise from 3.7% to approximately 3.9%—followed by the Producer Price Index (PPI) data on Friday. The Federal Reserve’s next interest rate decision is scheduled for December 9, and the market is currently pricing in a high probability of a quarter-percentage-point hike. It is also worth noting that the commentary provided by Fed officials following these data releases will be closely monitored.

Why will these two key events drive the market?

The calendar for the coming
BTC-0.67%
ETH-1.26%
NVDA+2.80%
SPCX+8.74%
NAS100+1.90%
  • 10
  • 4
I told you, this is what seizing opportunities is called 💀🔥$JCT $JCT The market is getting crushed right now; I have it on stream 😎🔥
post-image
JCT-3.26%
As we move into November, there is one big fly still stuck in the ointment. Yes, we have very high EPS growth for the S&P 500, but two companies comprise one-third of that ~30% growth: $NVDA (NVDA) and $MU (MU).
NVDA+2.80%
MU+4.71%
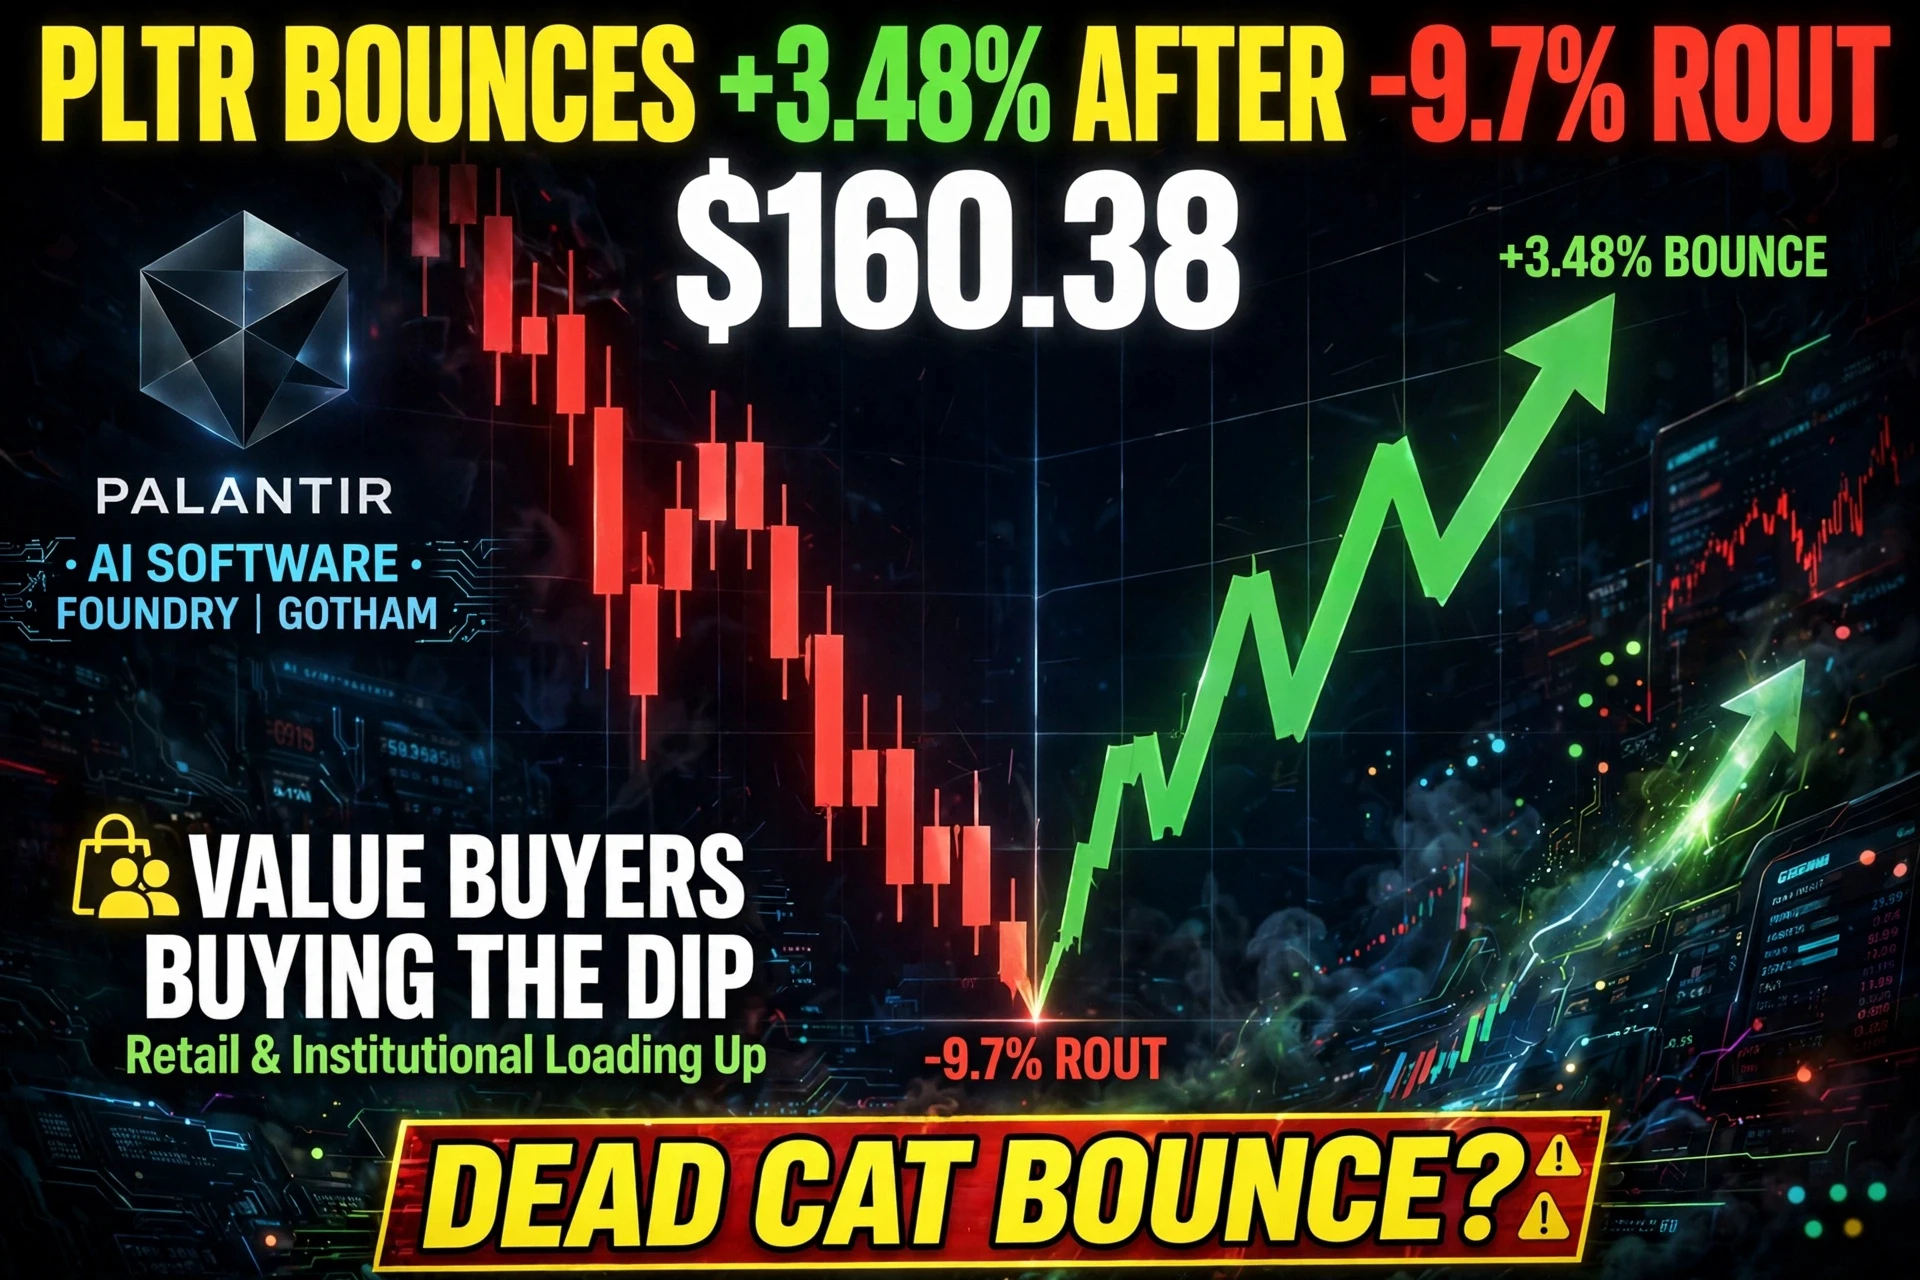
Palantir (PLTR): A Much-Needed Bounce After a Sharp Rout
Palantir bounced to $160.38 on Friday, rising 3.48% after suffering a 9.7% rout on Thursday. The ticker shows PLTR up 3.57%.
Palantir is often viewed as a bellwether for AI software and government contracting. The 9.7% drop on Thursday indicates a severe and sudden negative catalyst—likely disappointing earnings, a downgrade, or a broad sector sell-off that hit high-multiple tech stocks particularly hard. A 3.48% bounce the following day is a natural market reaction as value buyers step in to "buy the dip."

The critical question for in
post-image
PLTR+3.57%
  • 6
  • 1
Prediction markets assign a 52 probability that Bitcoin will rise to $70,000 by the end of 2026
live-cover
LIVE82
Reversal scenario .. $BTC
A close above $98,192 means the entire decline is over and an uptrend begins ✍️
post-image
BTC-0.67%
  • 1
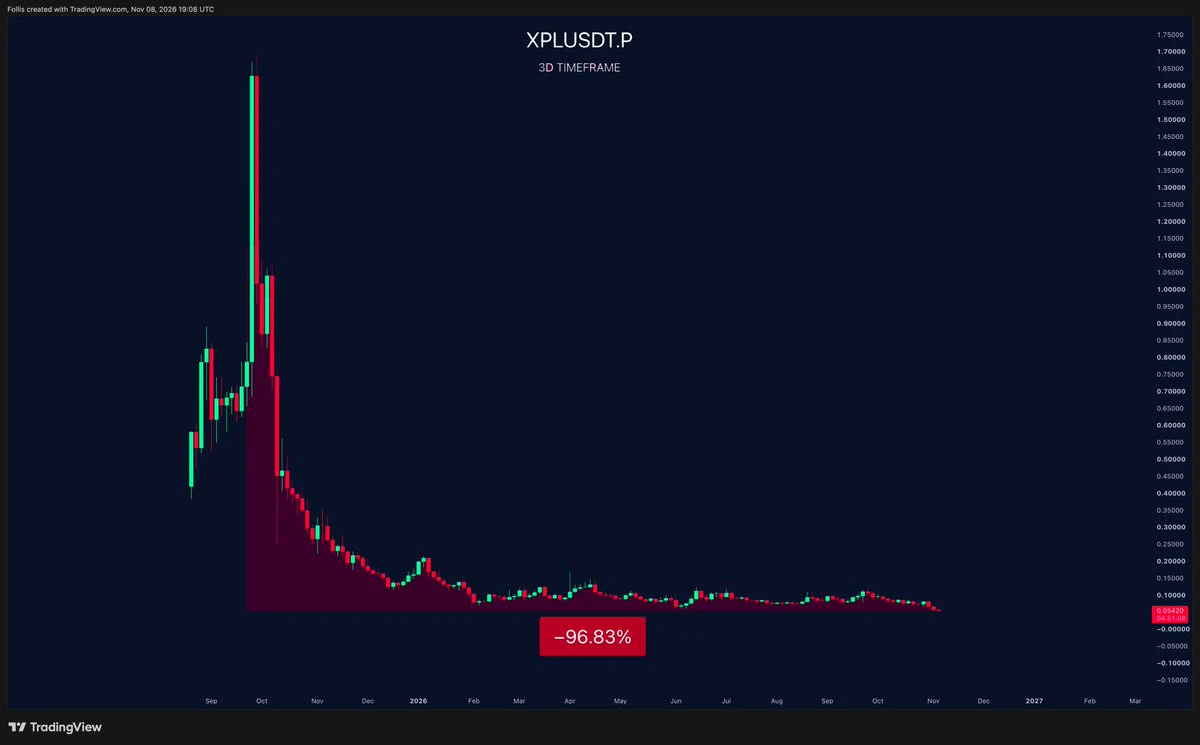
Happy new $XPL ATL to those who celebrate
post-image
XPL-0.60%
Load More

Join 40 M users in our growing community

⚡️ Join 40 M users in the crypto craze discussion

💬 Engage with your favorite top creators

👍 See what interests you

Trending Topics

USCPIDataIncoming

14.34k Views1.66k Discussing

The U.S. October CPI report will be released on November 10 at 8:30 a.m. ET. September CPI came in at 3.7% year over year, and markets will be watching closely for signs that inflation is cooling, especially in core CPI. A softer-than-expected reading could strengthen rate-cut expectations, while hotter inflation may pressure risk assets through higher Treasury yields and a stronger dollar. How do you think this CPI print will move $BTC, U.S. stocks and gold?

USAIStocksHitHard

28.78k Views3.74k Discussing

USNonfarmPayrolls

55.32k Views4.5k Discussing
View More