Square
Following
Hot
News
Notifications
Profile
Share your thoughts
placeholder
Article
The U.S. October CPI hasn’t been released yet tonight, and the probability of a Fed rate hike in December has surged to 90%—this rate hike is basically a done deal!
This is definitely a real bearish catalyst for U.S. stocks and Bitcoin, which will likely come under pressure in the short term.
I just hope this is the final rate hike of this cycle. Please! 🙏
BTC-0.67%
Mige conducts a strategic analysis of cryptocurrency based on the current eight major macroeconomic dimensions:
1. Rising expectations of Fed rate hikes are hawkish.
2. The US dollar is relatively strong.
3. Global liquidity is neutral to tight.
4. The Democrats taking office adds regulatory headwinds for crypto.
5. Risk appetite in US stocks is wavering.
6. Risks of localized conflict in the Middle East and of a Russia-Ukraine-NATO war are increasing.
7. AI and technology stocks are bearish for US equities.
8. Internally, crypto ETF funds continue to flow out, including from institutions such
post-image
BTC-0.67%
Trenches
PIEVERSE
P
bade
b
PIEVERSE
0x0e...25a9
Market Cap
$.
Change
.
24h Vol
$.
Holders
.
牛逼
牛
bade
b
牛逼
0x96...7777
Market Cap
$.
Change
.
24h Vol
$.
Holders
.
ON
O
bade
b
ON
0x0e...1d48
Market Cap
$.
Change
.
24h Vol
$.
Holders
.
STONK
S
bade
b
STONK
6GmA...UNgx
Market Cap
$.
Change
.
24h Vol
$.
Holders
.
FLOAT
F
bade
b
FLOAT
Bv1a...BMmr
Market Cap
$.
Change
.
24h Vol
$.
Holders
.
✨️💫 HYPE: the next reaction matters

🚨 The plotted path needs confirmation before it becomes convincing.

#HYPE has a conditional route lower on the 1H chart. Watch whether sellers can hold the rebound below resistance and break the nearest support.

Structure

• Patterns frame the visible price structure.
• Last closed price: 74.49.
• The curve illustrates a possible path with a pullback.

KEY LEVELS

Marked target: 66.6753
Resistance: 75.2032
Support: N/A

Reassess after a recovery above resistance followed by a retest that holds.

#ShareWeekly
#GateGlobalComplianceExpansion
$HYPE ‌
post-image
HYPE+0.33%
🏆 Gate hits the global Top 3 — giveaway time! 🎁
Per DeFiLlama (Nov 9), Gate ranked 3rd globally among CEXs, with $40.66M in 24-hour net inflows.
Let's celebrate 💙
🎁 3 winners × 5 USDT
Join in 👇
✅ Follow @Gate_Livezh & @Gate__Live
❤️ Like + Repost
💬 What's a recent win you're proud of? Share it below! 🏆
📊 Source:
https://www.odaily.news/zh-CN/newsflash/532275
‍#GateLive #Gate
post-image
  • 42
  • 23
[New Streamer] Market Prediction
live-cover
LIVE2,022
What Is Volume Analysis? Why Is It Worth Watching Volume Changes When Prices Rise?

In cryptocurrency trading, price tells us which direction the market is moving, while volume can help us gauge the level of market participation. When BTC rises, an increase in volume alongside the price may mean more traders are participating in the rally. If the price continues to rise while volume gradually declines, it is worth looking more closely at whether upward momentum is weakening.

First, what is volume analysis?

Volume analysis is a method of assessing market activity and the characteristics of pr
post-image
BTC-0.67%
🔹Goldman Sachs CEO Remains Bullish on Computing Infrastructure! Data Center Demand Continues to Sur
live-cover
LIVE2,042
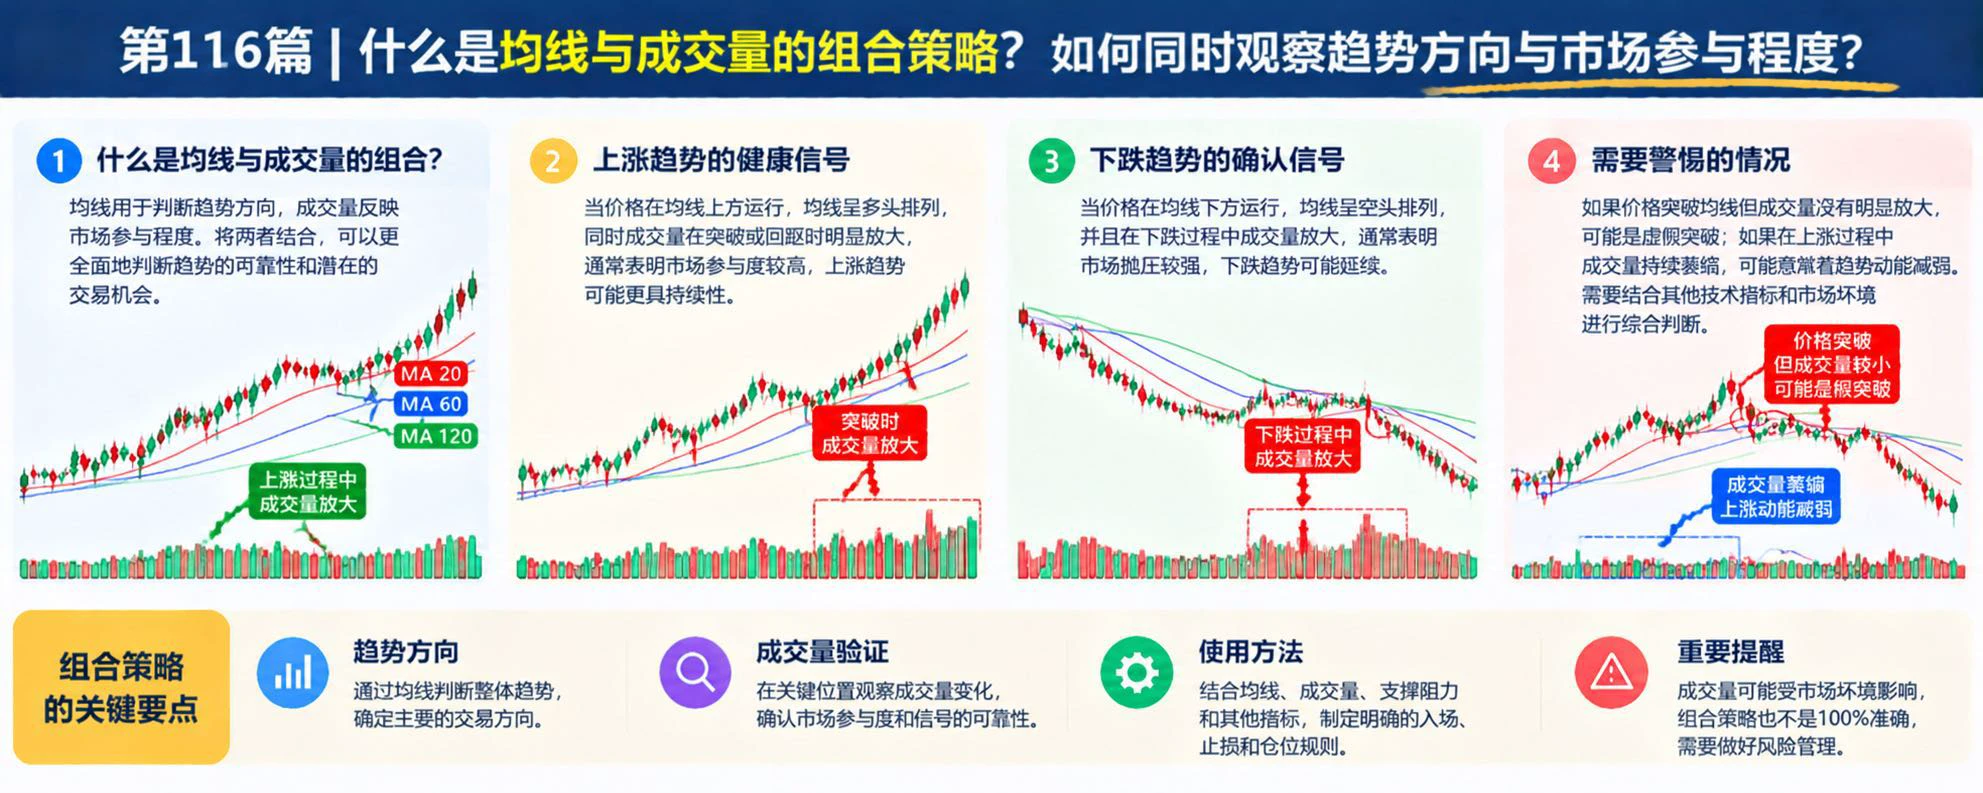
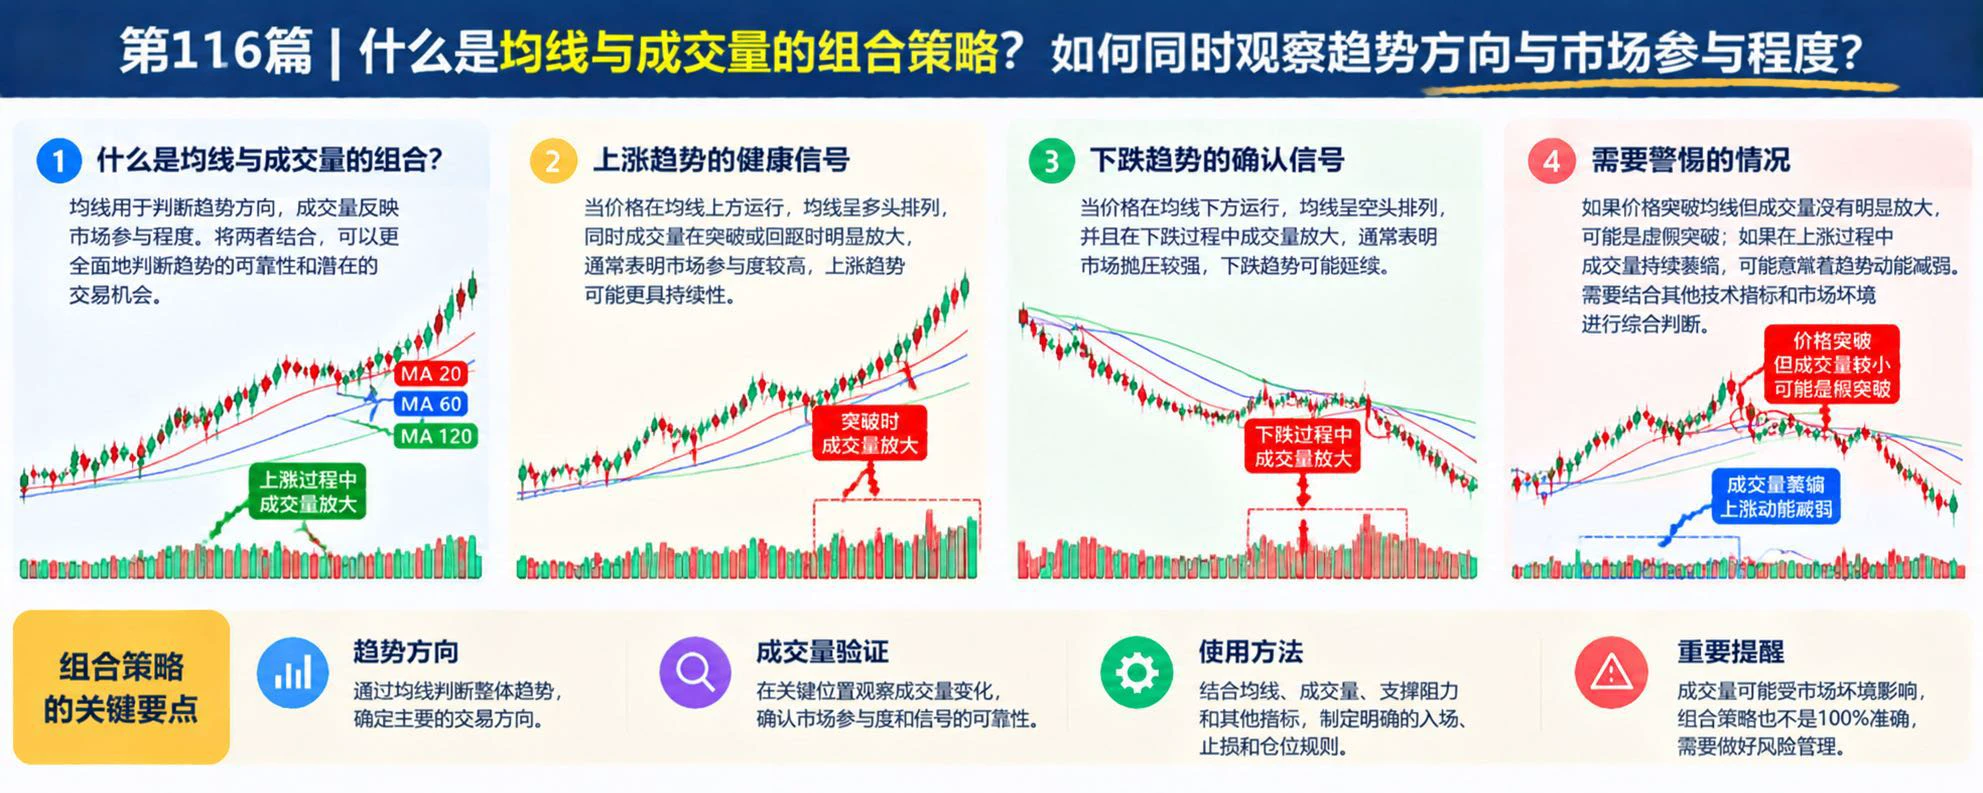
What Is a Moving Average and Volume Combination Strategy? How Can You Observe Trend Direction and Market Participation at the Same Time?

In cryptocurrency trading, a price increase does not necessarily mean the trend is strong, and upward-sloping moving averages do not mean the market cannot reverse. Moving averages (MAs) help identify trend direction, while volume reflects market trading activity. Combining the two allows for a more comprehensive assessment of the credibility of breakouts and trend continuation.

First, what do moving averages and volume each show?

Moving averages smooth hi
post-image
Are you here to make a joke?
Just crash outright, then everyone can stop playing $SNDK
post-image
SNDK+6.27%
🛢️ BRENT CRUDE OIL FALLS TO ITS LOWEST LEVEL SINCE AUGUST!
📉 Oil prices continue to slide amid easing fears of further US-Iran military escalation.
💰 Brent dropped below $90, extending its sharp decline as markets anticipate reduced geopolitical supply risks.
🌍 Lower oil prices could ease global inflation and reduce pressure on energy markets. 📊
If Trump wasn’t president, Bitcoin would probably be trading at $150K–$200K right now.
post-image
BTC-0.67%
The Bitcoin short position has successfully hit take profit and been closed.
I just flipped and opened a long position, essentially re-entering to wait for a move.
Tonight’s CPI data is about to be released. Let’s see whether the market can use it as a catalyst to push higher.
$BTC $ETH $ZEC
Risk warning: The above is only a record of my personal trades and does not constitute investment advice. Contract trading involves extremely high risks; please participate with caution.
post-image
BTC-0.67%
ETH-1.26%
ZEC+1.16%
What Is Trading Expectancy? How Can Win Rate, Average Profit and Loss, and Trading Costs Be Combined in One Formula to Determine Whether a Strategy Is Worth Executing?

In cryptocurrency trading, one profitable trade does not mean a strategy works, and one losing trade does not mean it has failed. What really matters is how much the strategy can earn on average per trade when repeated over the long term. Trading expectancy is an important metric for assessing this.

First, what is trading expectancy?

Trading expectancy is the average expected profit or loss per trade when repeatedly trading a
post-image
$ARIA I'm bullish on this move. Consider entering near the current price, with an initial target around $0.44727. Entry reference: Long at 0.19943 $ARIA 👇ARIA+29.60%
Risk warning: The above is solely my personal market view and does not constitute investment advice. Contract trading carries extremely high risk, so please manage your position size and set stop-losses.
post-image
ARIA+22.03%
$BTC $ETH Today's setups for all three coins played out!

Bitcoin BTC: We anticipated a rejection near 75400, followed by a pullback after a push higher. Price met resistance at 75411 and moved lower, breaking through the first target and opening up further downside.
ETH: We positioned short in the 2140‑2160 resistance zone. Price surged to 2136, nearing the resistance band, then pulled back to a low of 2107, hitting the first target at 2110.
SOL: We looked for shorts in the 86.5‑88.5 zone. Price rose to 86.99, met resistance and moved lower, reaching a low of 85.47 and precisely hitting the f
BTC-0.65%
ETH-1.23%
  • 1
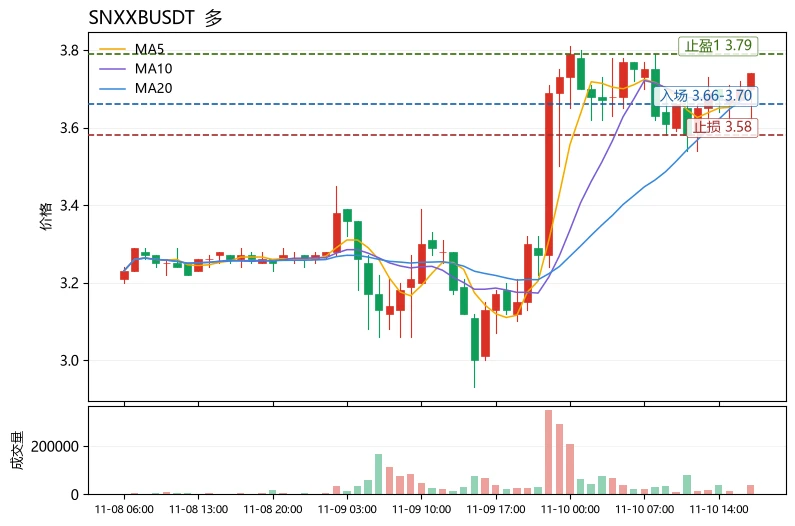
$SNXXB$SNXXB Current conclusion: Short-term bias is bullish, but do not chase the price higher. Volatility is elevated, so position size must be cut to less than half the usual level. Rationale: The current price of 3.74 is already near the upper Bollinger Band at 3.79432, and the 30-candle range is 23.53%, a typical high-volatility setup. MA5=3.694 is slightly above MA20=3.6905, so the trend remains intact, but bullish momentum is weakening at the margin. The MACD histogram at -0.009444 has turned bearish, RSI=62.3 is nearing overbought territory, and the Fear and Greed Index at 32 is in the
post-image
TQQQB
TQQQBTQQQB
Four.meme
MC:$3.36KHolders:2
0%
ARB+1.17%
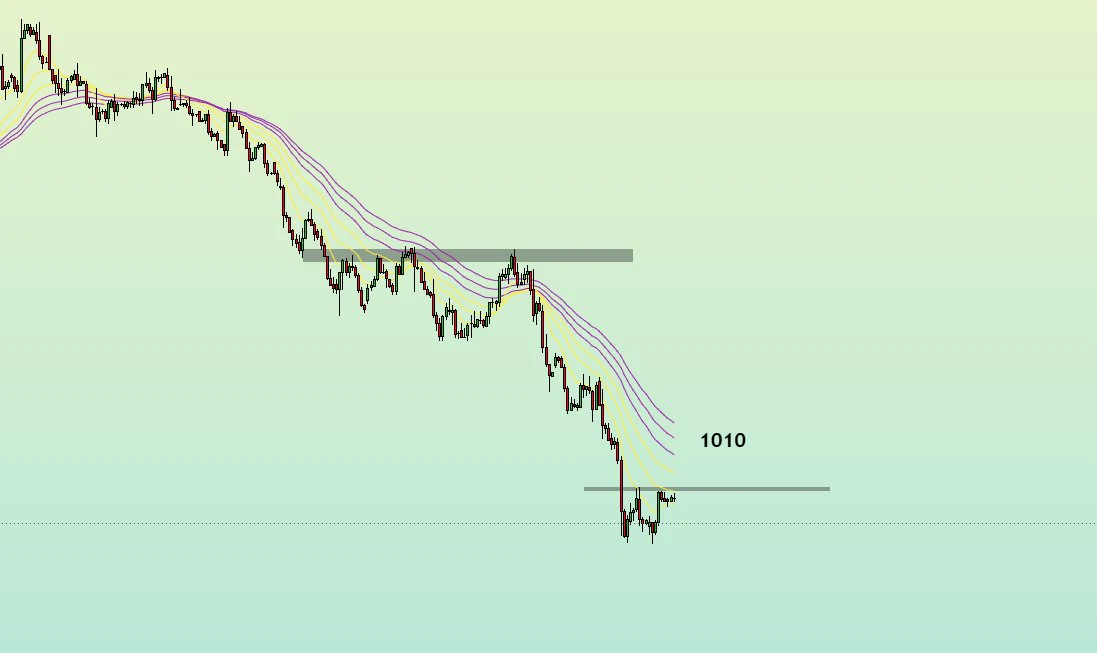
SanDisk $SNDK Looking at the current chart, if the candle closes well at 910, we can watch the 1010 area, which is the TP1 zone.
At this stage, going long is really only suitable for a small rebound. Personally, I prefer using moving averages as a reference.
post-image
SNDK+6.27%
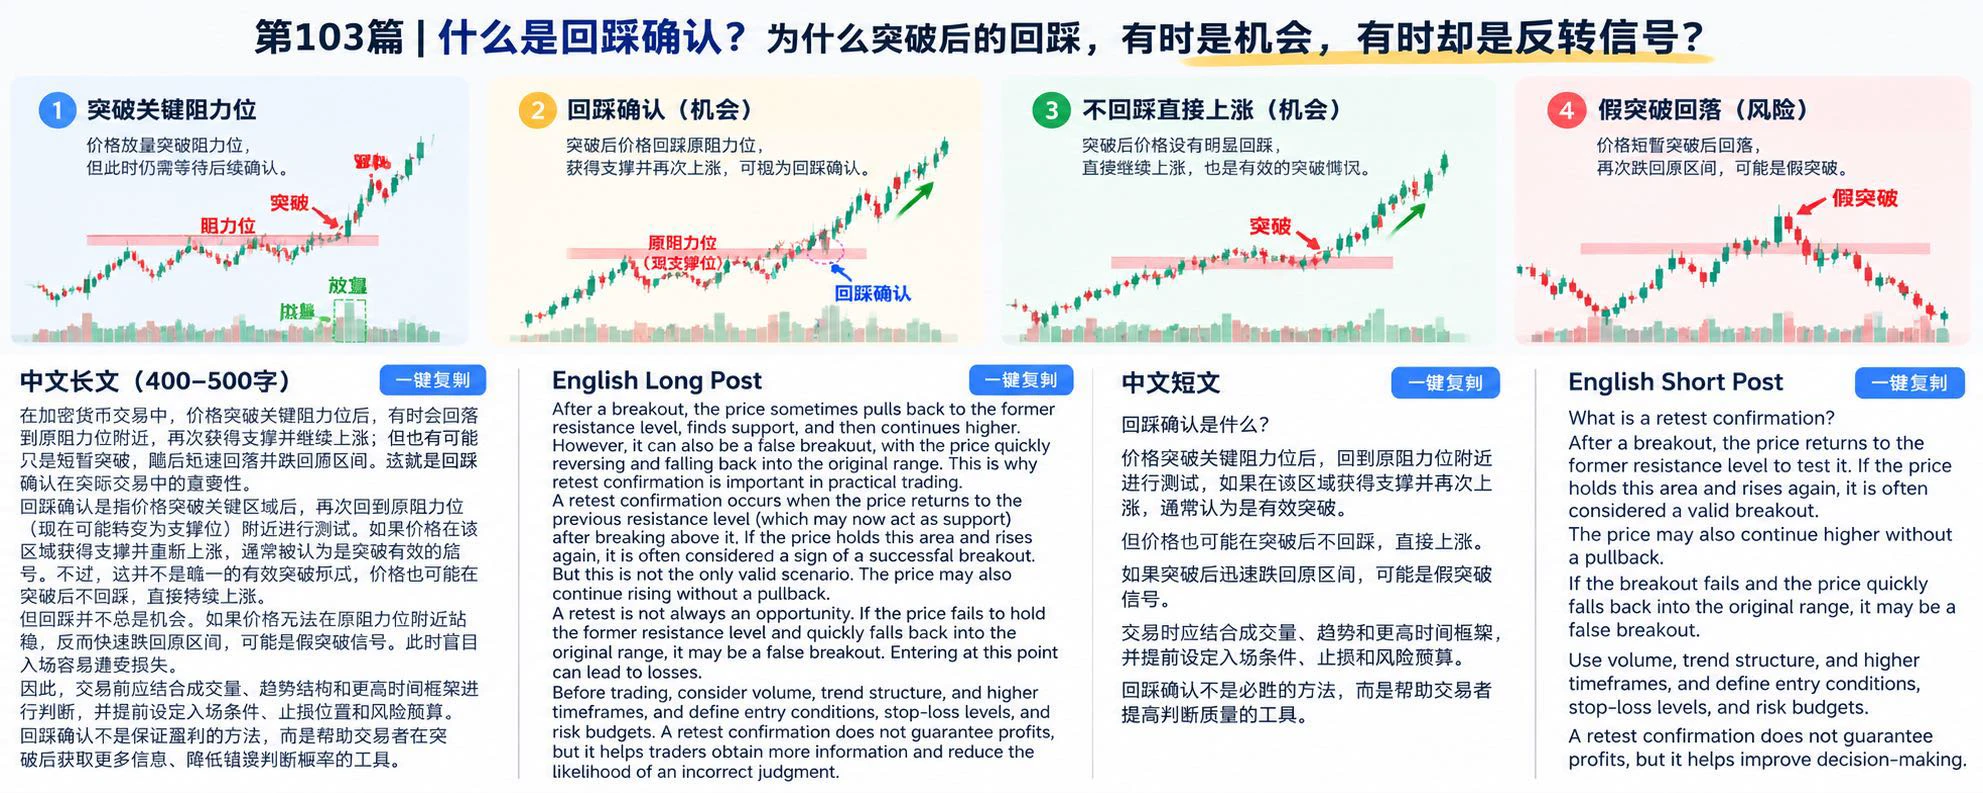
What Is Breakout Trading? How Can You Tell Whether to Enter or Wait for a Retest After Price Breaks Through a Key Area?

In cryptocurrency trading, when BTC breaks through a key resistance level, some traders chase the rally immediately, while others choose to wait for a retest. Both approaches have pros and cons. What really matters is not getting in before everyone else, but judging whether the breakout is likely to hold and planning for risk in advance.

First, what is breakout trading?

Breakout trading involves looking for trading opportunities according to predefined rules after the pric
post-image
BTC-0.67%
Watching the markets until evening
I thought we'd just wait quietly for CPI at 21:30
Fed Governor Waller spoke first in London
Even if October CPI improves from September
He still leans toward supporting a 25-basis-point rate hike in December
If core CPI month over month is around 0.3% or higher
He also mentioned considering a 50-basis-point hike
Nasdaq 100 futures briefly fell about 0.3% to 0.5%
Spot gold fell below 4090, down about 1.2% on the day
Silver was down about 2%
The 2-year Treasury yield briefly reached around 4.599%
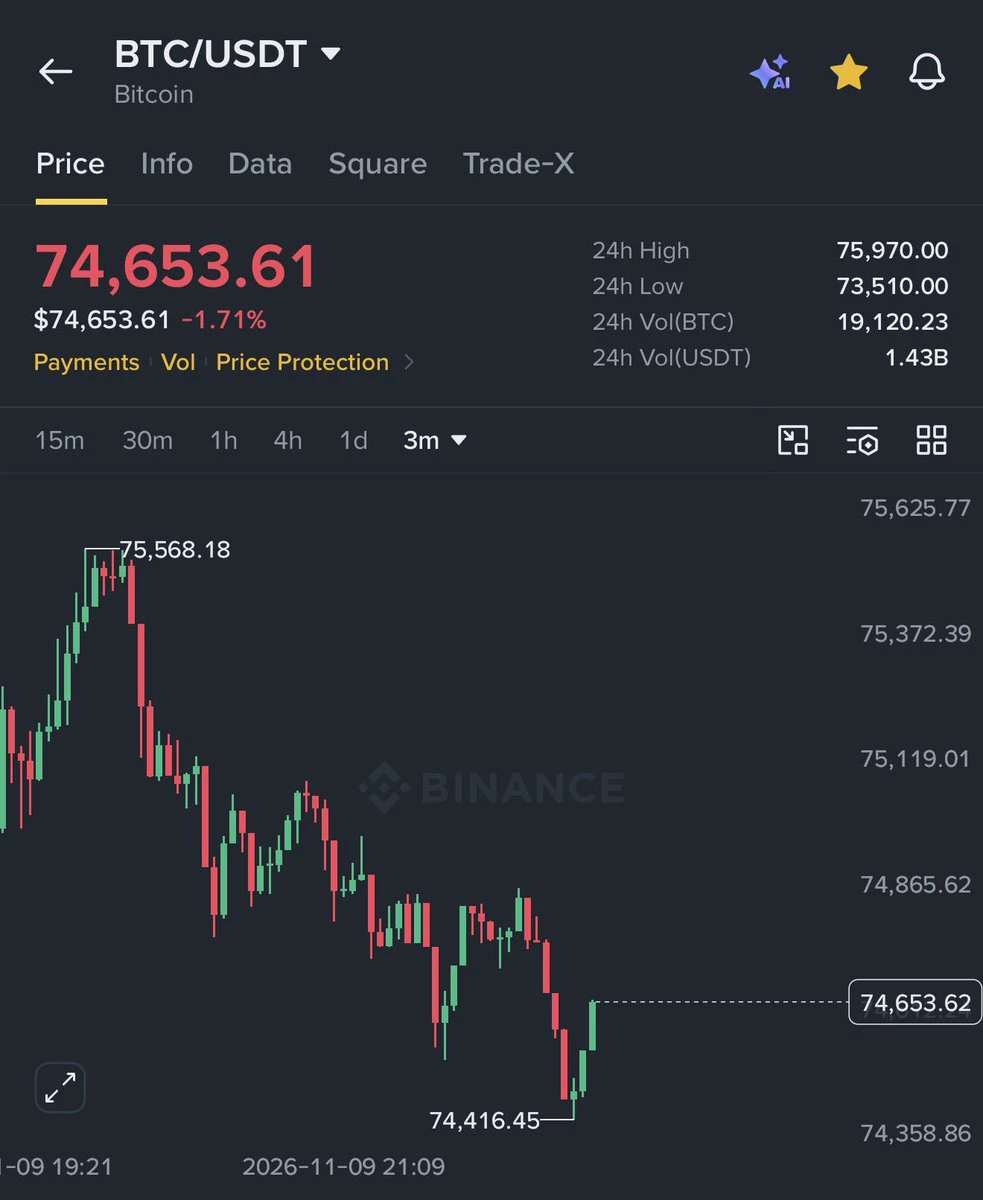
BTC is still around 74500
Tonight's numbers are the main event
Ke
post-image
GLDX-0.40%
PAXG+0.37%
XAG+0.47%
BTC-0.67%
Load More

Join 40 M users in our growing community

⚡️ Join 40 M users in the crypto craze discussion

💬 Engage with your favorite top creators

👍 See what interests you

Trending Topics

GateGlobalComplianceExpansion

167 Views203 Discussing

Gate continues to expand its global compliance footprint, now covering 81 regulated jurisdictions across Europe, North America, Asia, and Oceania. From MiCA and U.S. state-level MTLs to Japan’s FSA, Dubai, and Australia-related regulatory approvals, global exchanges are entering a new stage of compliance competition. Do you think regulatory strength will become as important as products and liquidity for exchanges in the future?

USCPIDataIncoming

55.02k Views2.29k Discussing

USIranTalksShowNewProgress

10.06k Views1.29k Discussing
View More