Square
Following
Hot
News
Profile
Share your thoughts
placeholder
Article
Man I just love @RaoulGMI
I think we got same energy 🔥🔥
post-image
Pay attention to @Pumpfun and pump memes.
My favorite sub 15m:
1. $Baton - 13m (shared at 3m)
2. $JEANPHIL - 9m
3. $SWORDCAT - 2.8m
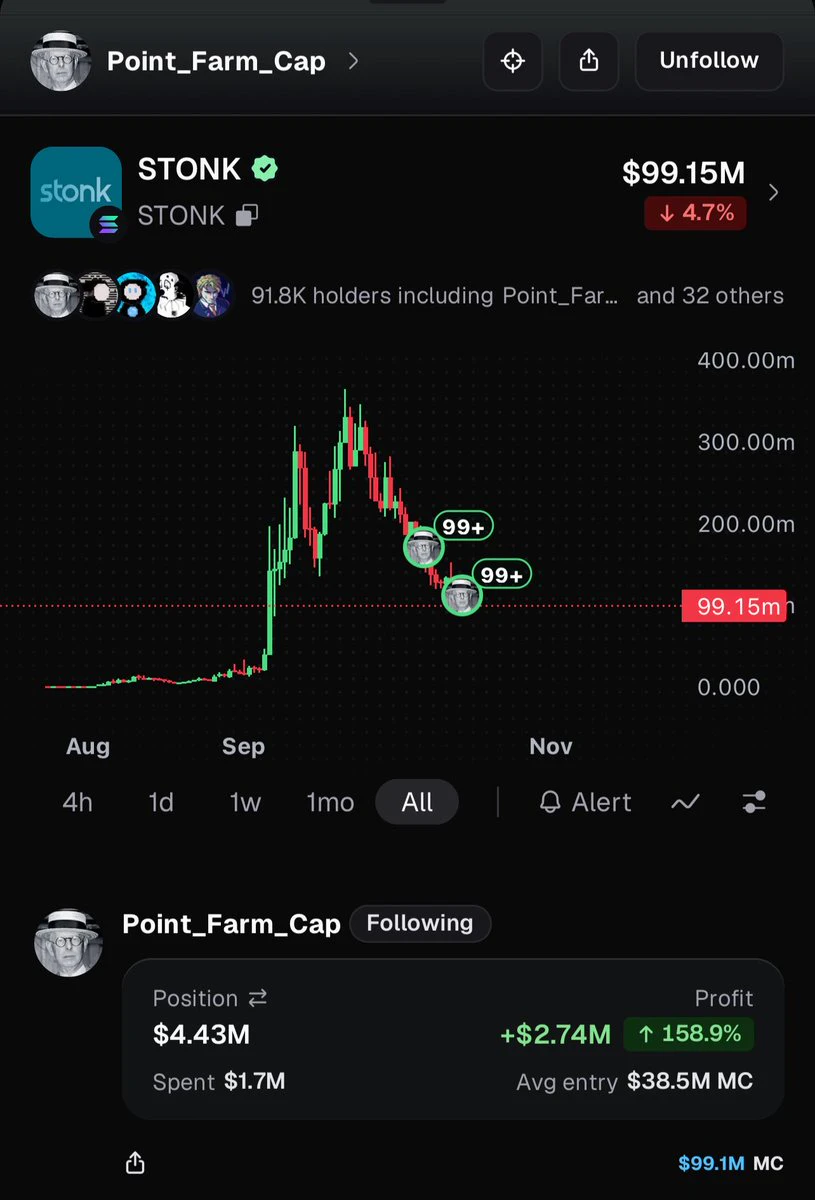
$Stonk bleeding.
$PONS and RH bleeding.
BSC is meh.
They will recover. But Pump chart showing strong relative strenght.
Same with these three plays.
STONK-9.38%
PONS-3.66%
RH+2.95%
$ZAMA Still debating whether to buy? The direction is already clear. Privacy isn’t just a narrative—ZCash entered the top 10 by market cap early, and $ZAMA holding steady at a $200 million market cap is a signal. DeFi’s total value locked will eventually migrate to privacy protocols. Whoever captures this space first will reap the rewards. If you think I’m talking nonsense, save a screenshot. #ZAMA Keep an eye on it.
post-image
ZAMA+4.09%
ZEC+2.56%
#OpenAIAnnualizedRevenue20BBelowReports
OpenAIAnnualizedRevenue20BBelowReports
OPENAI’S REVENUE ESTIMATE FALLS $20 BILLION SHORT: WHAT DOES IT MEAN FOR THE AI INDUSTRY AND GLOBAL MARKETS?
The artificial intelligence industry is facing a fresh financial reality check after reports revealed that OpenAI’s annualized revenue was approaching $50 billion at the end of September 2026, significantly below the approximately $70 billion figure widely reported earlier.
According to the Financial Times and Reuters, the difference reflects how OpenAI and its competitor Anthropic calculate revenue, rather
AMZN+3.27%
GOOGL+0.95%
NVDA-0.52%
ORCL+4.76%
NAS100+0.42%
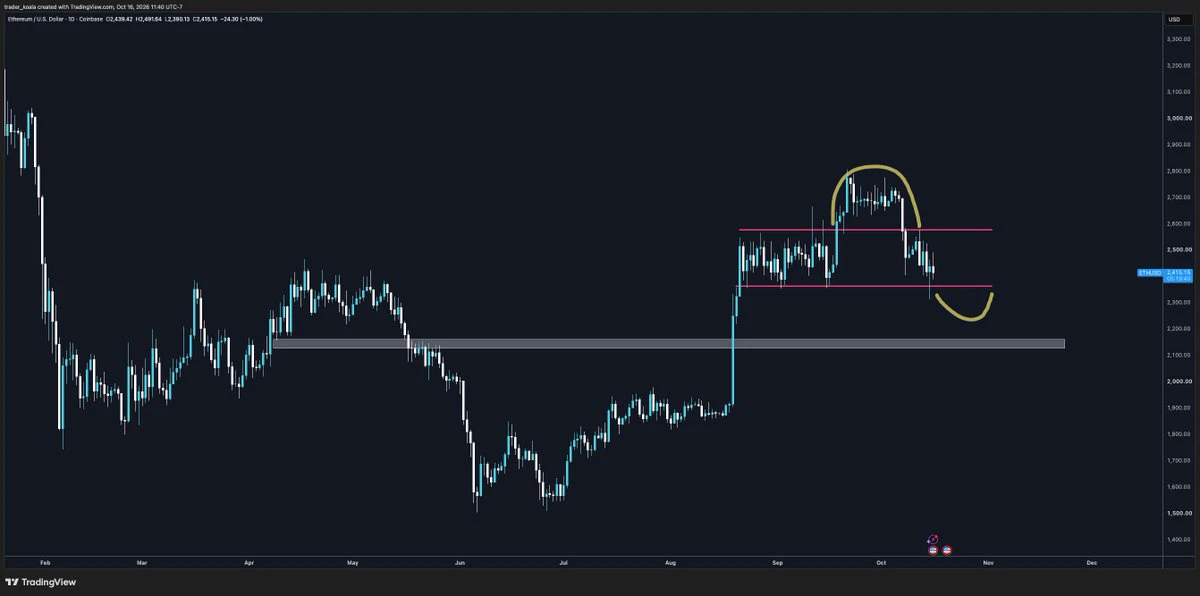
This pullback level completely matches expectations from September 21, and the rebound also met expectations. The timing was ~5 days later than expected, but it is not a major issue.
If 2400 holds and triggers a rebound, the upside target is around 2720. The probability of directly breaking through 2720 is not high; there is a high probability of ranging between 2400 and 2720 for one month or multiple months.
A 4H breakout above 2880 can confirm a genuine breakout, after which it will head directly toward 4000 (in terms of the cycle, it will not happen that quickly).
If a false breakdown occur
ETH+0.32%
$BTC is going up, but I think the opposite is true—the S&P 500 is still the better choice. If you had invested $1,000 in $SPY in 1994, ridden out the three crashes in 2000, 2008, and 2022, it would be worth roughly 29 times as much today. The most dangerous time is when you’re heavily invested and sitting on large unrealized gains: people become more conservative and end up missing opportunities to add to their positions. If you have anything to add, share it in the comments.
post-image
BTC+0.71%
SPYX+0.55%
$STRK Breaks Key Resistance on the Daily Chart
STRK has pushed above the major $0.061–$0.063 resistance zone, reaching around $0.0715 with strong bullish momentum.
My view: This breakout looks promising, but the sharp move also increases the risk of a short-term pullback.
I'm watching $0.061–$0.063 as potential new support. If buyers defend this zone, $0.075 and $0.080 could be the next targets.
A daily close back below $0.061 would weaken the breakout setup.
I prefer waiting for a clean retest rather than chasing this candle.
Confirmation matters more than hype.
DYOR, not financial advice.
post-image
STRK+24.26%
I wonder what I did to this Jew 😂😭
post-image
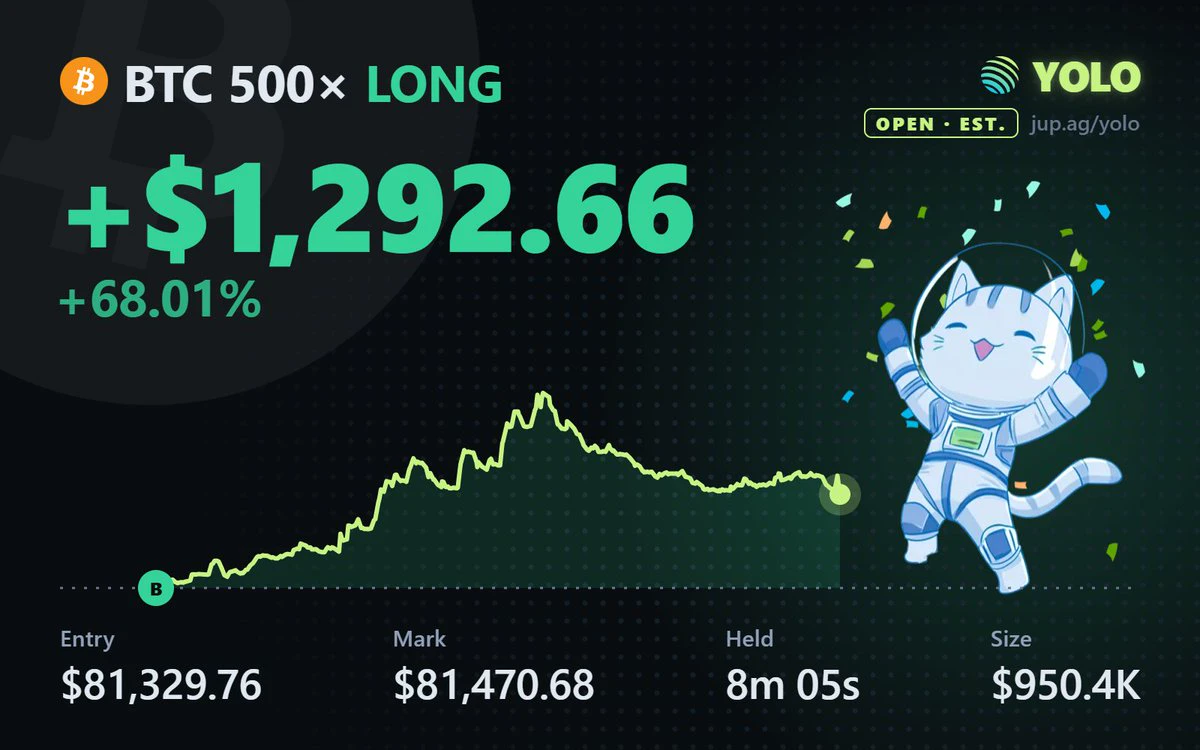
After dropping to $80,800, Bitcoin bounced back up toward $82,860 -$83,000 resistance.
However, open interest dropped from 266K to 257.3K coins during the pump, which shows short traders were just closing their positions rather than new buyers stepping in.
Because of this lack of real buying pressure, the price faces a strong risk of getting rejected at these highs
$BTC ‌
#GateAtTOKEN2049 #GateWCTCS9GlobalTradingCompetition
post-image
BTC+0.71%
Hope you make some monies today?
post-image
( new streamer) market overview
live-cover
LIVE647
Ethereum price at $2,500 crossroads as Supertrend turns bearish
Ethereum price has recovered to around $2,493 after a sharp fall toward $2,400, but its daily Supertrend has turned bearish, and the 4-hour chart still shows negative money flow.
Daily Supertrend turns bearish above ETH
The daily TradingView chart displayed a red Supertrend reading at $2,764.28 following Ethereum’s latest sell-off. The indicator had previously tracked below the price during the advance from August into September.
Its shift above $ETH places the daily trend signal on the bearish side. At approximately $2,493, Ether
ETH+0.35%
Bitcoin rallied 45% from $57k to $82k
I think we see $100,000 BTC by December
I am SO BULLISH!!
post-image
BTC+0.71%
$DOT This rally is a bit like the milk tea shop at the entrance of a residential compound suddenly getting a long queue—yesterday nobody cared at 1.04, but today people are rushing in at 1.2. It’s up 15.3% over 24 hours, with $110 million in trading volume, and funds are clearly shifting from the ETH ecosystem toward Polkadot. The on-chain staking ratio has been rising recently, locking up considerable selling pressure. On top of that, expectations for renewed interest in parachain slot auctions have heated up, directly igniting sentiment. But note that 1.22 is the previous high resistance lev
DOT+12.09%
ETH+0.32%
If you invested $10,000 in T-mobile 24 hours ago you would’ve had $8,600 now
post-image
  • 1
$TIA The most unusual detail today wasn’t the drop of more than 9%, but that the funding rate was actually negative—-0.0004%. The price fell to near the lower Bollinger Band, yet shorts had to pay to maintain their positions, indicating that this sell-off was driven more by spot selling or forced long liquidations than by active shorting in futures. Sharp declines under this structure are often more likely to see a recovery than declines after the funding rate turns positive.
Educational point: How to use moving averages to determine whether a trend is healthy. Look at two lines—MA5 and MA20.
post-image
ZRO-2.73%
$PYTH ‌ is pulling back from resistance, and the next few hourly candles could decide whether this rally gets another leg.
Price reached $0.08754 before sellers stepped in, bringing it back to $0.08098. The broader move from $0.07179 has been strong, but short term momentum is clearly cooling.
Here’s the setup I’m watching:
Immediate support: $0.0800–$0.0810 Key support: $0.0779–$0.0785 Major support: $0.0745–$0.0750 First resistance: $0.0825–$0.0840 Breakout level: $0.08754
If buyers defend this area and push back above $0.084, another attempt at $0.0875 becomes more realistic. A break abov
PYTH-1.23%
MU-0.69%
  • 5
  • 1
Purchasing property in Dubai with cryptocurrency
Accepts all cryptocurrencies
​$BTC $ETH $SOL $USDT #ETH #BTC #SOL #USDT
post-image
BTC+0.71%
ETH+0.32%
SOL-0.65%
USDT0.00%
crypto trade today
live-cover
LIVE617
Drop your $SOL wallets..
Must Join tg:
Check your wallet after 500 minutes! 💰⌛️
post-image
SOL-0.65%
Load More

Join 40 M users in our growing community

⚡️ Join 40 M users in the crypto craze discussion

💬 Engage with your favorite top creators

👍 See what interests you

Trending Topics

GateAtTOKEN2049

37.84k Views21.15k Discussing

Gate brought a series of major events to TOKEN2049 Singapore! From the official launch of Gate Money to the F1 Red Bull driver meet-and-greet and the Gate Gala, we witnessed a new chapter of "One Gate, Borderless Finance." Which moment from TOKEN2049 stood out most to you?

GateWCTCS9GlobalTradingCompetition

32.73k Views3.5k Discussing

BTC Pulls Back to 81000

26.51k Views35.96k Discussing

View More