Square
Following
Hot
News
Profile

BlackoutcryptoWolf

vip
Active for: 0.3y
Peak Tier 0
No content yet
10
Following
552
Followers
63
Liked
🔹Rate Hike Expectations Rise, but U.S. Stocks and Crypto Rally Against the Trend! Jensen Huang Step
live-cover
LIVE258
Gate Live October Streamer Return Season | Schedule Halfway Through, Rankings Still Changing
📊 Top 20 updated in real time, with more chances to climb the rankings in the second half
✅ Return to streaming now and earn up to $30 GT in cash
✅ Consecutive streaming rewards + recommendation slots are now available
Seize the ranking push phase—return to streaming for a chance to lock in rewards
👉 Start streaming now: https://www.gate.com/live?type=apply
📄 Event details: https://www.gate.com/announcements/article/102065
GT-1.15%
QTR1
Bitcoin (BTC) is experiencing a week full of challenges, currently trading within the range of $61,000 to $63,000 after a significant decline from levels of $71,000. This recent drop broke the medium-term bullish trend and put the market in a state of anticipation.
Here is a detailed look at the expectations and market-driving factors in the coming days:
Factors Influencing Price This Week
Inflation Data and the U.S. Federal Reserve (Fed) Stance: Ongoing inflation (especially Consumer Price Index (CPI) and Producer Price Index (PPI) data) reinforces expectations that the Fed will not cut interest rates anytime soon. Keeping interest rates high usually puts pressure on high-risk assets like Bitcoin.
Outflows from Funds (ETFs): Bitcoin spot ETFs in the United States have experienced a wave of continuous outflows this week (some days saw withdrawals of more than $200 million), adding direct selling pressure to the market.
Geopolitical Tensions: Renewed concerns in the Middle East are prompting some investors to shy away from risk, reducing liquidity flowing into digital currencies.
Technical Levels to Watch (Support and Resistance)
The market currently shows a bearish bias as it trades below the main moving averages (50, 100, and 200 days).
Bearish Scenario (Continued Correction): If selling pressure persists and Bitcoin cannot hold above $60,000, it may test deeper support levels. Some on-chain data analyses indicate that the $53,600 level (which represents the "realized price" or the average purchase cost for miners and investors) could be the next potential bottom in case of a sharp decline.
Bullish Scenario (Recovery): To return to an upward trend and regain buyer confidence, the price needs to break through and stay above technical resistance zones around $72,000 to $73,000. Until then, any rise is considered a temporary recovery. $BTC

BTC-0.83%
  • 2
#GateMoneyOfficiallyLaunches 🥮 Gate.io Mid-Autumn Festival Red Packet Rain & Gate Money Official Launch! 🎁
Gate.io is bringing an extraordinary celebration to our global community! To mark the Mid-Autumn Festival, the Red Packet Rain campaign is now officially LIVE, offering all verified users a prime opportunity to claim exciting rewards with zero trading required. Coupled with the official rollout of Gate Money, digital asset management and daily Web3 financial utility are reaching a brand-new milestone.
🌟 Reward Pool Highlights
By simply participating during the campaign windows, users s
BlackoutCryptoBoy
#GateMoneyOfficiallyLaunches ​🥮 Gate.io Mid-Autumn Festival Red Packet Rain & Gate Money Official Launch! 🎁
​Gate.io is bringing an extraordinary celebration to our global community! To mark the Mid-Autumn Festival, the Red Packet Rain campaign is now officially LIVE, offering all verified users a prime opportunity to claim exciting rewards with zero trading required. Coupled with the official rollout of Gate Money, digital asset management and daily Web3 financial utility are reaching a brand-new milestone.
​🌟 Reward Pool Highlights
​By simply participating during the campaign windows, users stand a chance to unlock a diverse selection of benefits directly deposited into their Gate.io accounts:
​🪙 Random Crypto Tokens – Direct token distributions to boost your spot portfolio.
​📈 Contract Position Trial Vouchers – Test futures trading strategies with zero personal capital risk.
​🎯 Prediction Market Trial Vouchers – Forecast market trends and engage with high-yield product features.
​💸 Trading Fee Cashback Vouchers – Significantly reduce trading friction and platform fees on upcoming transactions.
​📜 Fractional Shares of Popular Stocks – Expand your financial horizons by acquiring fractional exposure to global equities.
​🛠️ Step-by-Step Participation Guide
​Complete Event Registration: Head over to the official campaign page on the Gate.io app or desktop portal and hit the registration button.
​Identity Verification (KYC): Ensure your Gate.io account is fully verified to meet compliance and eligibility criteria.
​Claim Your Red Packet: Enter the event page during the active time slots and tap the Red Packet Pop-up on your screen to unpack your surprise reward!
​⏰ Today's Official Claim Windows (UTC+8)
​Slot 1: 12:00 – 15:00 (UTC+8)
​Slot 2: 20:00 – 23:00 (UTC+8)
​⚠️ Key Rules & Eligibility:
​First Come, First Served: Rewards are limited per session. Log in right as the timer starts to maximize your chance!
​Participation Cap: Each eligible user can participate a maximum of 3 times throughout the event duration.
​Single Claim Rule: Users who have successfully claimed during a specific round cannot re-claim in that same session.
​🚀 Why Trade & Earn on Gate.io?
​Gate.io remains a premier choice for crypto traders globally, providing top-tier security, deep market liquidity, and groundbreaking financial products:
​100% Proof of Reserves (PoR): Gate.io consistently maintains verifiable, user-auditable 100% reserves to ensure complete asset safety.
​Gate Money Ecosystem: Designed to bridge daily financial solutions with seamless Web3 asset transfers and global digital payments.
​Comprehensive Market Access: Over 1,700 listed tokens, institutional-grade futures, startup launchpads, and integrated DeFi solutions—all inside one ecosystem.
​👉 Claim your Mid-Autumn good luck now:
https://www.gate.com/campaigns/mid-autumn-2026
​#Gate #Gate月满交易节 #MidAutumnRedPacketRain #GateMoneyOfficiallyLaunches
repost-content-media
  • 2
#GTBurnsNearly2MTokensInQ3 🔥 THE SCARCITY ENGINE: GateToken (GT) Q3 Burn Destroys Nearly 2 Million Tokens!
The numbers are in, and the deflationary trajectory of GateToken ($GT ) has hit another historical milestone.
In our relentless commitment to long-term tokenomics and value creation, Gate.io has officially completed the Q3 On-Chain GT Burn—permanently removing nearly 2 Million GT (~$22.35M USD) from total circulation forever! 📉💥
📉 The Power of Real Deflation (By The Numbers)
While ordinary tokens inflationary print, GT systematically shrinks. Here is the verified breakdown:
💥 Q3 Token
BlackoutCryptoBoy
#GTBurnsNearly2MTokensInQ3 🔥 THE SCARCITY ENGINE: GateToken (GT) Q3 Burn Destroys Nearly 2 Million Tokens!
The numbers are in, and the deflationary trajectory of GateToken ($GT ) has hit another historical milestone.
In our relentless commitment to long-term tokenomics and value creation, Gate.io has officially completed the Q3 On-Chain GT Burn—permanently removing nearly 2 Million GT (~$22.35M USD) from total circulation forever! 📉💥
📉 The Power of Real Deflation (By The Numbers)
While ordinary tokens inflationary print, GT systematically shrinks. Here is the verified breakdown:
💥 Q3 Tokens Annihilated: 1,987,321+ GT
💵 Quarterly Value Destroyed: $22,350,000+ USD
🏛️ Total Historical Burn: 191,934,541+ GT
📊 Supply Eradicated: ~63.98% of total initial supply is GONE forever!
🌐 Total On-Chain Value Burned: Over $1.504 Billion USD
💡 Why This Burn Marks a Turning Point for $GT Holders
This isn't just a routine update—it’s a direct value injection for every GT holder in the Gate.io ecosystem:
1️⃣ The Aggressive Supply Squeeze
With 63.98% of all GT permanently burned, remaining tokens become mathematically scarcer every single quarter as Gate.io trading volumes surge.
2️⃣ Fueled by Real Exchange Revenue
Unlike speculative tokens, GT burns are backed 100% by actual Gate.io ecosystem profits—generated across Spot, Futures, Margin, and Web3 infrastructure.
3️⃣ Unrivaled Utility Stack
Holding $GT doesn't just mean holding scarcity—it unlocks VIP Trading Fee Discounts, exclusive Gate Startup Airdrop Allocations, native gas utility on GateChain, and high-yield passive rewards via Gate Earn.
🛡️ Uncompromising Security & Transparency
At Gate.io, trust is built on proof, not promises:
🔬 100% On-Chain Verifiable: Every burned GT is sent to a public, audited dead wallet address.
🔒 100% Proof of Reserves (PoR): Audit-backed 1:1 security for every single user asset on the platform.
💎 Scarcity is built by design. The future belongs to those who hold.
👉 Verify on-chain burn metrics & upgrade your VIP status today:
https://www.gate.com
#GTBurnsNearly2MTokensInQ3
repost-content-media
GT-1.15%
  • 2
#CFTCProposesNew���CryptoAssetMarket”Category CFTC Proposes "Crypto Asset Market" (CAM) Category: A Historic Shift in U.S. Regulation 🇺🇸⚡
The global crypto landscape has reached a defining inflection point! The U.S. Commodity Futures Trading Commission (CFTC) has officially initiated a landmark regulatory proposal introducing the "Crypto Asset Market" (CAM) category.
This framework represents a structural evolution away from outdated, restrictive models and toward clear, fit-for-purpose national rules for digital asset spot, leverage, and derivative transactions. By establishing federal sta
BlackoutCryptoBoy
#CFTCProposesNew���CryptoAssetMarket”Category CFTC Proposes "Crypto Asset Market" (CAM) Category: A Historic Shift in U.S. Regulation 🇺🇸⚡
The global crypto landscape has reached a defining inflection point! The U.S. Commodity Futures Trading Commission (CFTC) has officially initiated a landmark regulatory proposal introducing the "Crypto Asset Market" (CAM) category.
This framework represents a structural evolution away from outdated, restrictive models and toward clear, fit-for-purpose national rules for digital asset spot, leverage, and derivative transactions. By establishing federal standards—including mandatory Proof-of-Reserves (PoR) requirements and rigorous token listing rules—the CFTC aims to cement digital assets into the mainstream financial architecture while driving institutional clarity.
🔍 How Key Assets Stand to Benefit Under Clear CFTC Oversight
Regulatory clarity provides a solid foundation for fundamental utility assets to expand globally:
1️⃣ Bitcoin ($BTC ) – The Sovereign Digital Commodity
As the undisputed gold standard of crypto commodities, $BTC stands as the primary beneficiary of a unified CFTC framework. Clearer institutional channels mean deeper liquidity, streamlined derivatives trading, and accelerated treasury adoption globally.
2️⃣ XRP ($XRP ) – Institutional Cross-Border Settlement
Institutional liquidity thrives on regulatory certainty. Under a standardized CFTC framework, $XRP's core value proposition—near-instantaneous, low-cost cross-border payments for banking networks—gains immense structural tailwinds.
3️⃣ Stellar ($XLM ) – Enterprise Asset Tokenization & Payments
Focused on real-world financial inclusion and cross-asset transfers, $XLM benefits significantly from defined federal compliance rules, paving the way for institutional stablecoin issuance and tokenized real-world assets (RWA).
4️⃣ Tezos ($XTZ ) – On-Chain Governance & Institutional Smart Contracts
Known for its self-amending blockchain architecture and formal verification security, $XTZ is built for enterprise-grade smart contracts. Regulatory clarity opens doors for formal institutional DeFi deployment on Tezos.
🚀 Why Gate.io is Built for the Regulatory Evolution
As regulatory standards tighten worldwide, Gate.io remains steps ahead in compliance, transparency, and liquidity:
🔐 Pioneering 100% Proof of Reserves (PoR):
Long before regulatory mandates like the CFTC’s CAM proposal highlighted PoR, Gate.io implemented audited, zero-knowledge cryptographic Proof of Reserves, guaranteeing 1:1 backing for all user assets.
💧 Deep Liquidity Across Core Markets:
Trade $BTC,$XRP, $XLM,$XTZ, and over 1,700+ crypto assets on Gate.io with institutional-grade depth, minimal slippage, and razor-thin spreads across both Spot and Futures products.
🌐 Comprehensive Web3 & Multi-Asset Access:
From Gate Startup launchpads to advanced financial tools like Gate Money, Gate.io provides an end-to-end portal designed for retail and institutional traders alike.
🎯 Conclusion: The Next Era of Digital Finance
The CFTC's move toward establishing a dedicated Crypto Asset Market (CAM) category isn't just news—it is a signal that crypto is maturing into a core global asset class. Platforms built on transparency, deep liquidity, and security will lead this next market expansion.
👉 Trade BTC, XRP, XLM, XTZ and explore institutional-grade trading today:
https://www.gate.com
$BTC $XRP $XLM $XTZ #CFTCProposesNew���CryptoAssetMarket”Category
BTC-0.83%
XRP-2.66%
XLM-2.40%
XTZ-0.97%
RWA-0.47%
  • 2
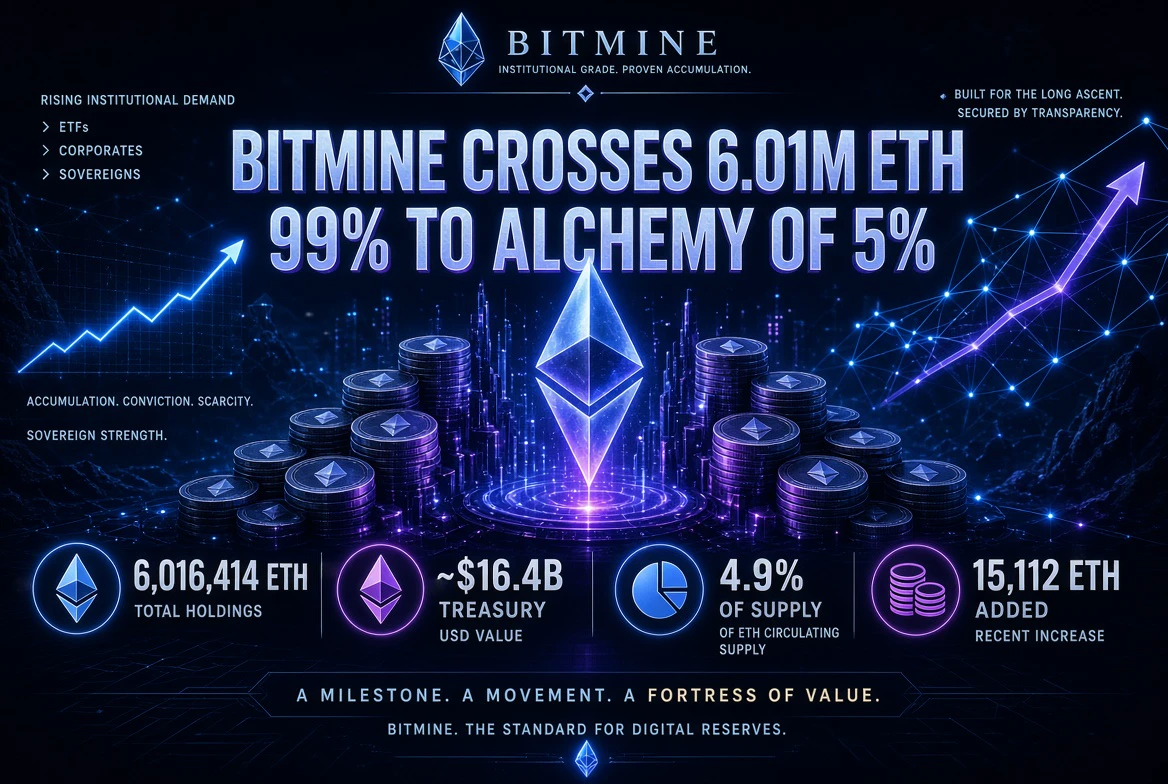
#BitmineAddsMoreETH,HoldingsTop6.01M 🔥 INSTITUTIONAL POWER MOVE: Bitmine Crosses 6.01M ETH — 99% Toward the Legendary “Alchemy of 5%”!
The numbers just dropped, and the Ethereum supply story just got a whole lot tighter.
Bitmine Immersion Technologies (NYSE: BMNR), chaired by Tom Lee, has once again delivered an uncompromising statement of conviction:
💥 Latest Weekly Acquisition: +15,112 ETH
📊 Total ETH Holdings: 6,016,414 ETH
💵 Treasury Value: ~$16.4 Billion (at $2,726/ETH)
🏛️ Share of Total Supply: 4.9% of Ethereum’s 122.1 million ETH
🎯 Progress to “Alchemy of 5%” Target: 99% complete
BlackoutCryptoBoy
#BitmineAddsMoreETH,HoldingsTop6.01M 🔥 INSTITUTIONAL POWER MOVE: Bitmine Crosses 6.01M ETH — 99% Toward the Legendary “Alchemy of 5%”!
The numbers just dropped, and the Ethereum supply story just got a whole lot tighter.
Bitmine Immersion Technologies (NYSE: BMNR), chaired by Tom Lee, has once again delivered an uncompromising statement of conviction:
💥 Latest Weekly Acquisition: +15,112 ETH
📊 Total ETH Holdings: 6,016,414 ETH
💵 Treasury Value: ~$16.4 Billion (at $2,726/ETH)
🏛️ Share of Total Supply: 4.9% of Ethereum’s 122.1 million ETH
🎯 Progress to “Alchemy of 5%” Target: 99% complete — only ~89,000 ETH remaining
This is not a one-off buy.
This is the 15th consecutive month of uninterrupted weekly ETH accumulation that began on June 30, 2025. No pauses. No excuses. Just relentless institutional demand removing ETH from the open market week after week.
The Real Engine Behind the Numbers
While most of the market debates price, Bitmine is building a cash-flow machine:
5,067,309 ETH already staked (≈84% of total holdings)
Projected annualized staking revenue: ~$363 million
7-day annualized yield: 2.63%
This is not speculative holding. This is productive capital generating real yield while simultaneously tightening liquid supply.
Why This Matters for Every $ETH Holder on Gate.io
When a single publicly listed company approaches control of 1 out of every 20 ETH in existence, the market structure changes. Liquidity becomes scarcer. Institutional conviction becomes visible on-chain and in the order books.
On Gate.io, you sit at the center of this shift:
Deepest ETH liquidity across Spot, Futures, and Margin
Seamless access to ETH staking and yield products via Gate Earn
VIP fee discounts that reward high-volume traders who understand institutional flows
Real-time market depth so you can position alongside the same capital that is quietly absorbing supply
Scarcity is no longer a theory.
It is being engineered in real time by one of the largest corporate Ethereum treasuries on the planet.
The future belongs to those who recognize structural demand before the rest of the market fully prices it in.
👉 Trade ETH with institutional-grade liquidity, upgrade your VIP status, and stay ahead of the supply squeeze — only on Gate.io
https://www.gate.com
#BitmineAddsMoreETH #HoldingsTop6.01M #BitmineAddsMoreETH,HoldingsTop6.01M
repost-content-media
BMNR-7.26%
ETH-1.80%
  • 2
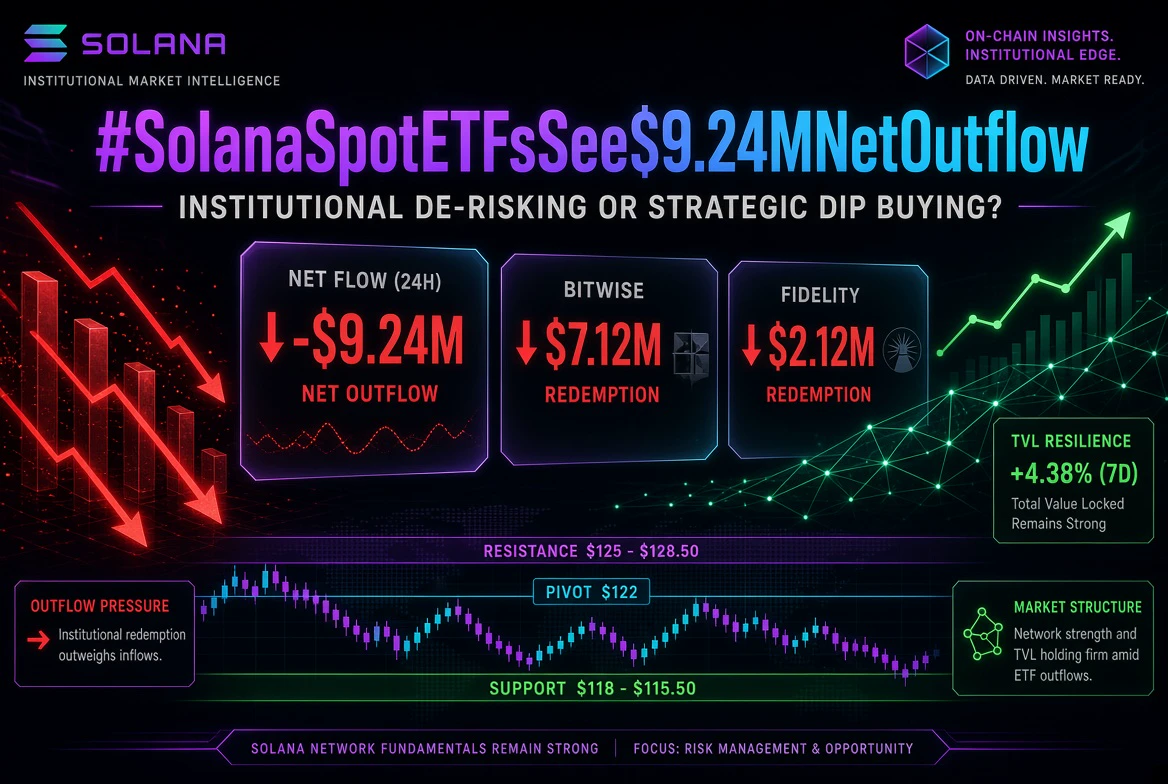
#SolanaSpotETFsSee$9.24MNetOutflow
Institutional De-risking or Strategic Dip Buying?
US Spot Solana ETFs registered a net outflow of $9.24 Million, marking a temporary pause in institutional accumulation. As macroscopic shifts and regulatory updates continue to shape the digital asset landscape, tracking daily ETF flow metrics offers key insight into smart-money positioning.
📊 Comprehensive Flow & On-Chain Breakdown
Institutional Fund Outflows: The primary contributor to today's negative net flow was Bitwise ($BSOL), accounting for approximately $7.12M in redemptions, followed by Fidelity
BlackoutCryptoBoy
#SolanaSpotETFsSee$9.24MNetOutflow
Institutional De-risking or Strategic Dip Buying?
US Spot Solana ETFs registered a net outflow of $9.24 Million, marking a temporary pause in institutional accumulation. As macroscopic shifts and regulatory updates continue to shape the digital asset landscape, tracking daily ETF flow metrics offers key insight into smart-money positioning.
📊 Comprehensive Flow & On-Chain Breakdown
Institutional Fund Outflows: The primary contributor to today's negative net flow was Bitwise ($BSOL), accounting for approximately $7.12M in redemptions, followed by Fidelity ($FSOL) with roughly $2.12M.
Macro Accumulation Context: Despite this daily net outflow, aggregate cumulative inflows across major Spot Solana ETF products remain firmly in positive territory above $1.6B+, signaling intact structural demand.
On-Chain & Liquidity Dynamics: Solana’s Total Value Locked (TVL) and Decentralized Exchange (DEX) daily volume continue to demonstrate network resilience, maintaining heavy usage despite short-term ETF capital reallocation.
📈 Technical Outlook & Strategic Levels
Resistance Zone : $125.00 - $128.50 [Key Breakout Target]
Current Pivot : $122.00 [Volume Weighted Average Price]
Support Floor : $118.00 - $115.50 [Major Demand & Liquidity Zone]
Short-Term View: High-frequency ETF redemptions typically exert immediate pressure on spot order books. Watch for liquidation clusters near key support ranges before establishing direction.
Risk Management: Volatility following daily fund flows favors disciplined Dollar-Cost Averaging (DCA) or awaiting structural retests over high-leverage entry.
💬 Gate Community Discussion & Strategy Exchange
How are you adjusting your spot and futures positioning following today's ETF metrics?
🚀 Bullish Accumulation: Viewing the $9.24M outflow as routine profit-taking and scaling into long-term spot positions.
🐻 Bearish Caution: Expecting further downside pressure on $SOL until ETF flows flip net positive.
⚖️ Hedging & Range Trading: Executing grid trading or delta-neutral strategies within the $115–$125 channel.
Drop your technical analysis and market bias in the comments below! 👇
#Solana $SOL
repost-content-media
SOL-1.96%
  • 1
#BTCBreaksThrough$86,000 BTC Holds Critical Structure After $86K Breakout — Updated Market Breakdown & Outlook
Bitcoin recently surged through the $86,000 level (intraday highs near $86,900–$87,200), marking a decisive technical reclaim of a major multi-month resistance zone. While price has since consolidated near $83,000–$83,500, the structural significance of the breakout remains intact. This move was fueled by persistent institutional demand, improving macro conditions, and forced short covering.
Institutional Drivers & On-Chain Fundamentals
Spot ETF Accumulation Continues: U.S. spot Bitco
BlackoutCryptoBoy
#BTCBreaksThrough$86,000 BTC Holds Critical Structure After $86K Breakout — Updated Market Breakdown & Outlook
Bitcoin recently surged through the $86,000 level (intraday highs near $86,900–$87,200), marking a decisive technical reclaim of a major multi-month resistance zone. While price has since consolidated near $83,000–$83,500, the structural significance of the breakout remains intact. This move was fueled by persistent institutional demand, improving macro conditions, and forced short covering.
Institutional Drivers & On-Chain Fundamentals
Spot ETF Accumulation Continues: U.S. spot Bitcoin ETFs posted net inflows of ~$119M on the latest reported day, with +$239M over 7 days and +$3.46B over 30 days. BlackRock’s IBIT remains the dominant absorber of supply.
Macro Tailwind: Cooling inflation data and shifting rate-cut expectations have supported broader risk-on sentiment across equities and crypto.
Derivatives Dynamics: The push above $86,000 triggered meaningful short liquidations, amplifying upside momentum through forced buy-backs.
Exchange Reserves: Continued net outflows from major centralized exchanges signal ongoing migration into long-term custody and institutional wallets — a classic supply-tightening signal.
Technical Structure & Key Levels
Level
Price Zone
Significance
Resistance 2 (Major Target)
$88,500 – $90,000
Psychological + liquidity cluster
Resistance 1 (Local Pivot)
$86,000 – $86,800
Breakout zone / prior supply node
Current Price Area
~$83,200 – $83,500
Consolidation after breakout
Immediate Support
$82,800 – $83,000
Recent low / volume shelf
Demand Floor
$84,000 – $84,500 (reclaim) / $81,500 – $82,000
Stronger structural base if deeper retest
Short-term bias: As long as Bitcoin holds above the $82,800–$83,000 demand zone and eventually reclaims $86,000 on a daily close, the path of least resistance remains toward the $88,500–$90,000 liquidity pocket. A failed retest of $86k that breaks lower opens room for a deeper flush into the $81.5k–$82k region.
Execution Framework
Volatility remains elevated post-breakout. Preferred approaches:
Spot accumulation on successful support holds or controlled pullbacks.
Tight risk management on leveraged positions — avoid over-sizing in this range.
Grid / range strategies between $83k–$86.5k while waiting for directional resolution.
Gate Community — How are you positioned?
Accumulating spot on dips into support?
Running strict risk-managed leverage?
Deploying grid bots in the current consolidation range?
Drop your charts, levels, and bias below. Let’s discuss.
#Bitcoin $BTC #GateMoneyOfficiallyLaunches #USSeptemberJobs29K
BTC-0.83%
IBIT-0.98%
#USSeptemberJobs29K — Labor Market Cooling vs. Sticky Inflation: Macro Playbook for BTC and ETH
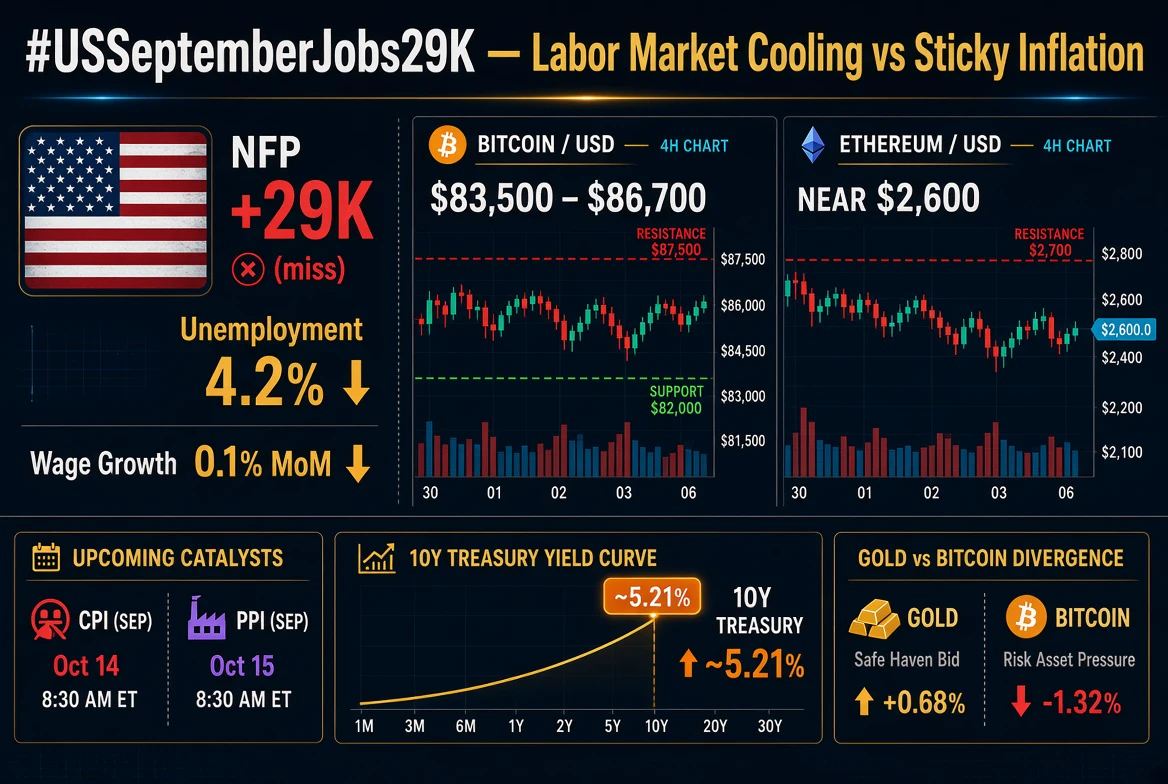
The U.S. Labor Department's September Nonfarm Payroll (NFP) report delivered a sharp macroeconomic shock to global risk assets. Nonfarm payrolls expanded by just 29,000 jobs—substantially missing consensus estimates of roughly 90,000—while the national unemployment rate ticked upward from 4.1% to 4.2%. Downward revisions removed 29,000 jobs from August (adjusted from 162,000 to 133,000) and subtracted approximately 60,000 positions across prior months.
Concurrently, Average Hourly Earnings rose a m
BlackoutCryptoBoy
#USSeptemberJobs29K — Labor Market Cooling vs. Sticky Inflation: Macro Playbook for BTC and ETH
The U.S. Labor Department's September Nonfarm Payroll (NFP) report delivered a sharp macroeconomic shock to global risk assets. Nonfarm payrolls expanded by just 29,000 jobs—substantially missing consensus estimates of roughly 90,000—while the national unemployment rate ticked upward from 4.1% to 4.2%. Downward revisions removed 29,000 jobs from August (adjusted from 162,000 to 133,000) and subtracted approximately 60,000 positions across prior months.
Concurrently, Average Hourly Earnings rose a modest 0.1% month-over-month (3.0% YoY), signaling a simultaneous deceleration in both wage growth and labor participation momentum.
Macro Dynamics & Treasury Yield Friction
While a weakening labor market typically fuels dovish monetary policy expectations, the cross-asset price action revealed underlying structural friction:
Treasury Yield Reversal: The Benchmark 10-Year U.S. Treasury yield spiked downward by ~8 basis points toward 5.15% following the NFP release before aggressively rebounding toward 5.21%. The 2-Year yield followed a similar path, recovering toward 4.82%, while the 30-Year yield anchored near 5.62%.
The Stagflationary Trap: Long-term yields holding above 5.00% indicate that debt markets remain heavily concerned about persistent inflation (August CPI at 3.4% YoY; PPI elevated at 5.4% YoY). As long as risk-free yields offer competitive real returns, high-beta crypto assets face persistent allocation headwinds.
* Gold vs. Bitcoin Divergence: Gold demonstrated superior capital preservation, rallying toward $4,223/oz and holding its structural gains, whereas Bitcoin's initial liquidity-driven spike above $86,700 was met with heavy overhead sell orders, driving prices back into range parameters.
Technical Market Structure & Strategic Key Levels
===================================================================================
ASSET RESISTANCE 2 RESISTANCE 1 CURRENT PIVOT SUPPORT 1 SUPPORT 2
===================================================================================
Bitcoin $87,500 - $90,000 $85,300 - $85,500 $84,000 $83,500 - $83,800 $82,000 - $82,500
Ethereum $2,725 - $2,760 $2,680 - $2,700 $2,600 $2,590 - $2,610 $2,550 - $2,570
===================================================================================
Bitcoin ($BTC ) Technical Analysis
Range Dynamics: BTC continues to consolidate between $83,500 and $86,700. A sustained daily close above $87,500 is required to confirm a structural breakout toward the psychological $90,000 target.
Downside Liquidity Risks: Losing the $83,500 support base exposes the major institutional demand zone between $82,000 and $83,000. A failure to defend $82,000 would invalidate the mid-term bullish structure.
Ethereum ($ETH ) Relative Weakness
Altcoin Health Benchmark: ETH remains constrained near $2,600, significantly underperforming BTC. Reclaiming $2,680–$2,700 is the immediate operational requirement for short-term buyers.
Systemic Impact: Until ETH establishes a clear daily close above its key moving averages ($2,725–$2,760 zone), broad altcoin exposure carries elevated directional risk.
Key Macro Catalysts & Playbook
The focus shifts directly to upcoming inflation prints and federal policy decisions:
Upcoming Inflation Data: September CPI (October 14) and PPI (October 15) serve as the ultimate directional triggers for Q4 digital asset liquidity.
Bullish Scenario (Cooling Inflation): A CPI print coming in under expectations paired with 10-Year Treasury yields dropping back below 5.00% provides the macro clearance required for BTC to push past $87,500 toward $90,000.
Bearish Scenario (Sticky Inflation): A hotter-than-expected CPI print will keep bond yields elevated, potentially forcing a breakdown below $83,500 and driving a liquidity sweep down to $82,000.
Strategic Trading Blueprint
Patient Execution: Avoid initiating high-leverage market entries within the middle of the $84,000 range.
Key Triggers: Look for high-volume spot absorption around the $82,000–$83,000 support cluster for long accumulation, or trade momentum on a confirmed close above $87,500.
Macro Monitor: Track the 10-Year Treasury yield as a leading indicator—yield expansion above 5.25% demands tight risk management across all crypto positions.
#ShareWeekly #PlanYourTradesThisWeek #USSeptemberJobs29K
repost-content-media
BTC-0.83%
ETH-1.80%
#GateIdleEarnAddsUSD1UpTo8.16APR
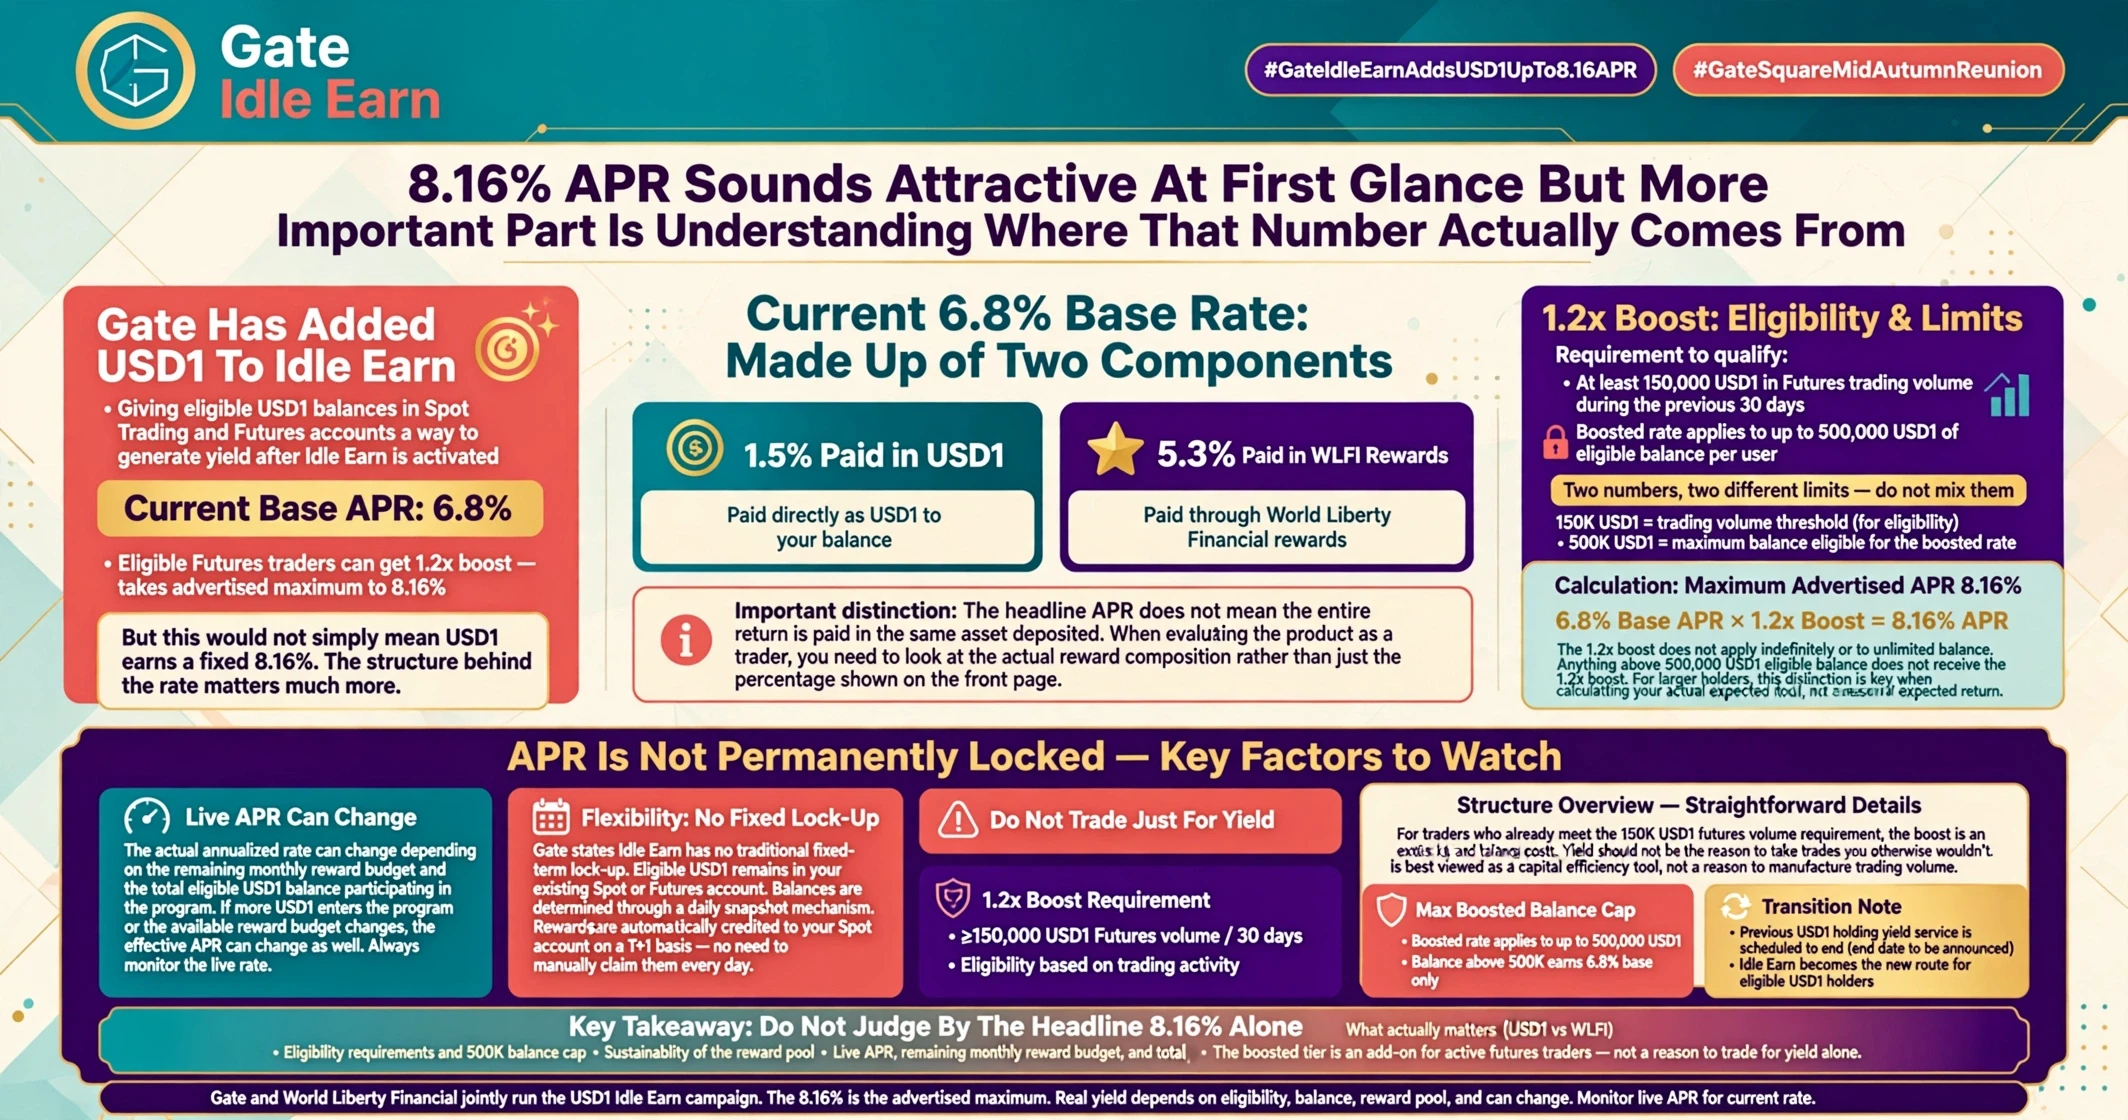
8.16% APR sounds attractive at first glance, but I think the more important part is understanding where that number actually comes from.
Gate has added USD1 to Idle Earn, giving eligible USD1 balances in Spot/Trading and Futures accounts a way to generate yield after Idle Earn is activated. The current base APR is 6.8%, while eligible futures traders can get a 1.2× boost that takes the advertised maximum to 8.16%. But I would not simply read this as “USD1 earns a fixed 8.16%.” The structure behind the rate matters much more.
The current 6.8% base rate is made
MrFlower_XingChen
#GateIdleEarnAddsUSD1UpTo8.16APR
8.16% APR sounds attractive at first glance, but I think the more important part is understanding where that number actually comes from.
Gate has added USD1 to Idle Earn, giving eligible USD1 balances in Spot/Trading and Futures accounts a way to generate yield after Idle Earn is activated. The current base APR is 6.8%, while eligible futures traders can get a 1.2× boost that takes the advertised maximum to 8.16%. But I would not simply read this as “USD1 earns a fixed 8.16%.” The structure behind the rate matters much more.
The current 6.8% base rate is made up of two different components: 1.5% is paid in USD1, while another 5.3% comes through WLFI rewards. That distinction is important because the headline APR does not mean the entire return is being paid in the same asset you deposited. If you are evaluating the product as a trader, you need to look at the actual reward composition rather than stopping at the percentage shown on the front page.
The 1.2× boost also has a specific requirement. To qualify, users need at least 150,000 USD1 in futures trading volume during the previous 30 days. This is an activity requirement, not a minimum USD1 balance. The boosted rate can then apply to a maximum of 500,000 USD1 of eligible balance per user. So the two numbers should not be mixed together: 150K USD1 is the trading-volume threshold, while 500K USD1 is the maximum balance eligible for the boosted rate.
That makes the calculation much easier to understand.
If you qualify for the boost, the maximum advertised APR is 8.16%, but that boosted rate does not apply indefinitely to an unlimited balance. Anything above the 500K USD1 eligible balance does not receive the 1.2× boost. For larger holders, this distinction becomes particularly important when calculating the actual expected return.
There is another part I would pay attention to before treating the current APR as a long-term yield. Gate states that the actual annualized rate can change depending on the remaining monthly reward budget and the total eligible USD1 balance participating in the program. In other words, 8.16% should not be treated as a permanently locked rate. The live APR is the number that matters.
This is probably the biggest detail that can get lost behind the headline.
If more USD1 enters the program, or if the available reward budget changes, the effective APR can change as well. So instead of checking the product once and assuming the current percentage will remain unchanged, I would keep an eye on the live rate, remaining reward budget and total participating balance.
The flexibility is another interesting part. Gate says Idle Earn does not use a traditional fixed-term lock-up. Eligible USD1 can remain within the user's existing account structure, while qualifying balances are determined through the daily snapshot mechanism. Rewards are automatically credited to the Spot account on a T+1 basis, so there is no need to manually claim them every day.
For traders who already keep unused USD1 on the platform, that changes the equation a little. Instead of leaving eligible capital completely idle, there is now a mechanism through which that balance can potentially generate rewards while remaining within the existing account setup.
But I would separate that from the futures-volume requirement.
If someone is already trading enough futures volume to qualify for the 1.2× boost, the additional yield can be viewed as an extra benefit attached to capital they were already holding. But deliberately trading futures just to reach the 150K volume threshold is a completely different decision. Trading activity carries its own risks and costs, so the yield should not be the reason to take trades that otherwise would not make sense.
That is why I think the product is more interesting when viewed as a capital-efficiency tool rather than simply an “8.16% APR” promotion.
There is also a transition happening with USD1 on Gate. The previous USD1 holding-yield service is scheduled to end, although Gate has said the exact end date is still to be announced. That means Idle Earn is becoming particularly relevant for eligible USD1 holders who want another route to earn on their balances after the previous service ends.
Gate and World Liberty Financial are jointly running this USD1 Idle Earn campaign, and the reward structure reflects that relationship because part of the current base yield is paid through WLFI rewards rather than entirely in USD1.
So when I break the whole thing down, the structure is actually pretty straightforward:
6.8% current base APR.
1.5% paid in USD1.
5.3% paid in WLFI rewards.
1.2× boost for users with at least 150K USD1 futures trading volume over the previous 30 days.
The boosted rate applies to up to 500K USD1 of eligible balance.
That produces the advertised maximum of 8.16% APR.
And the actual APR can change based on the reward budget and participating balance.
That last point is the one I would keep coming back to.
Yield products should never be judged only by the highest number displayed in the headline. The composition of the reward, eligibility requirements, balance limits and sustainability of the reward pool all matter. In this case, the difference between earning 6.8% and seeing an advertised maximum of 8.16% comes with conditions that traders should understand before making any decision.
For me, the interesting part is the combination of idle capital and active trading. Someone who already meets the futures requirement can potentially make their eligible USD1 balance productive without committing it to a traditional fixed-term product. But someone who does not naturally trade enough futures volume should not confuse the yield opportunity with a reason to manufacture trading volume.
Over the next few weeks, the numbers I would personally watch are simple: the live APR, the remaining monthly reward budget, the total eligible USD1 balance, how much of the return is being paid in USD1 versus WLFI, and whether the boosted tier continues to provide meaningful additional value.
Because the headline is easy to remember:
8.16% APR.
But the useful information is everything behind it.
The real question is not simply how high the advertised rate is. It is how the rate is generated, who qualifies for it, how much balance receives the boost, what form the rewards take, and how the rate changes as the campaign develops.
That is the part worth understanding before putting idle capital to work.
#GateSquareMidAutumnReunion
$BTC
$GT
$SOL
repost-content-media
USD1+0.00%
WLFI-0.01%
BTC-0.83%
GT-1.15%
SOL-1.96%
#USSeptemberCompositePMISurgesTo58.4
The U.S. economy just sent markets a message that Bitcoin traders should not ignore.
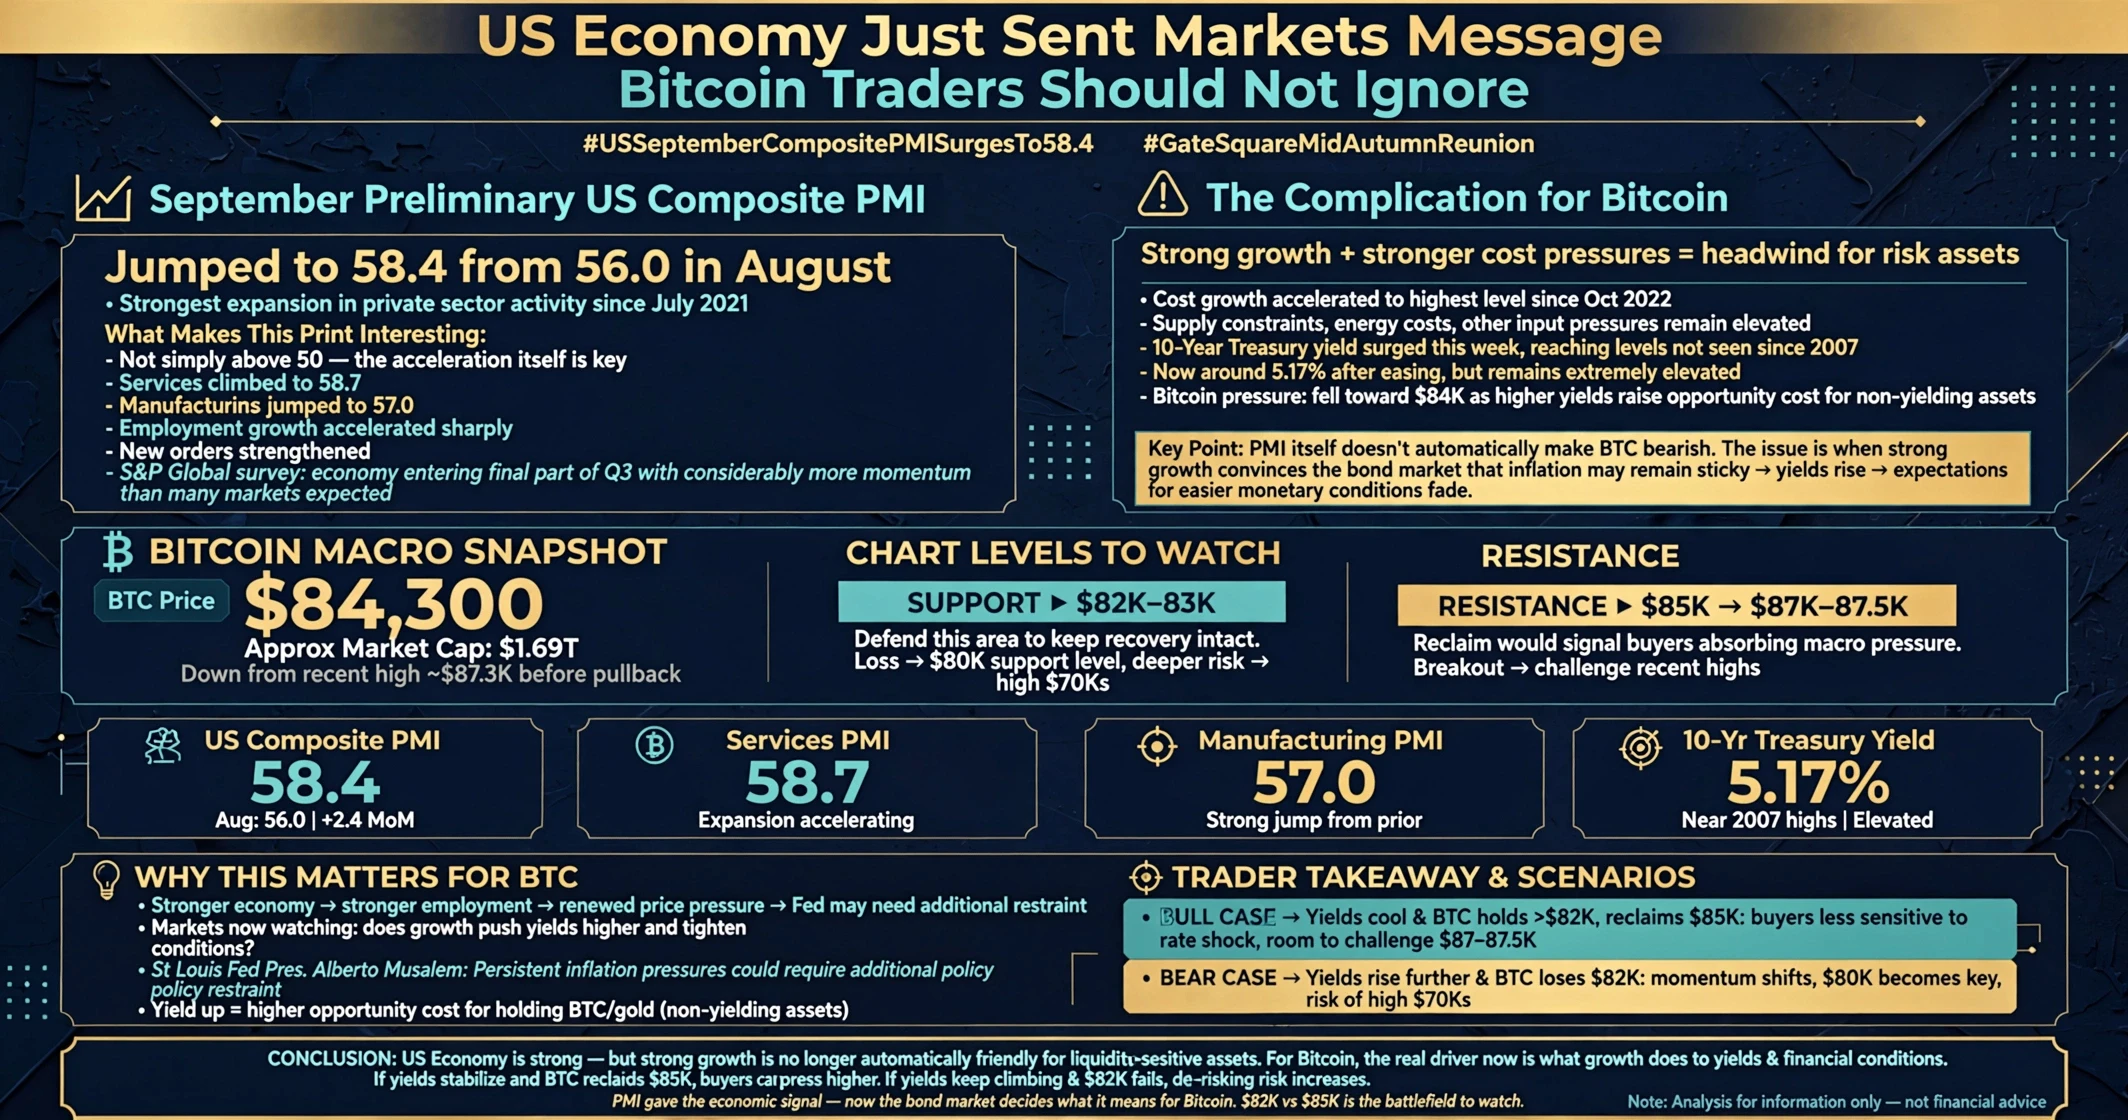
September’s preliminary U.S. Composite PMI jumped to 58.4 from 56.0 in August, marking the strongest expansion in private-sector activity since July 2021. What makes this print interesting is not simply that it is above 50. The acceleration itself is important. Services climbed to 58.7, manufacturing jumped to 57.0, employment growth accelerated sharply, and new orders strengthened. S&P Global’s survey is pointing to a U.S. economy entering the final part of Q3 with consid
MrFlower_XingChen
#USSeptemberCompositePMISurgesTo58.4
The U.S. economy just sent markets a message that Bitcoin traders should not ignore.
September’s preliminary U.S. Composite PMI jumped to 58.4 from 56.0 in August, marking the strongest expansion in private-sector activity since July 2021. What makes this print interesting is not simply that it is above 50. The acceleration itself is important. Services climbed to 58.7, manufacturing jumped to 57.0, employment growth accelerated sharply, and new orders strengthened. S&P Global’s survey is pointing to a U.S. economy entering the final part of Q3 with considerably more momentum than many markets were expecting.
Normally, strong economic growth sounds like good news for risk assets. But markets do not trade the economy in isolation. They trade the reaction that economic strength creates in interest rates, Treasury yields, the dollar and liquidity. That is where this PMI becomes much more complicated for Bitcoin.
The biggest issue is that growth is accelerating at the same time as cost pressures are becoming stronger. S&P Global reported that U.S. cost growth accelerated to its highest level since October 2022, while supply constraints, energy costs and other input pressures remained elevated. So we are not looking at a simple “strong growth = bullish markets” situation. We are looking at strong growth + stronger employment + renewed price pressure. That combination can make the Federal Reserve's job considerably harder.
And the bond market has already reacted.
The U.S. 10-year Treasury yield moved sharply higher this week, reaching levels not seen since 2007. It later eased to around 5.17%, but the important part is that yields remain extremely elevated. Bitcoin also came under pressure after the PMI release, falling toward the $84K area as higher yields increased the opportunity cost of holding non-yielding assets.
This is the part I think traders sometimes miss.
The PMI itself does not automatically make BTC bearish. Bitcoin can rise during periods of strong economic growth. The problem begins when strong growth convinces the bond market that inflation may remain sticky, which then pushes yields higher and reduces expectations for easier monetary conditions.
That is exactly why I would watch the 10-year yield alongside BTC, rather than looking at the PMI number by itself.
BTC is currently hovering around $84K, after recently reaching close to $87.3K before pulling back. The market is now trying to digest a combination of strong U.S. data, elevated Treasury yields and still-positive crypto momentum. CoinDesk data currently places BTC around $84.3K with a market capitalization near $1.69T.
From a chart perspective, I would keep the levels simple.
The first area I want to see BTC defend is around $83K–$82K. As long as buyers continue protecting that region, the recent recovery structure is still alive. Above that, $85K is the immediate psychological barrier, followed by the recent $87K–$87.5K area. A clean reclaim of that zone would tell me that buyers are absorbing the macro pressure rather than simply reacting to it.
But if Treasury yields continue pushing higher and BTC loses $82K with momentum, the picture changes. In that situation, $80K becomes an important psychological level, while a deeper correction could bring the high-$70Ks back into focus.
This is why I would not chase BTC simply because the U.S. economy is strong.
At the same time, I would not automatically short Bitcoin just because PMI came in hot.
The better question is whether the market can absorb the macro pressure.
If yields stabilize around current levels while BTC holds above $82K and starts reclaiming $85K, that would suggest that crypto buyers are becoming less sensitive to the rate shock. If yields continue climbing while BTC repeatedly fails at resistance, then the macro headwind becomes much more difficult to ignore.
Gold is facing a similar equation. Strong economic activity can support demand, but rising yields increase the opportunity cost of holding a non-yielding asset. That means the direction of real yields and the dollar can become more important than the PMI headline itself.
There is also a broader Federal Reserve angle here. St. Louis Fed President Alberto Musalem recently argued that persistent inflation pressures could require additional policy restraint, while the Fed's preferred inflation gauge remained above the 2% target. His comments were not a policy decision, but they show why stronger economic data combined with renewed cost pressure can influence the rate debate.
For Bitcoin traders, I think the next phase is going to be about liquidity versus momentum.
Bitcoin has already demonstrated that buyers are willing to push price higher. The question now is whether they can continue doing that while Treasury yields remain elevated. If they can, the market could interpret the strong economy as evidence of resilient risk appetite rather than an immediate threat. If they cannot, the same economic strength could become a reason for another round of de-risking.
So my macro dashboard from here is simple:
U.S. Composite PMI: 58.4.
Services PMI: 58.7.
Manufacturing PMI: 57.0.
10Y Treasury yield: around 5.17%.
BTC: around $84K.
BTC resistance: $85K → $87K–$87.5K.
BTC support: $82K–$83K → $80K.
These numbers tell me one thing: the U.S. economy is strong, but strong growth is no longer automatically friendly for liquidity-sensitive assets.
For BTC, the next move will probably depend less on whether the economy is growing and more on what that growth does to yields and financial conditions.
If yields cool and BTC reclaims $85K, buyers have room to challenge the recent highs again.
If yields rise further and BTC loses $82K, I would rather wait for a new support structure than blindly buy the dip.
The PMI gave us the economic signal.
Now the bond market has to tell us what that signal actually means for Bitcoin.
And for me, $82K vs. $85K is the battlefield to watch.
#GateSquareMidAutumnReunion
$0G
$US
repost-content-media
BTC-0.83%
#AltcoinsSeeSharpPullback
Today’s Gate market leaderboard is showing something interesting: the strongest moves are not concentrated in one single narrative. We have B3 up around 32.4%, AURORA 28.9%, QNT 27.4%, ONDO 25.5%, RHEA 23.5%, XPL 22.6%, ARK 17.6%, ETN 17.5%, EDGE 17.3%, and PEAQ 15.9% over 24 hours. That is a wide spread of strong performers, and to me the bigger signal is not simply which coin is number one. It is that speculative appetite is moving through several parts of the altcoin market at the same time. Gate’s current Altcoin Season Index is around 52/100, which is almost per
MrFlower_XingChen
#AltcoinsSeeSharpPullback
Today’s Gate market leaderboard is showing something interesting: the strongest moves are not concentrated in one single narrative. We have B3 up around 32.4%, AURORA 28.9%, QNT 27.4%, ONDO 25.5%, RHEA 23.5%, XPL 22.6%, ARK 17.6%, ETN 17.5%, EDGE 17.3%, and PEAQ 15.9% over 24 hours. That is a wide spread of strong performers, and to me the bigger signal is not simply which coin is number one. It is that speculative appetite is moving through several parts of the altcoin market at the same time. Gate’s current Altcoin Season Index is around 52/100, which is almost perfectly balanced rather than showing an extreme altcoin phase.
B3 is currently leading the board with roughly a 32.4% 24-hour move, trading around $0.00091. A move of this size immediately puts B3 into momentum territory, but it also creates a very different risk profile from an altcoin that is up 5–10%. After a 30%+ daily expansion, I would not treat the current price as a comfortable chase zone. The first thing I would want to see is whether buyers can hold a meaningful portion of today’s breakout rather than giving the entire move back. If B3 consolidates near the breakout instead of immediately retracing, that would show stronger demand. If the candle starts losing most of its gains, the move becomes much more vulnerable to a fast reversal.
AURORA is next, up around 28.9% at $0.0855. This is another clear momentum setup. The important level now is not simply the percentage gain but whether AURORA can turn the area around the current price into support. After such a fast move, a healthy continuation would normally require consolidation rather than another vertical candle immediately. If buyers keep defending the breakout zone, the trend can remain constructive. But if price falls sharply back through the area where the breakout started, I would consider that a warning that today's move was driven more by short-term speculation than sustained accumulation.
QNT is showing one of the more notable moves among the larger names on the board, trading around $90.57 after gaining approximately 27.4%. The psychological $100 level naturally becomes important after a move like this. But I would not assume that reaching $100 is guaranteed simply because momentum is strong. The cleaner setup would be a consolidation above the current breakout area followed by another attempt higher. If QNT loses its breakout structure, the first thing I would watch is whether buyers step back in quickly or whether the market starts unwinding the entire daily move.
Then there is ONDO, up around 25.5% at $0.5259. This one catches my attention because ONDO is already a well-known RWA-related token, so its move is easier to connect with the broader narrative around tokenized financial assets. The important psychological area from here is $0.50, because round numbers often become useful reference points after a strong move. Holding above that zone would keep the short-term structure constructive, while a failure to maintain it could turn the breakout into a false move. For me, ONDO is one of the names where I would rather watch the retest than chase the first expansion candle.
RHEA has gained approximately 23.5% and is trading near $0.0723. This is the kind of move where volatility needs to be respected. A 20%+ daily candle can create a lot of FOMO, especially when traders see the leaderboard changing rapidly. But the stronger confirmation would come from price building a new range above today's breakout rather than simply extending vertically. If RHEA starts making higher lows after the initial surge, that would be a healthier momentum structure. If it starts printing aggressive lower highs, the risk of a deeper retracement increases.
XPL is around $0.1113, up 22.6%, putting it firmly into today's momentum group. The $0.10 area is now an obvious psychological reference point. Staying above that level would keep the recent breakout structure easier to defend, while losing it after a failed breakout would weaken the setup. I would particularly watch whether the market can turn the previous resistance into support. That is often more useful than trying to predict the exact top of a fast-moving altcoin.
ARK is trading around $0.1916 after a 17.6% gain. Compared with the coins making 25–30% moves, ARK's advance is slightly less extended, but it is still significant enough to demand caution. The $0.20 psychological level is now close enough to matter. A clean move through $0.20 followed by consolidation would make the breakout structure more interesting. A rejection around that level would tell me that sellers are still active. I would rather see price prove that it can hold higher levels than simply assume another green candle is coming.
ETN has gained approximately 17.5% and is trading near $0.00309. Because the nominal price is extremely small, I would avoid judging the move based on the number of decimal places. What matters is percentage movement, liquidity and whether the breakout can hold. A 17% daily move can look exciting on a leaderboard, but the same volatility can work in both directions. For ETN, the key question is whether today's buyers remain active after the initial momentum cools.
EDGE is also up around 17.3%, trading near $0.0985, putting the psychological $0.10 level directly in focus. This is one of those situations where a round-number breakout can attract another wave of momentum traders. But again, the important part is acceptance above the level. A quick wick above $0.10 followed by a return below it would be less convincing than a sustained move where $0.10 becomes support.
Finally, PEAQ is up approximately 15.9% at $0.04286. It is the smallest gain among today's top ten, but that can actually make the setup interesting from a momentum perspective because it is not as extended as the 30% movers. The question is whether the current move develops into a higher-timeframe trend or remains a one-day expansion. I would watch for a higher low after the initial rally before becoming aggressive.
Looking at all ten together, I see an important distinction: a leaderboard is not the same thing as a buy list.
When an altcoin is already up 15%, 20% or 30% in one day, the risk/reward can change dramatically. The trader who enters after the move has a completely different position from the trader who bought before the breakout. That is why I would not chase every green candle simply because it appears at the top of Gate's gainers list.
The broader market context matters too. Gate currently shows the Altcoin Season Index around 52/100, while BTC is around the mid-$84K area. That tells me the market is showing meaningful altcoin participation, but the data does not yet describe an extreme, one-directional altseason environment.
My approach from here would be simple: let the first impulse happen, then watch the retest.
For B3 and AURORA, after moves above 28%, I would be especially careful about chasing. QNT and ONDO have stronger psychological areas around $100 and $0.50 respectively. XPL needs to prove that the $0.10 area can become support. ARK and EDGE have $0.20 and $0.10 as obvious psychological reference points. RHEA and PEAQ need to show that today's momentum can turn into a sustainable structure, while ETN needs to prove that the breakout can survive after the initial excitement fades.
The real opportunity is not necessarily finding the coin that is already greenest.
It is finding the one that holds its breakout after the first wave of buyers takes profit.
That is where I would be watching the Gate leaderboard next.
Top gainers today:
B3 → +32.4%
AURORA → +28.9%
QNT → +27.4%
ONDO → +25.5%
RHEA → +23.5%
XPL → +22.6%
ARK → +17.6%
ETN → +17.5%
EDGE → +17.3%
PEAQ → +15.9%
Strong momentum is visible across the board, but after a move this large, capital protection matters more than FOMO.
My strategy would be to wait for confirmation, identify the new support zone, and only then decide whether the breakout has enough strength to continue.
Today’s biggest gainer might get the headline.
Tomorrow’s winner will be the coin that can hold the gains.
#GateEuropeAchievesPCIDSSLevel1Certification
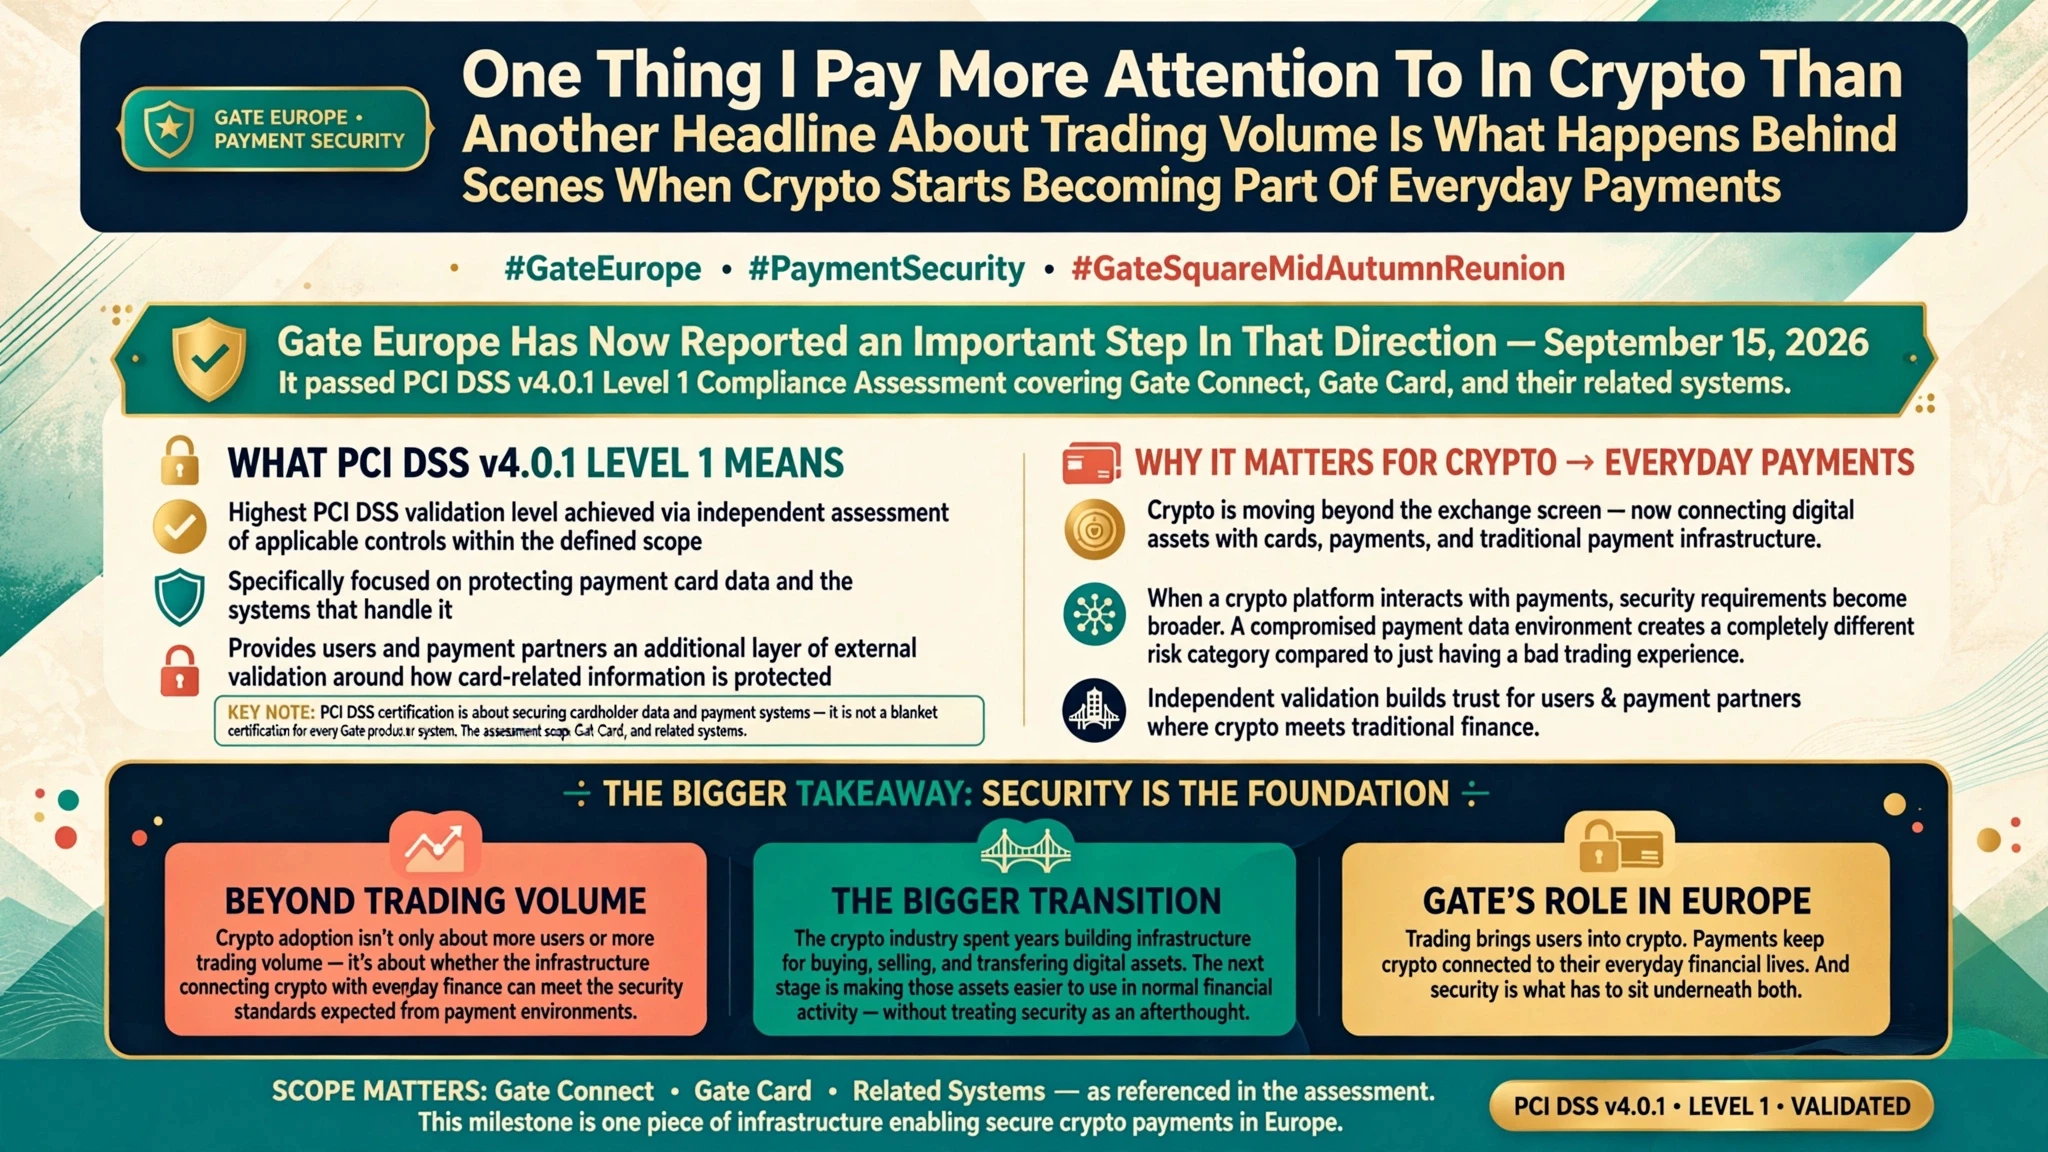
One thing I pay more attention to in crypto than another headline about trading volume is what happens behind the scenes when crypto starts becoming part of everyday payments.
Gate Europe has now reported an important step in that direction: on September 15, 2026, it passed the PCI DSS v4.0.1 Level 1 compliance assessment, covering Gate Connect, Gate Card and their related systems.
For me, the important part isn't simply the word “certification.” PCI DSS is specifically focused on protecting payment-card data and the systems that handle it. Reachin
MrFlower_XingChen
#GateEuropeAchievesPCIDSSLevel1Certification
One thing I pay more attention to in crypto than another headline about trading volume is what happens behind the scenes when crypto starts becoming part of everyday payments.
Gate Europe has now reported an important step in that direction: on September 15, 2026, it passed the PCI DSS v4.0.1 Level 1 compliance assessment, covering Gate Connect, Gate Card and their related systems.
For me, the important part isn't simply the word “certification.” PCI DSS is specifically focused on protecting payment-card data and the systems that handle it. Reaching the highest PCI DSS validation level means Gate Europe has gone through an independent assessment of the applicable controls within that defined scope. That gives users and payment partners an additional layer of external validation around how card-related information is protected.
And I think this matters because crypto is gradually moving beyond the exchange screen.
If a user is trading an asset, security is obviously critical. But when a crypto platform starts connecting digital assets with cards, payments and traditional payment infrastructure, the security requirements become even broader. A compromised payment-data environment can create a completely different category of risk from simply having a bad trading experience.
That's why I see this milestone as part of a bigger transition.
The crypto industry spent years building infrastructure for buying, selling and transferring digital assets. The next stage is making those assets easier to use in normal financial activity without treating security as an afterthought.
Gate Europe's PCI DSS v4.0.1 Level 1 assessment doesn't mean every Gate product or every system is automatically covered by the certification. The reported scope matters: Gate Connect, Gate Card and related systems are the areas referenced in the assessment. That's an important distinction when evaluating the announcement.
But within that scope, independent validation is meaningful.
For me, the bigger takeaway is simple:
Crypto adoption isn't only about more users or more trading volume.
It's also about whether the infrastructure connecting crypto with everyday finance can meet the security standards expected from payment environments.
Gate is now adding another piece to that infrastructure in Europe.
Trading brings users into crypto.
Payments can keep crypto connected to their everyday financial lives.
And security is what has to sit underneath both.
#GateSquareMidAutumnReunion
repost-content-media
#FlapDistributes22.96MInFees
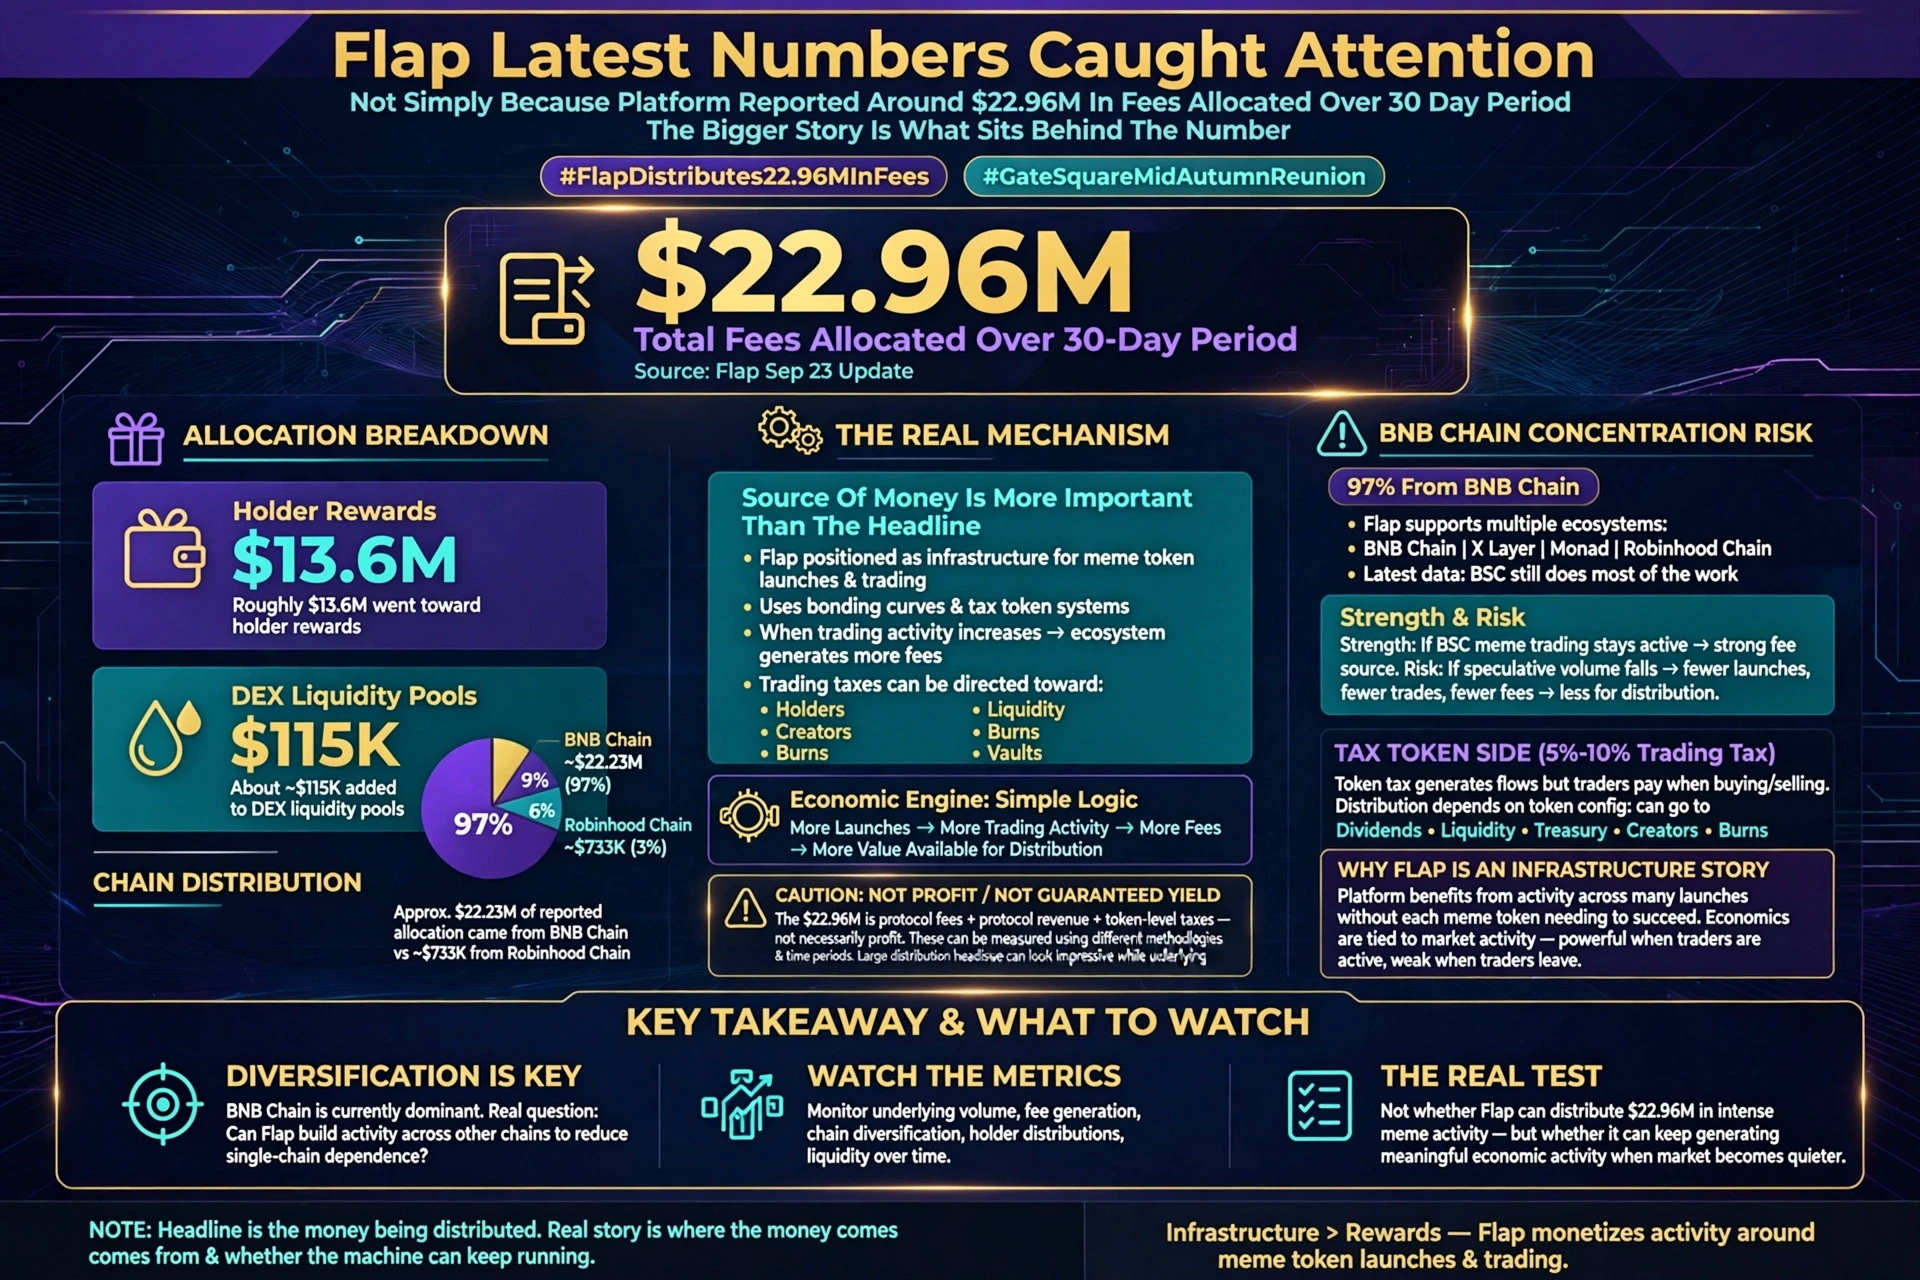
Flap’s latest numbers caught my attention, but not simply because the platform reported around $22.96M in fees allocated over a 30-day period. The bigger story is what sits behind that number. According to Flap’s September 23 update, roughly $13.6M went toward holder rewards, while about $115K was added to DEX liquidity pools. The most interesting detail is where the activity came from: approximately $22.23M of the reported allocation came from BNB Chain, compared with around $733K from Robinhood Chain. That means roughly 97% of the reported allocation was still c
MrFlower_XingChen
#FlapDistributes22.96MInFees
Flap’s latest numbers caught my attention, but not simply because the platform reported around $22.96M in fees allocated over a 30-day period. The bigger story is what sits behind that number. According to Flap’s September 23 update, roughly $13.6M went toward holder rewards, while about $115K was added to DEX liquidity pools. The most interesting detail is where the activity came from: approximately $22.23M of the reported allocation came from BNB Chain, compared with around $733K from Robinhood Chain. That means roughly 97% of the reported allocation was still coming from BNB Chain.
For me, this makes the source of the money much more important than the headline itself. Flap is positioned around the infrastructure of meme-token launches and trading, using mechanisms such as bonding curves and tax-token systems. When trading activity increases, the ecosystem can generate more fees and, depending on how individual tokens are configured, trading taxes can be directed toward holders, creators, liquidity, burns or other vaults. So the basic economic engine is quite simple: more launches and more trading activity can create more fees, which creates more value available for distribution.
But I would be careful about calling the entire $22.96M “profit” or treating it as guaranteed yield. A distribution figure, protocol fees, protocol revenue and token-level taxes are not necessarily the same thing. They can represent different parts of the economic flow and may be measured using different methodologies and time periods. That distinction matters because a large distribution headline can look extremely impressive while the underlying activity generating it remains highly dependent on speculative trading volume.
The BNB Chain concentration is probably the biggest thing I would monitor from here. Flap supports multiple ecosystems, including BNB Chain, X Layer, Monad and Robinhood Chain, but the latest reported distribution shows that BSC is still doing most of the work. That is both the strength of the current model and an obvious concentration risk. If meme trading on BSC remains active, Flap has a strong source of fee-generating activity. But if speculative volume falls sharply, the same mechanism can move in the opposite direction: fewer launches, fewer trades, fewer fees and ultimately less value available for distribution.
The tax-token side also deserves attention. A token carrying a 5% or 10% trading tax can generate significant flows, but traders are paying that tax when they buy or sell. Where the money ultimately goes depends on the specific token's configuration. Some can be directed toward dividends or rewards, while other portions may go toward liquidity, treasury, creators, burns or different vault mechanisms. So I wouldn't look at a large holder-reward number in isolation. I would always ask how much trading activity is required to produce it and whether that activity can remain healthy when the initial hype disappears.
That is why I think Flap is more interesting as an infrastructure story than simply a rewards story. The platform is sitting underneath a highly speculative part of crypto and can potentially benefit from activity across many different launches without needing every individual meme token to become successful. But that also means its economics are closely connected to market activity. When traders are active, the fee engine can become powerful. When traders leave, there is much less activity for the infrastructure to monetize.
The next thing I would watch is diversification. BNB Chain is clearly the dominant source in the latest reported numbers, so the important question isn't whether Flap can produce another large monthly distribution. It's whether the platform can gradually build meaningful activity across other chains and reduce its dependence on a single meme market. If that happens, the business model becomes easier to view as a broader multi-chain infrastructure play rather than simply a beneficiary of one BSC meme cycle.
So my takeaway from the $22.96M figure is straightforward: the number is impressive, but the mechanism behind it matters more. Flap is essentially monetizing activity around meme-token launches and trading, and the current data suggests that BNB Chain is still the main engine driving that activity. I wouldn't treat the rewards as guaranteed passive income. I would watch the underlying volume, fee generation, chain diversification, holder distributions and liquidity over time.
Because ultimately, the real test isn't whether Flap can distribute $22.96M during a period of intense meme activity. The real test is whether it can continue generating meaningful economic activity when the market becomes quieter.
The headline is the money being distributed.
The real story is where that money comes from — and whether the machine generating it can keep running.
#GateSquareMidAutumnReunion
repost-content-media
BNB-1.33%
MON-2.27%
#USSeptemberCompositePMISurgesTo58.4
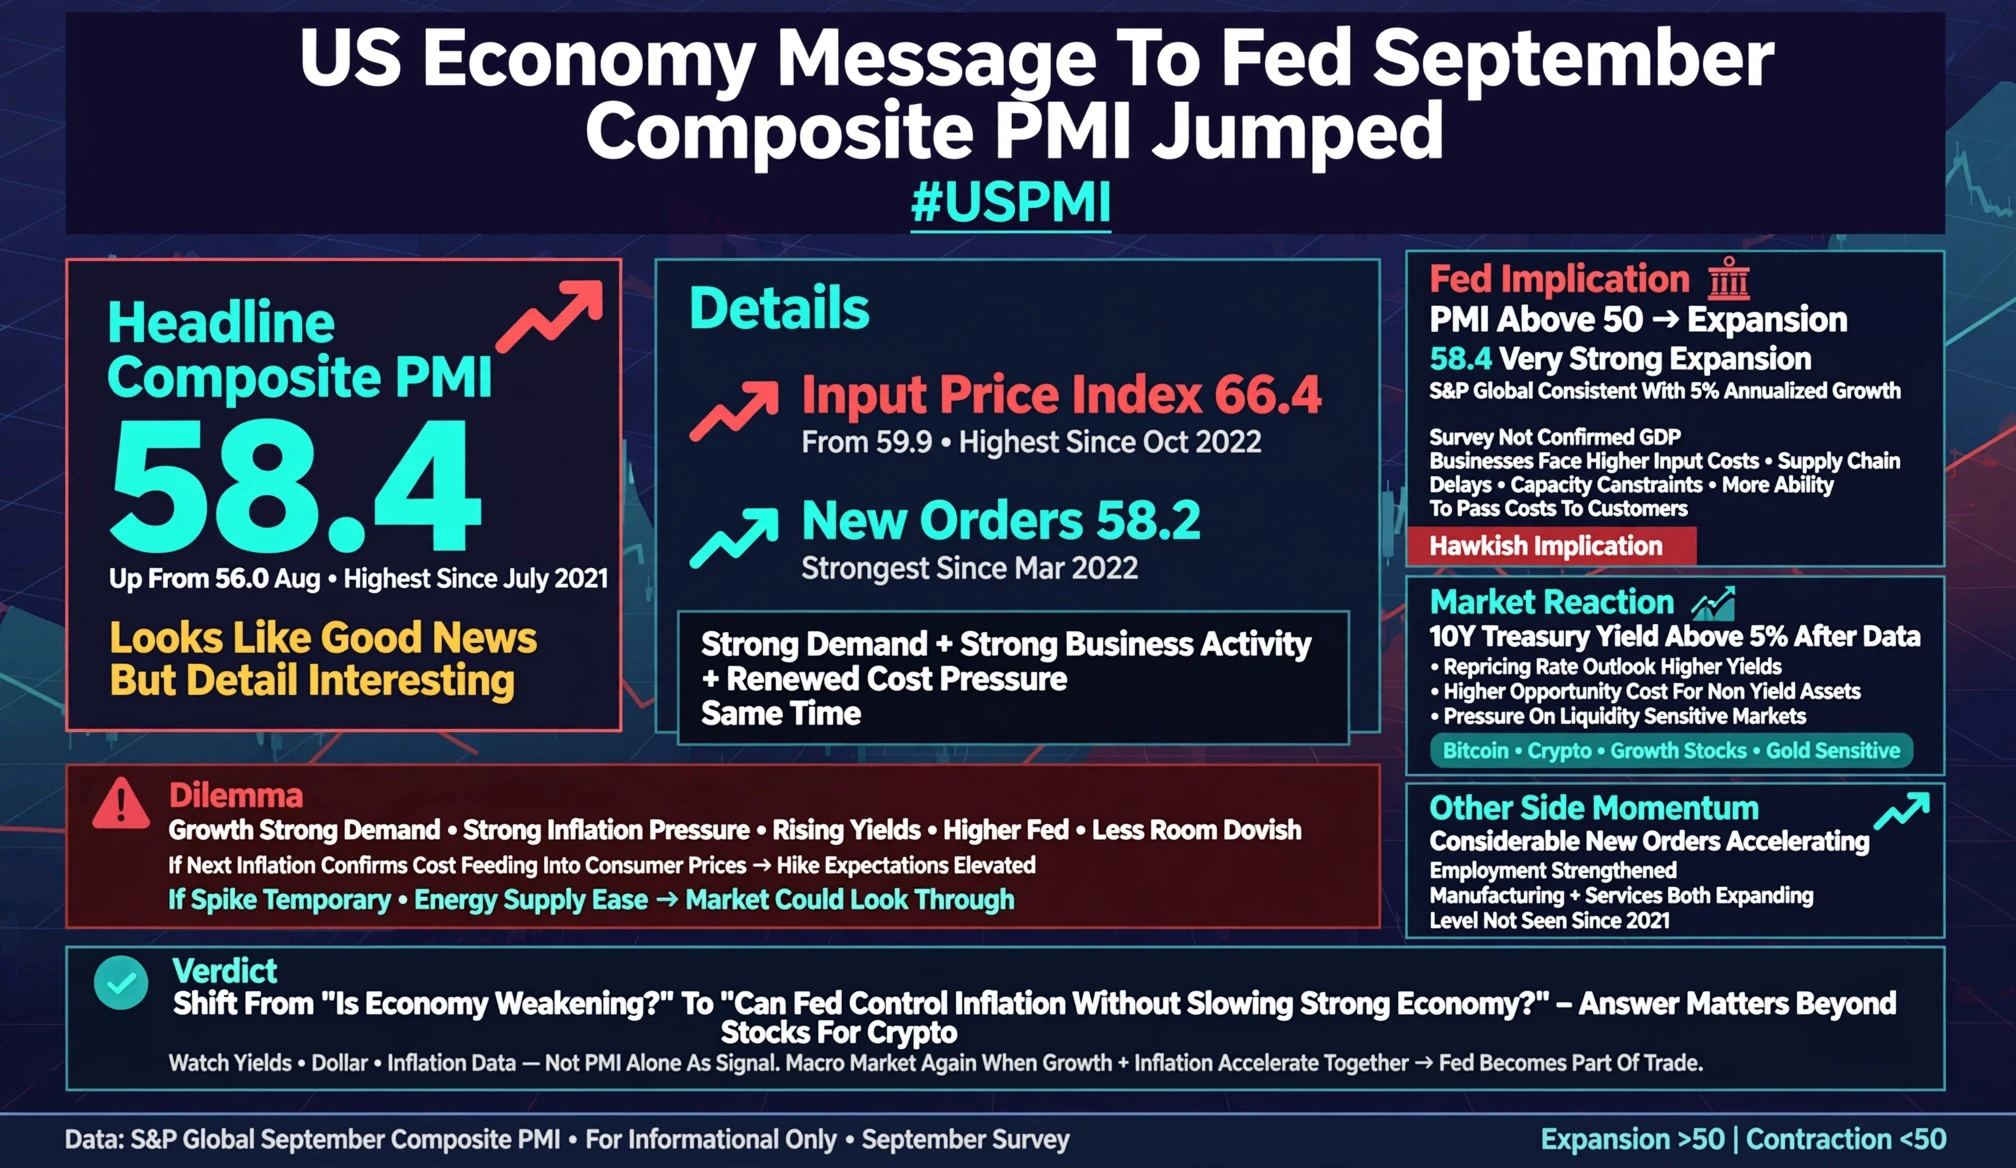
The US economy just sent the Federal Reserve a message it probably did not want to ignore.
September’s US Composite PMI jumped to 58.4, up from 56.0 in August and the highest reading since July 2021.
At first glance, that looks like purely good economic news.
But the detail underneath the headline is where the market reaction becomes interesting.
The input-price index jumped to 66.4 from 59.9, reaching its highest level since October 2022. At the same time, new orders climbed to 58.2, the strongest reading since March 2022.
So the US economy is not simply
MrFlower_XingChen
#USSeptemberCompositePMISurgesTo58.4
The US economy just sent the Federal Reserve a message it probably did not want to ignore.
September’s US Composite PMI jumped to 58.4, up from 56.0 in August and the highest reading since July 2021.
At first glance, that looks like purely good economic news.
But the detail underneath the headline is where the market reaction becomes interesting.
The input-price index jumped to 66.4 from 59.9, reaching its highest level since October 2022. At the same time, new orders climbed to 58.2, the strongest reading since March 2022.
So the US economy is not simply slowing inflation while growth remains healthy.
We are seeing strong demand + stronger business activity + renewed cost pressure at the same time.
That combination matters for the Fed.
A PMI above 50 signals expansion, and 58.4 is a very strong expansion reading. S&P Global said the September data was consistent with economic growth running at around a 5% annualized pace, although that is a survey-based indication rather than confirmed GDP data.
The problem for markets is the inflation side.
Businesses are reporting significantly higher input costs, while supply-chain delays and capacity constraints are also increasing. When demand remains strong and companies face higher costs at the same time, businesses can have more ability to pass those costs through to customers.
That is exactly why this report has a more hawkish implication for monetary policy.
And the Treasury market reacted accordingly.
The 10-year US Treasury yield moved back above 5% following the data, reflecting a repricing of the interest-rate outlook.
For risk assets, this is where things get interesting.
Higher yields increase the opportunity cost of holding assets that do not generate traditional income, while higher expected interest rates can put pressure on liquidity-sensitive markets.
That means Bitcoin, crypto, growth stocks and gold can all become more sensitive to the next round of inflation and Fed expectations.
But I would not automatically turn this into a bearish call.
There is another side to the data:
The US economy is showing considerable momentum.
New orders are accelerating. Employment growth has strengthened. Manufacturing and services are both expanding, and business activity is now at a level not seen since 2021.
So the market is dealing with a difficult combination:
Growth is strong.
Demand is strong.
Inflation pressure is rising.
Treasury yields are moving higher.
The Fed has less room to become dovish.
That is the part I am watching.
If the next inflation readings confirm that September’s jump in business costs is feeding into consumer prices, rate-hike expectations could remain elevated and yields could stay under upward pressure.
But if the input-cost spike proves temporary — particularly if energy and supply-chain pressures ease — then the market could eventually look through this report.
For now, I think the PMI has shifted the conversation away from “Is the US economy weakening?”
and toward a more important question:
“Can the Fed control inflation without having to slow this surprisingly strong economy?”
That answer will matter far beyond the US stock market.
For Bitcoin and crypto traders, I would keep a close eye on Treasury yields, the dollar and upcoming inflation data rather than treating the PMI number alone as a buy-or-sell signal.
This is becoming a macro market again.
And when growth and inflation accelerate together, the Fed — not just the chart — becomes part of the trade.
#GateSquareMidAutumnReunion
repost-content-media
BTC-0.83%
#AltcoinsSeeSharpPullback
Bitcoin pulled back from above $87,000 toward $84,000, and the reaction across altcoins has been much more aggressive.
But looking at today’s market, I don't think every red candle should immediately be called a trend reversal.
The difference between healthy consolidation and a real trend breakdown is what happens next.
The latest CEX data shows just how sharp the rotation has been.
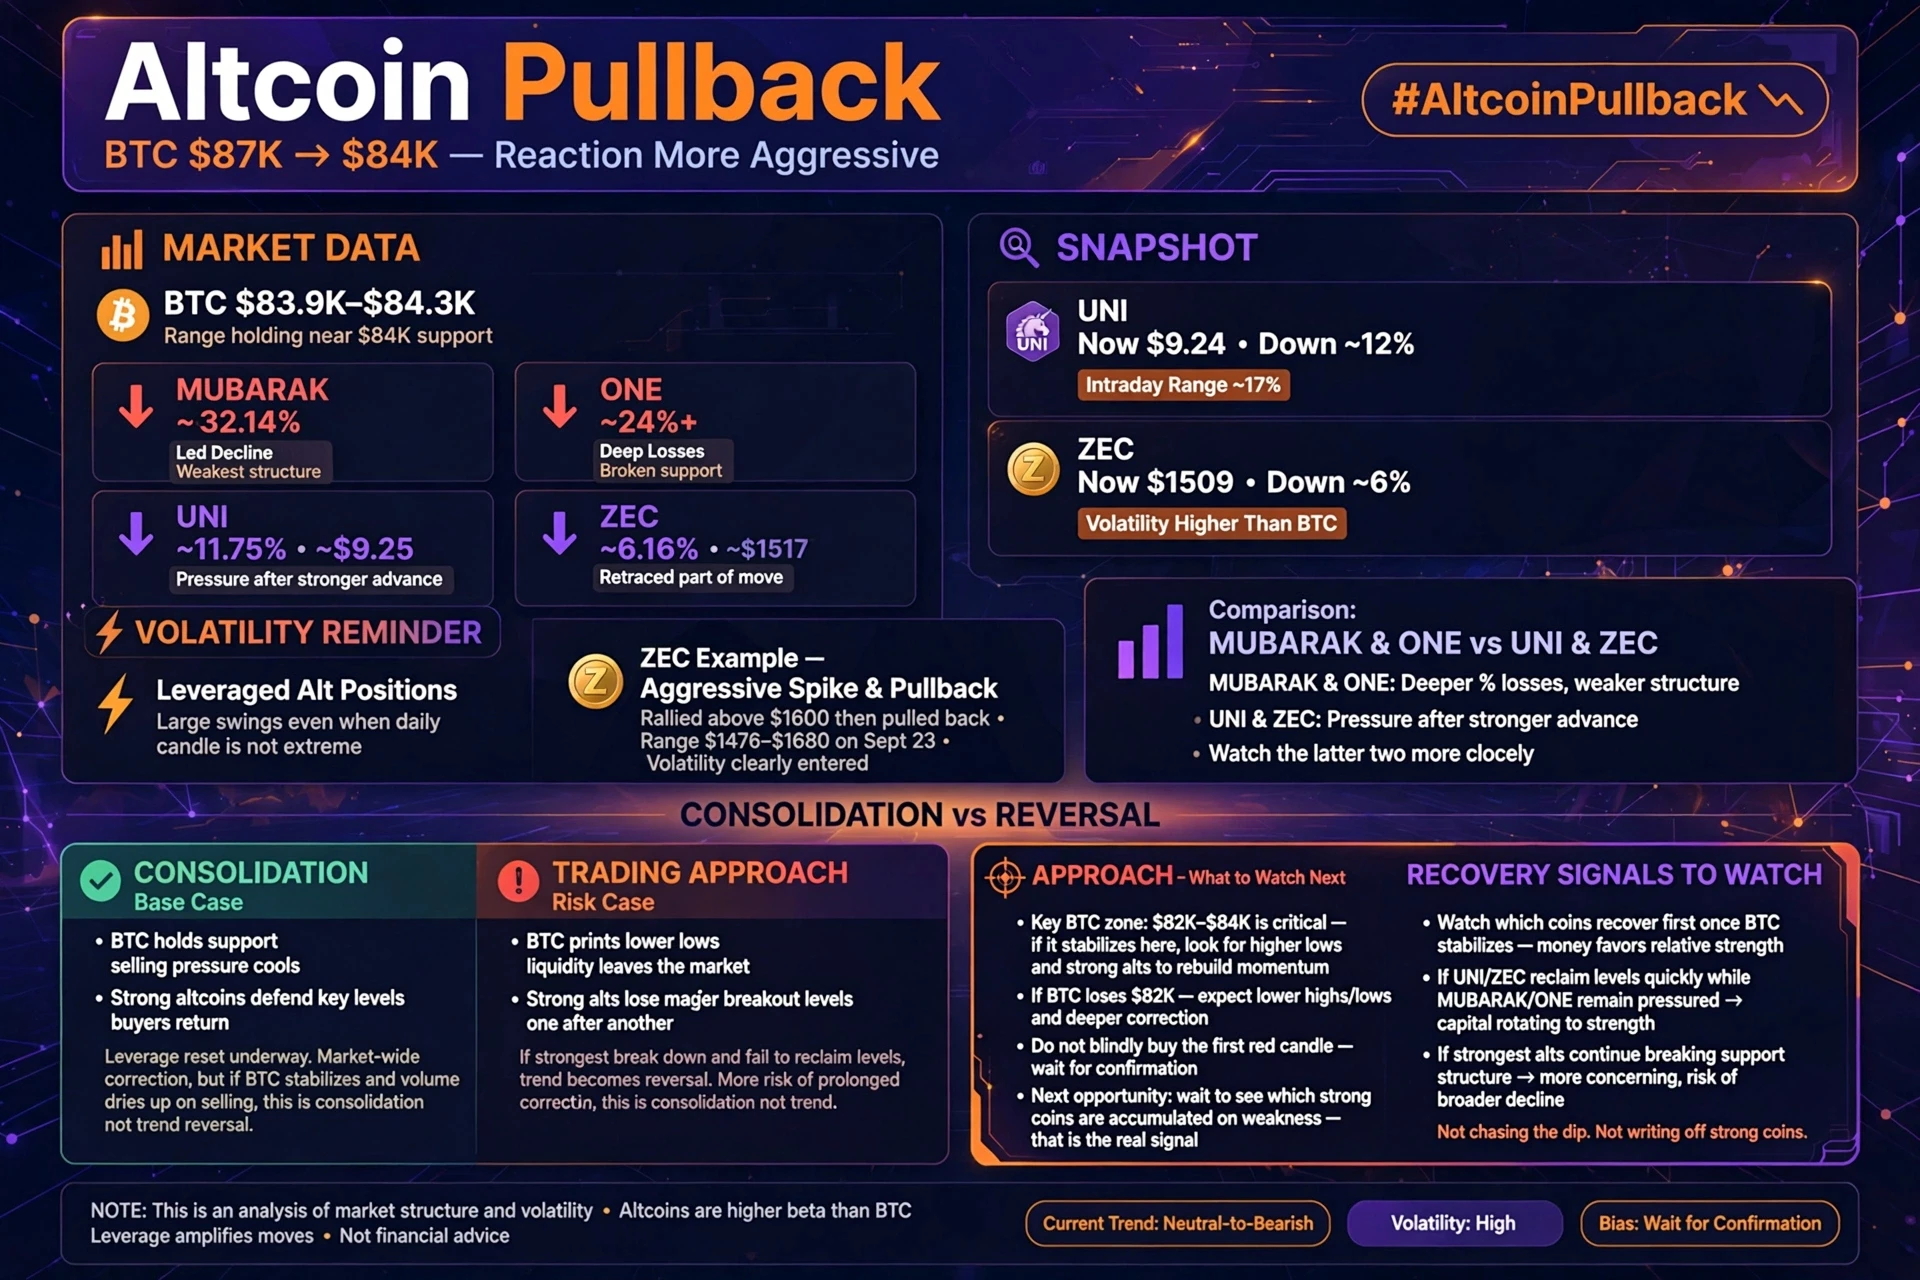
MUBARAK led the decline with a 32.14% drop, while ONE fell more than 24%.
Even some of the strongest performers from the recent move were hit.
UNI dropped around 11.75% to approximately
MrFlower_XingChen
#AltcoinsSeeSharpPullback
Bitcoin pulled back from above $87,000 toward $84,000, and the reaction across altcoins has been much more aggressive.
But looking at today’s market, I don't think every red candle should immediately be called a trend reversal.
The difference between healthy consolidation and a real trend breakdown is what happens next.
The latest CEX data shows just how sharp the rotation has been.
MUBARAK led the decline with a 32.14% drop, while ONE fell more than 24%.
Even some of the strongest performers from the recent move were hit.
UNI dropped around 11.75% to approximately $9.25, while ZEC declined 6.16% to around $1,517 in the reported snapshot.
But there is an important difference between these moves.
MUBARAK and ONE are experiencing much deeper percentage losses, while UNI and ZEC are coming under pressure after much stronger advances.
That is why I am watching the latter two more closely.
UNI is currently around $9.24, down roughly 12% on the latest market snapshot. ZEC is around $1,509, down close to 6%. At the same time, Bitcoin is around $83.9K–$84.3K, depending on the venue and timestamp.
This tells me something important:
Altcoins are still trading with significantly higher volatility than BTC.
Recent market data showed UNI's intraday range reaching roughly 17%, despite its eventual daily loss being much smaller. That is a reminder that leveraged altcoin positions can experience very large swings even when the final daily candle doesn't look extreme.
So is this a buying opportunity?
I would not blindly buy the first red candle.
I would wait for confirmation.
For BTC, the $82K–$84K area is becoming important. If Bitcoin stabilizes there and starts making higher lows again, strong altcoins that have only retraced part of their recent move could begin rebuilding momentum.
But if BTC loses the major support zone and continues printing lower highs and lower lows, then today's altcoin weakness could develop into a deeper correction.
That distinction matters.
A strong coin falling 10% after a powerful rally is not automatically the same thing as a coin losing its entire market structure.
Take ZEC as an example.
ZEC recently went through an extremely aggressive move, reaching above $1,600 before pulling back. Its latest decline is therefore occurring after a major expansion in price. The daily data shows a large range between roughly $1,476 and $1,680 on September 23, which shows how much volatility has entered the market.
UNI is showing a similar question.
The important thing isn't simply that UNI is down 11–12%.
The important question is whether it can hold the structure built during the previous rally.
That is where I would separate consolidation from reversal.
Consolidation: BTC holds support, selling pressure cools, strong alts defend important levels and buyers begin returning.
Reversal: BTC keeps making lower lows, liquidity continues leaving the market, and previously strong alts start losing their major breakout levels one after another.
Right now, I see a market-wide correction and leverage reset, but I don't think the available price action alone is enough to declare that the entire altcoin trend has reversed.
And there is one more thing I would watch closely:
Which coins recover first when BTC stabilizes?
That usually tells us more than the size of today's red candle.
If UNI, ZEC and other recent leaders reclaim lost levels quickly while weaker coins remain under pressure, that would suggest money is still favoring relative strength.
If even the strongest names continue breaking support, then the market structure becomes much more concerning.
So I am not chasing this dip, but I am not writing off the strong coins either.
BTC around $84K is the key piece of the puzzle.
If Bitcoin stabilizes, this could turn into a healthy reset after an aggressive rally.
If Bitcoin loses support and the weakness spreads further, then the strategy needs to change.
For me, the next opportunity is not simply “buy because everything is down.”
It is:
Wait for the market to show which strong coins are actually being accumulated on weakness.
That is where the real signal will be.
#GateSquareMidAutumnReunion
@Gate_Square
repost-content-media
BTC-0.83%
MUBARAK-6.37%
UNI-2.29%
ZEC-6.66%
#CryptoStocksSlipBMNRDownOver4%
Bitcoin is giving the market a reality check after the move above $87K.
The interesting part is not simply that BTC pulled back. It is that the pullback happened at the same time U.S. stocks and crypto-linked equities came under pressure. The Dow, S&P 500 and Nasdaq all finished lower, while the 10-year Treasury yield pushed above 5% after the latest U.S. economic data came in much stronger than expected. That combination matters because when bond yields rise quickly, investors usually become less comfortable paying high prices for risk-sensitive assets.
The Se
MrFlower_XingChen
#CryptoStocksSlipBMNRDownOver4%
Bitcoin is giving the market a reality check after the move above $87K.
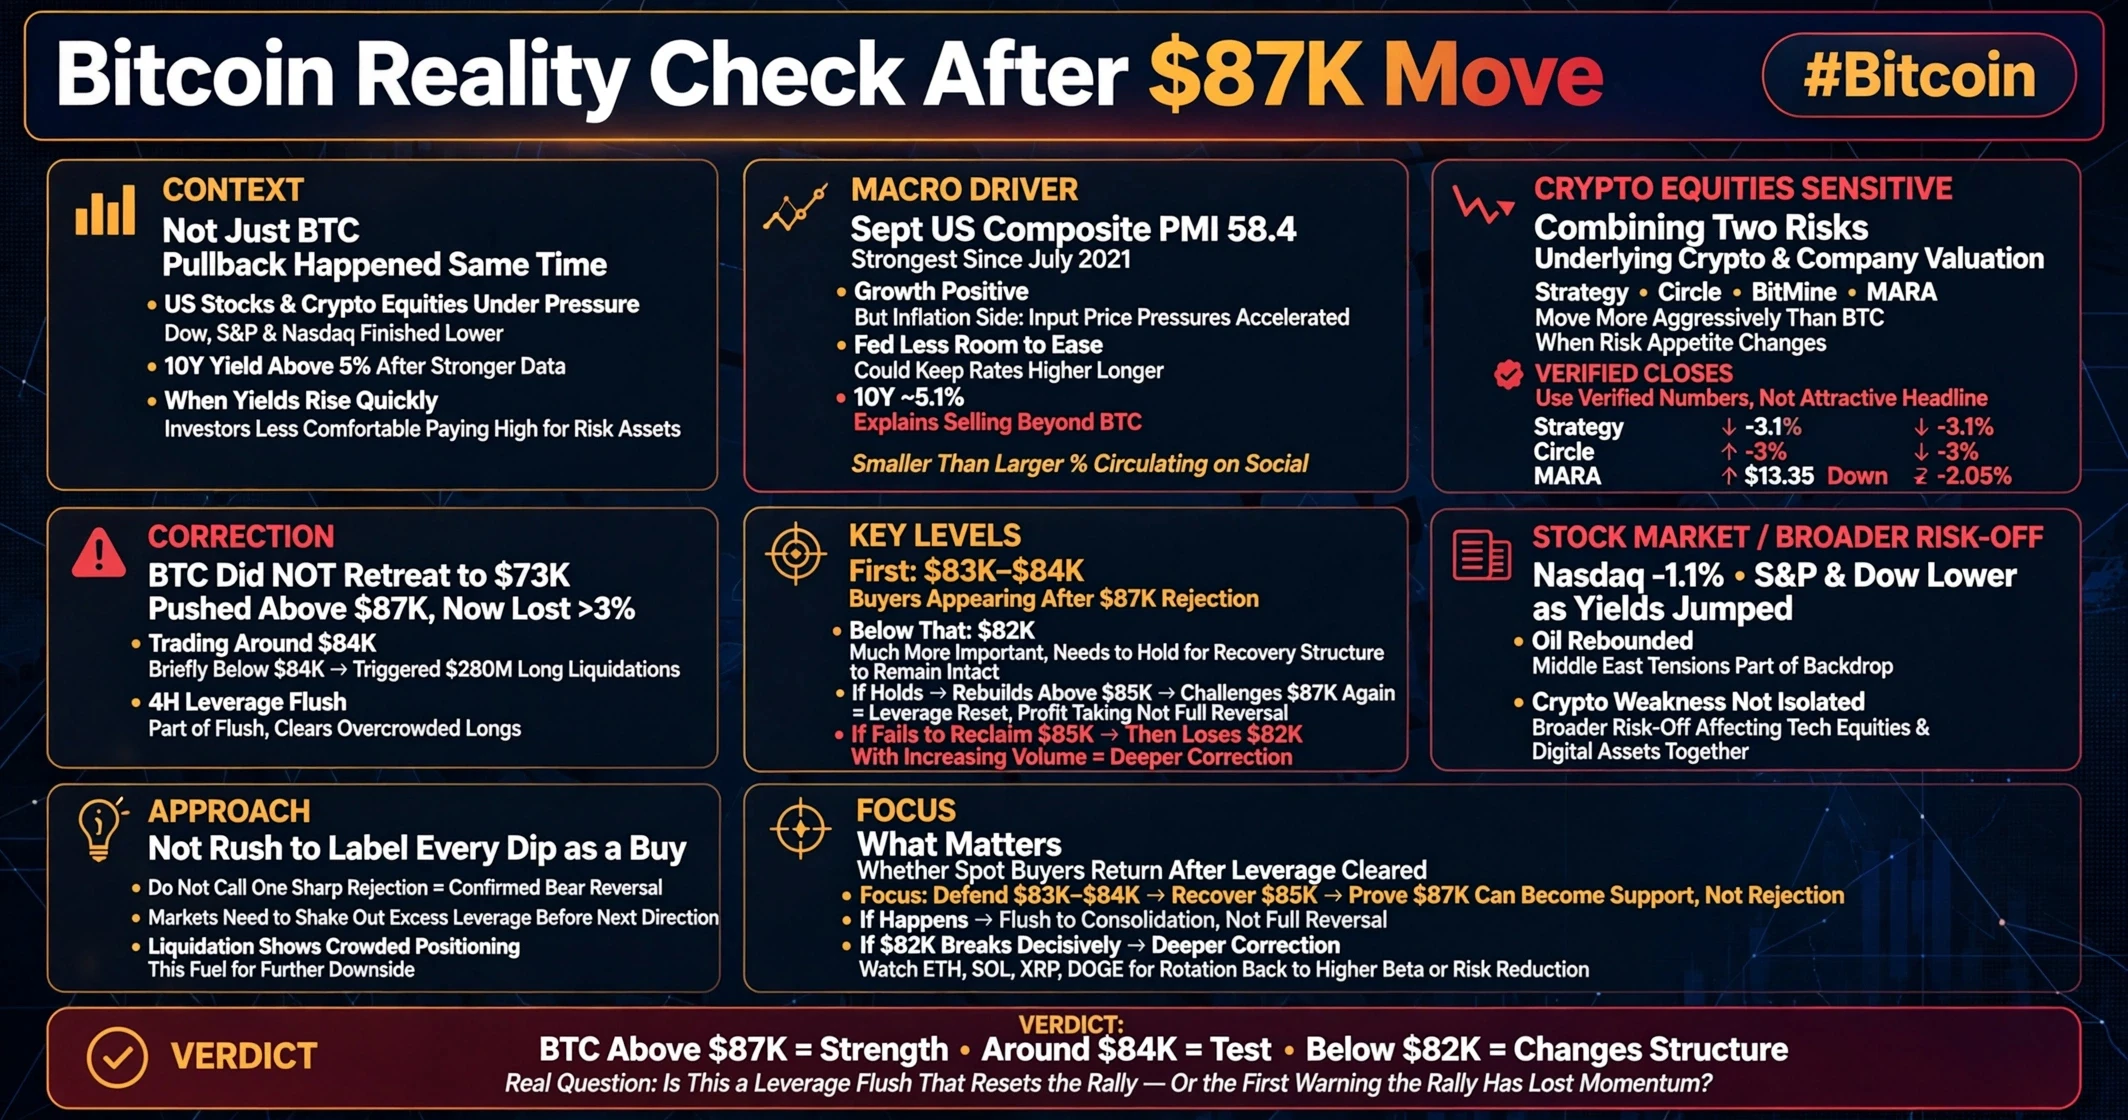
The interesting part is not simply that BTC pulled back. It is that the pullback happened at the same time U.S. stocks and crypto-linked equities came under pressure. The Dow, S&P 500 and Nasdaq all finished lower, while the 10-year Treasury yield pushed above 5% after the latest U.S. economic data came in much stronger than expected. That combination matters because when bond yields rise quickly, investors usually become less comfortable paying high prices for risk-sensitive assets.
The September U.S. Composite PMI came in at 58.4, its strongest reading since July 2021. At first glance, strong economic growth sounds positive. The problem for markets is the inflation side of the report. Business input-price pressures also accelerated, which increased expectations that the Federal Reserve may have less room to ease policy and could potentially keep rates higher for longer. The 10-year Treasury yield reached roughly 5.1%, its highest level since 2007.
That explains why the selling spread beyond Bitcoin.
Crypto-linked equities are particularly sensitive because investors are effectively combining two risks: the underlying crypto market and the valuation of the company itself. Strategy, Circle, BitMine and mining stocks such as MARA can therefore move much more aggressively than BTC when risk appetite changes.
The latest closing data confirms the broader pressure. Strategy fell about 3.1%, Circle declined roughly 3%, and MARA finished around $13.35, down about 2.05%. These moves are meaningful, but they are also smaller than some of the larger percentage declines circulating on social media. I would rather use the verified closing numbers than repeat an attractive headline without confirmation.
And there is another number I would correct: Bitcoin did not retreat to $73K in this latest move.
BTC recently pushed above $87K and then lost more than 3%, trading around the $84K area. At one point it briefly moved below $84K, triggering roughly $280 million in long liquidations over a four-hour period. That tells us leverage was part of the flush.
Now comes the more important question:
Is this simply a short-term flush, or is the market beginning a deeper trend reversal?
For me, the answer depends less on one red candle and more on what Bitcoin does around the next support zones.
The first area I am watching is roughly $83K–$84K. BTC has already shown buyers appearing around this region after the rejection from $87K. Below that, the $82K area becomes much more important. Analysts following the latest move have also identified $82K as a key level that needs to hold if the broader recovery structure is going to remain intact.
If BTC holds this area, rebuilds above $85K and eventually challenges $87K again, I would view the recent move more as a leverage reset and profit-taking event than confirmation of a complete trend reversal.
But if BTC repeatedly fails to reclaim $85K and then loses $82K with increasing selling volume, the situation changes. At that point, traders would have a stronger reason to consider that the market is moving from a simple pullback into a deeper correction.
The stock market is giving us another piece of the puzzle.
The Nasdaq dropped around 1.1%, while the S&P 500 and Dow also finished lower as yields jumped. Reuters reported that oil prices also rebounded and Middle East tensions remained part of the risk backdrop. This means the crypto weakness is not happening in isolation. There is a broader risk-off component affecting technology, equities and digital assets together.
That is why I would not rush to label every dip as a buying opportunity.
At the same time, I would not call one sharp BTC rejection a confirmed bear-market reversal either.
Markets often need to shake out excessive leverage before deciding their next direction. The recent liquidation of long positions shows exactly how quickly crowded positioning can become fuel for a downside move. What matters now is whether spot buyers return after the leverage has been cleared.
My focus from here is simple:
BTC needs to defend the $83K–$84K area, recover $85K, and eventually prove that $87K can become support rather than another rejection zone.
If that happens, the recent flush may turn into another consolidation phase.
If $82K breaks decisively, I would start paying much more attention to the possibility of a deeper correction.
For the related crypto market, I am watching ETH, SOL, XRP and DOGE alongside BTC. They should tell us whether capital is rotating back into higher-beta assets or whether traders are continuing to reduce risk.
The purpose here is not to predict the next candle.
It is to identify the levels where the market itself gives us information.
BTC above $87K was strength.
BTC around $84K is a test.
BTC below $82K would change the structure.
So the real question is not “Did Bitcoin crash?”
The better question is:
Is this the leverage flush that resets the rally — or the first warning that the rally has lost momentum?
#USSeptemberCompositePMISurgesTo58.4 #GateSquareMidAutumnReunion
repost-content-media
BTC-0.83%
CRCL-5.41%
BMNR-7.26%
MARA-9.48%
#FlapDistributes22.96MInFees
Flap Is Turning Trading Activity Into Rewards
One thing caught my attention in the latest Flap numbers: this is not just another campaign promising users rewards for completing tasks.
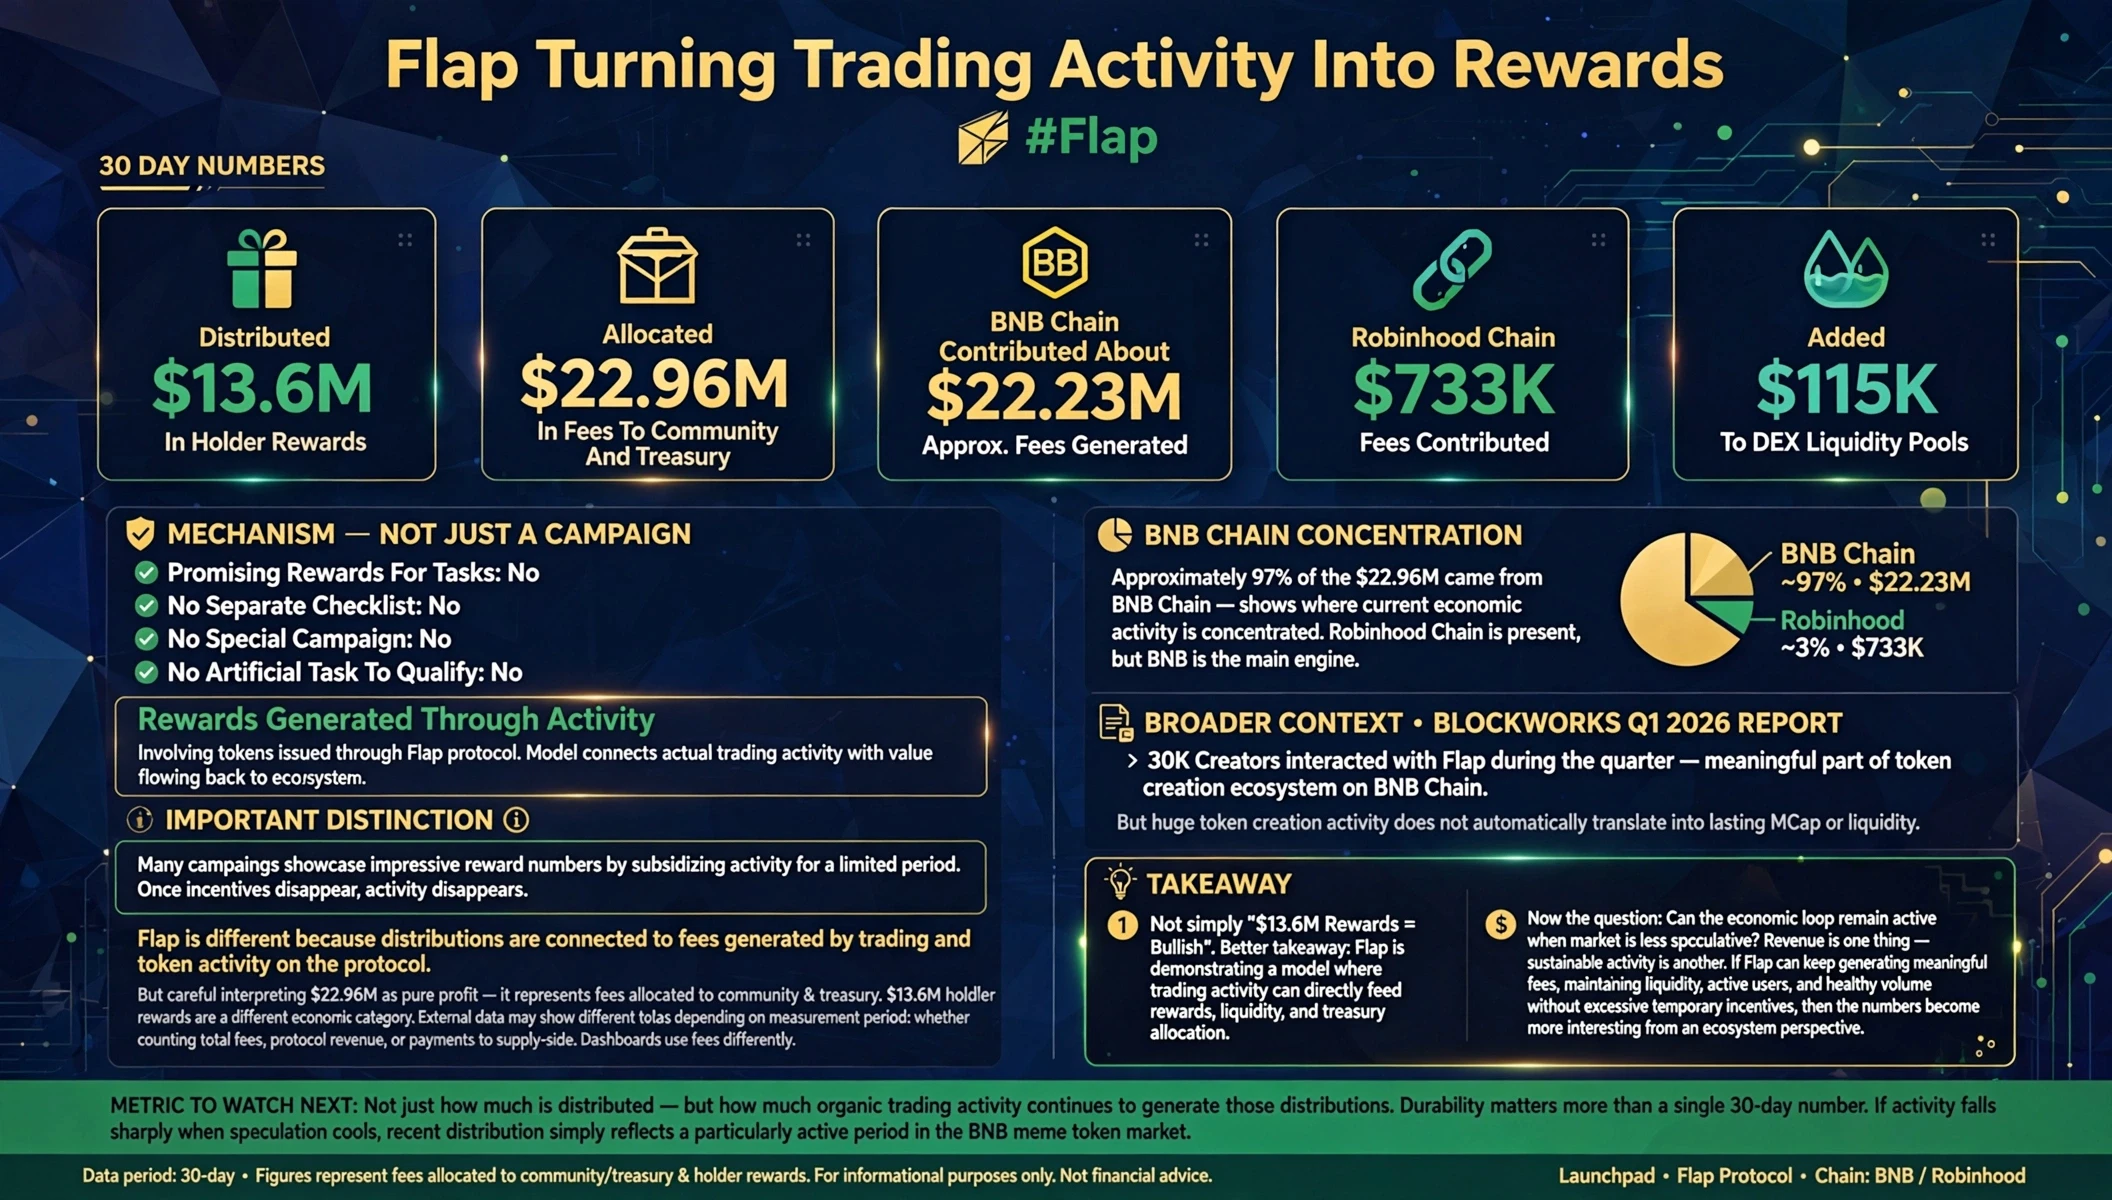
Over the past 30 days, Flap says it distributed $13.6 million in holder rewards and allocated $22.96 million in fees to the community and treasury. The majority of that activity came from BNB Chain, which contributed about $22.23 million, while Robinhood Chain accounted for roughly $733,000. Flap also added another $115,000 to DEX liquidity pools.
The part I find more interesting is
MrFlower_XingChen
#FlapDistributes22.96MInFees
Flap Is Turning Trading Activity Into Rewards
One thing caught my attention in the latest Flap numbers: this is not just another campaign promising users rewards for completing tasks.
Over the past 30 days, Flap says it distributed $13.6 million in holder rewards and allocated $22.96 million in fees to the community and treasury. The majority of that activity came from BNB Chain, which contributed about $22.23 million, while Robinhood Chain accounted for roughly $733,000. Flap also added another $115,000 to DEX liquidity pools.
The part I find more interesting is the mechanism behind those numbers.
Users did not have to complete a separate checklist, join a special campaign, or perform some artificial task just to qualify. The rewards were generated through activity involving tokens issued through the Flap protocol. In other words, the model is trying to connect actual trading activity with value flowing back toward the ecosystem.
That distinction matters.
A lot of crypto campaigns can create impressive reward numbers simply by subsidizing activity for a limited period. Once the incentives disappear, the activity can disappear with them. Flap's latest figures are more interesting because the reported distributions are connected to fees generated by trading and token activity on the protocol.
But I would still be careful about interpreting the $22.96 million as pure protocol profit.
The figure represents fees allocated to the community and treasury, while the $13.6 million represents holder rewards. These are different economic categories. External data also shows different totals depending on the measurement period and whether the source is counting total fees, protocol revenue, or payments to supply-side participants.
That is an important detail because crypto dashboards often use the word “fees” differently.
The BNB Chain concentration is another signal worth watching.
Of the $22.96 million reported allocation, approximately 97% came from BNB Chain. That tells us where the current economic activity around Flap is actually concentrated. Robinhood Chain is present, but BNB Chain remains the main engine behind the numbers right now.
And this fits into the broader BNB Chain launchpad story.
A Blockworks Q1 2026 report noted that more than 30,000 creators interacted with Flap during the quarter, showing that Flap had already become a meaningful part of the token-creation ecosystem on BNB Chain. At the same time, the report highlighted an important reality of launchpads: huge token-creation activity does not automatically translate into lasting market capitalization or liquidity.
That is probably the biggest thing I would watch from here.
Revenue is one thing. Sustainable activity is another.
If Flap can keep generating meaningful fees while maintaining liquidity, active users and healthy trading volume without relying excessively on temporary incentives, then these numbers become much more interesting from an ecosystem perspective.
If activity falls sharply when market speculation cools down, then the recent fee distribution could simply reflect a particularly active period in the BNB Chain meme-token market.
So my takeaway is not simply “$13.6M rewards = bullish.”
The better takeaway is that Flap is demonstrating a model where trading activity can directly feed rewards, liquidity and treasury allocation.
Now the question is whether that economic loop can remain active when the market becomes less speculative.
That is the metric I would watch next:
not just how much Flap distributes, but how much organic trading activity continues to generate those distributions.
That will tell us much more about the durability of the protocol than a single 30-day number.
repost-content-media
BNB-1.33%
MEME-2.66%
#JapanRealEstatePowerChipStocksRise
Japan’s Stock Market Is Rising — But the Real Story Is More Concentrated Than the Nikkei Suggests
Japan’s market gave traders a very interesting signal on September 18.
The Nikkei 225 jumped 1.38% to 65,018.95, reclaiming the psychologically important 65,000 level. It reached 65,436.57 intraday, while trading value on the Tokyo Stock Exchange Prime Market was around ¥10.4 trillion. On the surface, this looks like a broad risk-on session. But when I looked underneath the index, the structure became much more interesting.
The first thing I noticed was the di
MrFlower_XingChen
#JapanRealEstatePowerChipStocksRise
Japan’s Stock Market Is Rising — But the Real Story Is More Concentrated Than the Nikkei Suggests
Japan’s market gave traders a very interesting signal on September 18.
The Nikkei 225 jumped 1.38% to 65,018.95, reclaiming the psychologically important 65,000 level. It reached 65,436.57 intraday, while trading value on the Tokyo Stock Exchange Prime Market was around ¥10.4 trillion. On the surface, this looks like a broad risk-on session. But when I looked underneath the index, the structure became much more interesting.
The first thing I noticed was the divergence between the Nikkei and the broader market.
The TOPIX actually slipped 0.07% to 4,091.14, while Prime Market stocks had 511 advancers versus 1,003 decliners. That means the Nikkei's 1.38% gain was not coming from broad participation across Japanese equities. A relatively small group of large, high-weight technology and semiconductor companies did much of the heavy lifting.
And that takes us directly to the semiconductor story.
On Friday, Kioxia surged 9.4%, Lasertec gained 8.7%, Advantest rose about 6%, and Tokyo Electron added 4.2%. These weren't random moves. They came as global investors continued to focus on AI infrastructure, semiconductor demand and the capital expenditure required to build the next generation of computing capacity.
There is some real economic evidence behind that theme.
The latest Reuters Tankan survey showed Japanese manufacturers' confidence rising to +21 in September from +18 in August, the strongest reading since December 2021. More importantly, the electronics sector's sub-index jumped to +39 from +24. The survey specifically linked the improvement to semiconductor and data-center demand.
Another government survey adds more context. Large Japanese companies' business sentiment moved to +5.3 in Q3 from -0.5, while production machinery manufacturers recorded +23.4, supported by semiconductor-manufacturing equipment demand. Information and communications equipment manufacturers recorded +19.9, helped by AI data-center demand. Companies also expected capital investment to rise 11% for fiscal 2026.
So the semiconductor move isn't just about today's chart.
There is a potential chain developing:
AI demand → semiconductor equipment → chips → data centers → electricity → physical infrastructure.
That is where the power and real-estate themes become interesting.
But I would be careful with the idea that every Japanese power stock is participating equally. Friday's market was still highly selective, and some electricity names actually declined. The same applies to real estate: higher rates create a different environment for property companies than for semiconductor exporters.
And then we have the biggest macro variable: the Bank of Japan.
The BOJ raised its policy rate by 25 basis points to 1.25% on September 18, the highest level in 31 years. The vote was 7–2, meaning two policymakers opposed the increase.
Normally, a rate hike would be expected to support the yen.
But the opposite happened.
The yen weakened sharply after the decision, reaching around ¥158 per dollar, with the currency falling as much as 1.3% according to the Financial Times. The market appears to have focused on the uncertainty surrounding the pace of future tightening rather than simply reacting to the rate increase itself.
That matters for Japanese equities because a weaker yen can support the overseas earnings of major exporters and technology companies when foreign revenue is translated back into yen.
So right now, I'm watching three separate forces rather than treating this as one simple “Japan stocks rally” story.
Semiconductors are being driven by AI and data-center demand.
Power and infrastructure are tied to the enormous electricity requirements behind that AI expansion.
Real estate has exposure to data centers, logistics and physical infrastructure, but also has to deal with the reality of higher Japanese interest rates.
The most important thing for me isn't whether the Nikkei can print another green candle.
It's whether this concentrated semiconductor leadership eventually develops into broader market participation.
If that happens, the Japan story could become much bigger than one strong session.
For now, the market is giving us a fascinating combination: record-level equity prices, a 1.25% BOJ rate, a surprisingly weak yen, strong semiconductor demand and rising AI-related investment.
That combination deserves much more attention than the headline +1.38% alone.
#GateSquareMidAutumnReunion #GateMeme #AppleEvent @GateSquare @Gate_Square
$SNDK ‌$NVDA ‌$TSLA ‌
SNDK-6.90%
NVDA-1.42%
TSLA-2.17%