Square
Following
Hot
News
Notifications
Profile
Share your thoughts
placeholder
Article
XRP USDT MARKET UPDATE PREDICTION
live-cover
LIVE2,026
GM legends
Let’s make today great
post-image
Trenches
mihao
m
bade
b
mihao
4Cxj...pump
Market Cap
$.
Change
.
24h Vol
$.
Holders
.
bill
b
bade
b
bill
85Rh...pump
Market Cap
$.
Change
.
24h Vol
$.
Holders
.
PIEVERSE
P
bade
b
PIEVERSE
0x0e...25a9
Market Cap
$.
Change
.
24h Vol
$.
Holders
.
AGT
A
bade
b
AGT
0x5d...e274
Market Cap
$.
Change
.
24h Vol
$
Holders
.
IDOL
I
bade
b
IDOL
0x3b...ab07
Market Cap
$.
Change
.
24h Vol
$.
Holders
.
We appreciate you, Mr. Crypto President! 😂
post-image
I’m not sold on this bounce just yet !
Futures are still driving this market and that’s always bad news!!
ripple:native hedera-hashgraph:native stellar:native
post-image
HBAR-1.36%
XLM-0.64%
#WCTCS9
#Dr.HanOxfordUnionSpeech

A speech at the Oxford Union can become more than an ordinary public appearance when it introduces ideas that encourage people to question established thinking. Dr. Han's speech represents an opportunity to bring important discussions into an international environment where leadership, innovation, economics, and global challenges are regularly debated.

What I find particularly valuable about these discussions is the exchange of perspectives. Progress does not happen simply because someone presents a convincing argument. It happens when ideas are challenged, e
post-image
$LINK Currently trading at 9.185, up 1.559% over 24H (range: 8.574–9.374). The 1H trend is weak, with RSI at 55; the 4H trend is weak, with RSI at 29.4, in oversold territory. Resistance: 9.374; support: 8.574. For an upside move, price needs to hold above 9.374. A break below 8.574 that fails to recover would mean weakness is likely to continue. In the next review, check whether price holds above 9.374 and whether it can recover after losing 8.574. Volume is only 0.03x, so a breakout without volume is prone to failure. Market volatility is high; for observation only.
post-image
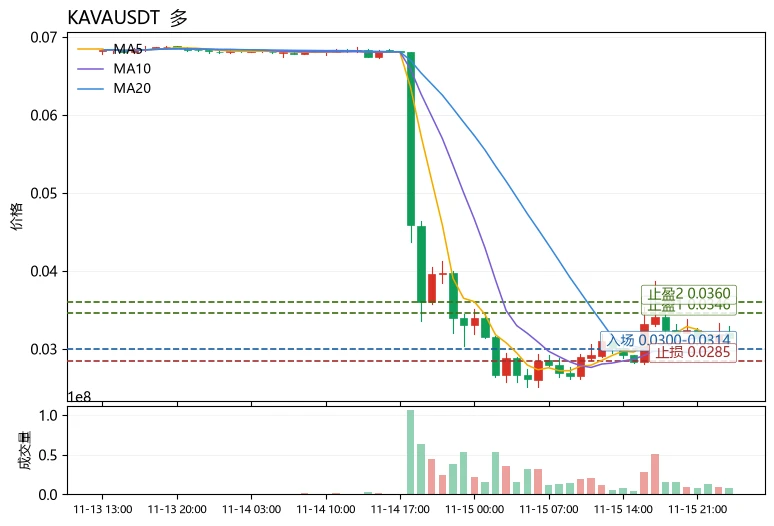
The Fear and Greed Index has fallen to 10. Many people’s first reaction is, “When there’s panic, you should buy the dip,” but this is precisely a common trading misconception—extreme fear only indicates intense selling pressure; it doesn’t mean prices have bottomed. What really matters is whether sentiment, sector rotation, and BTC’s trend are moving in sync, rather than looking at a single reading.
$KAVA is down 10.05% over 24 hours, with a trading volume of 13.7M USDT, making it one of the biggest losers amid extreme fear. Technically, MA5=0.031636 remains above MA20=0.0301465, so the mediu
post-image
SPCXB
SPCXBSpaceX
Four.meme
MC:$3.12KHolders:2
0%
KAVA-0.56%
MEGA+0.26%
A whale adds to long positions whenever ZEC falls; 5x leveraged position loses $3.5 million
live-cover
LIVE1,626
Quite a few people have asked me why I’m still bearish. Friends at OK and elsewhere say I’m just dusting off the old script from the last bear market and remind me not to forget Bitcoin’s halo of a bull market every four years. But isn’t that itself just applying a historical template? Put simply, the scarcity created by the four-year halving cycle really has fueled Bitcoin’s price.
But if we really project bull and bear markets according to that rhythm, then the bull market that should have arrived in 2021 had already played out by 2025—Bitcoin briefly surged to around 130,000 in 2025. By tha
post-image
BTC-0.67%
ETH-1.26%
In less than 15 minutes, we shall see if @appmyage will pull a surprise 😮 or a shocker 🤔
Please how much is 500 $GRAM worth?
post-image
GRAM-0.97%
𝐒𝐓𝐎𝐏..... 𝐒𝐓𝐎𝐏..... 𝐒𝐓𝐎𝐏 🚨$BTC is at a critical long-term support level! Bears are staring at the latest red candle while ignoring the bigger picture. Bitcoin is testing a trendline that has supported price action for nearly 1,700 days. This is no ordinary support level, but a reflection of a market structure spanning years. Several things are critical now: 📍 Support holds: A strong rebound could follow. 📍 Support breaks: The long-term bullish structure will suffer serious damage. 📍 Confirmation matters: A wick dipping below support does not necessarily mean the trend has comp
post-image
BTC-0.67%
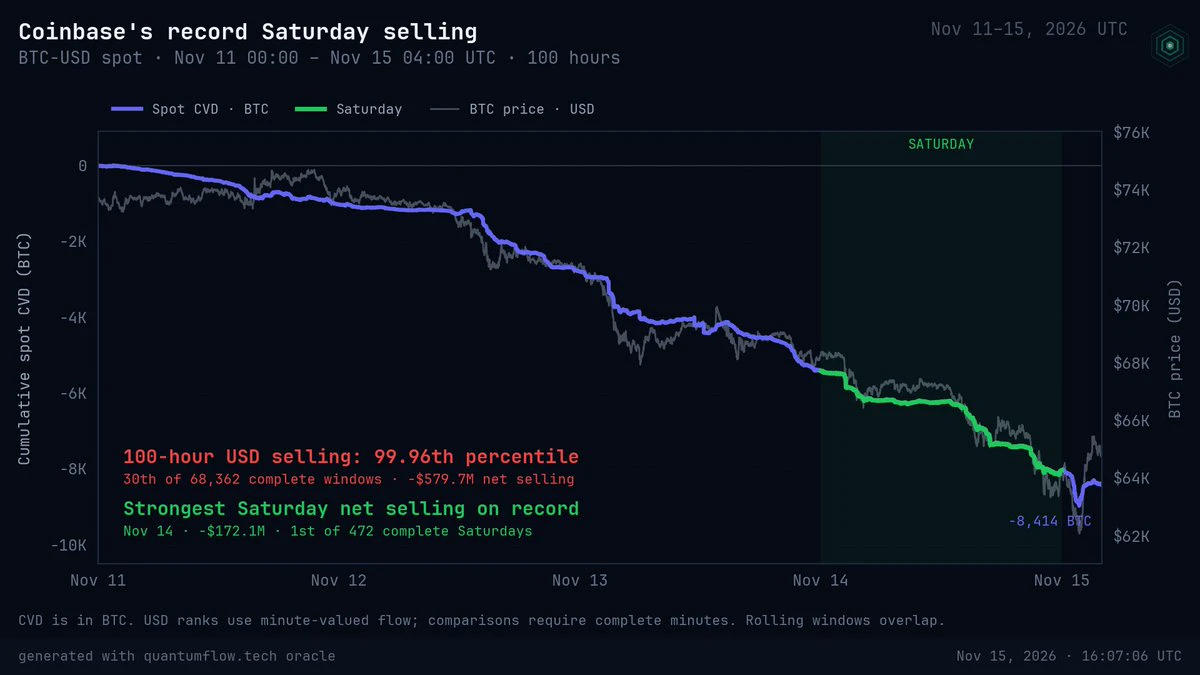
Yesterday was Coinbase’s strongest Saturday for net $BTC selling in history
Across the 100 hour sell off, Coinbase’s sell intensity also reached the 99.96th percentile, ranking among the most extreme stretches on record
post-image
BTC-0.67%
USELESS | Short 🔴 | Bearish | 15-minute timeframe, 24-hour change: -7.74% | Volume: 34.2M USDT. Short rationale: Price is below EMA200; EMA20/50/200 are bearishly aligned; RSI14 is 40.5; the MACD histogram is negative; ADX14 is 20.0; volume is 0.70 times the 20-candle average; trend pullback/continuation. Entry: 0.09944 Stop loss: 0.102819 Take profit 1: 0.0952167 | Take profit 2: 0.0926827 | Take profit 3: 0.0893041 The entry point is for reference only; do not chase the trade. The strategy is invalidated if the stop-loss level is hit. This is a technical analysis strategy only and does not
post-image
USELESS-14.68%
I’m starting to give more credence to the conspiracy theory that Jensen turned a blind eye to some of Nvidia’s advanced chips being smuggled into China.
If he did, I think it was because he believed it was in Nvidia’s best interest. I don’t think Chinese spies got to him.
post-image
NVDA-1.92%
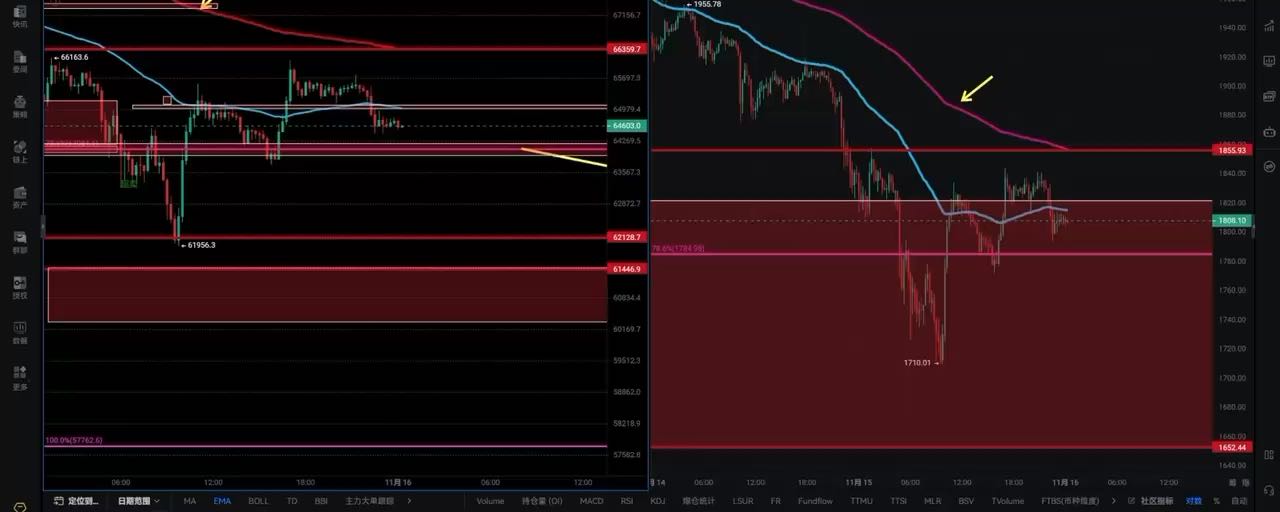
Bitcoin and Ethereum: key weekly levels at 8 a.m. tomorrow after Saturday’s sell-off $BTC
BTC-0.65%
  • 1
  • 2
#ShareWeekly ‌#Ethereum at $1,809.13: The Breakdown, the Oversold Signal, and Eight Tests ETH Must Pass Before a Real Recovery

Ethereum is approaching a critical technical zone, but the important question is no longer simply how far it has fallen. It is whether selling pressure is finally losing control or whether the market is preparing for another leg lower.

At the supplied price of $1,809.13, ETH is trading far below its major daily moving averages. Momentum indicators show significant weakness, derivatives data reveal heavy long liquidations, and recent ETF flows point to institutional
post-image
$BTC .D Bitcoin Dominance Falling
$OTHERS.D Altcoin Dominance Is Rising
$USDT.D Stable Currency Dominance Is Falling
post-image
BTC-0.67%
STABLE-1.39%
$JCT After liquidity was pulled, I think waiting for a rally and then shorting is the right decision.
post-image
JCT-3.26%
Load More

Join 40 M users in our growing community

⚡️ Join 40 M users in the crypto craze discussion

💬 Engage with your favorite top creators

👍 See what interests you

Trending Topics

GateIPOAccessAnthropic

359.4K Views2.7K Discussing

Gate IPO Access Phase 3 features Anthropic (ANT), with USDT subscription interest starting from 100 USDT. Successful allocations will be delivered as real shares to Gate Stock Accounts. Indicative price: $70–$78/share Subscription: Nov 12–17 (UTC+8) Allocation is not guaranteed. Please manage risk accordingly.

Dr.HanOxfordUnionSpeech

152.1K Views514 Discussing

USOctoberPPIBelowExpectations

485.7K Views1.5K Discussing
View More