Share your thoughts
placeholder
Article
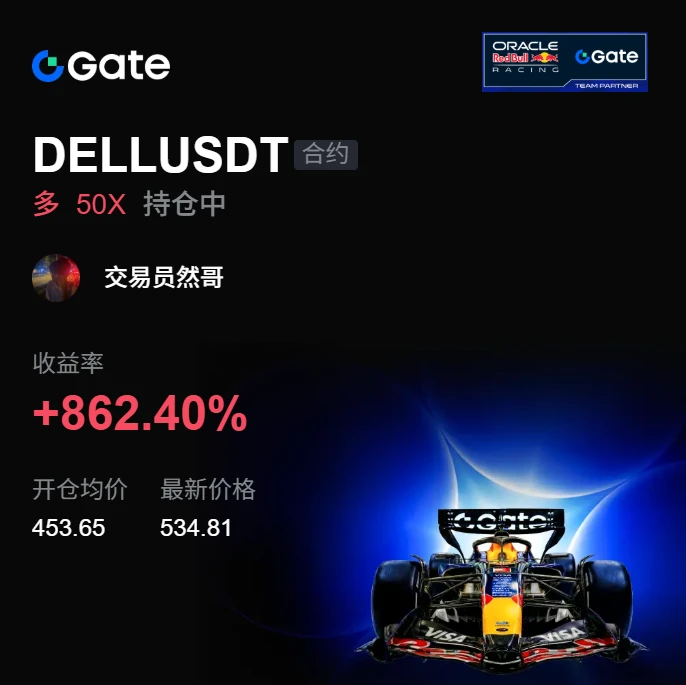
My hand trembled slightly when I set the stop-loss a few days ago, only to realize this morning that the filial piety was unnecessary. I opened the chart this morning and $DELL shot straight up, without giving anyone even a moment to catch their breath.

Luckily, this move wasn’t a spur-of-the-moment decision. I had my eye on it during those days of bottom consolidation, with buying pressure growing stronger each time and buyers stepping in to catch every pullback. So the entry was very clear: 453.65. The price has now reached 534.74, for a return of +862.4%. If this isn’t taking off, what is
post-image
DELL+0.58%
XRP-1.28%
BTC-0.53%
BREAKING: Ethena’s USDe is now the largest dollar collateral asset on Morpho, with nearly $658 million supplied.
USDE+0.01%
  • 2
Insiders are calling SYMBOL a reversal play after this 4h setup, but the 1h numbers tell a different story.

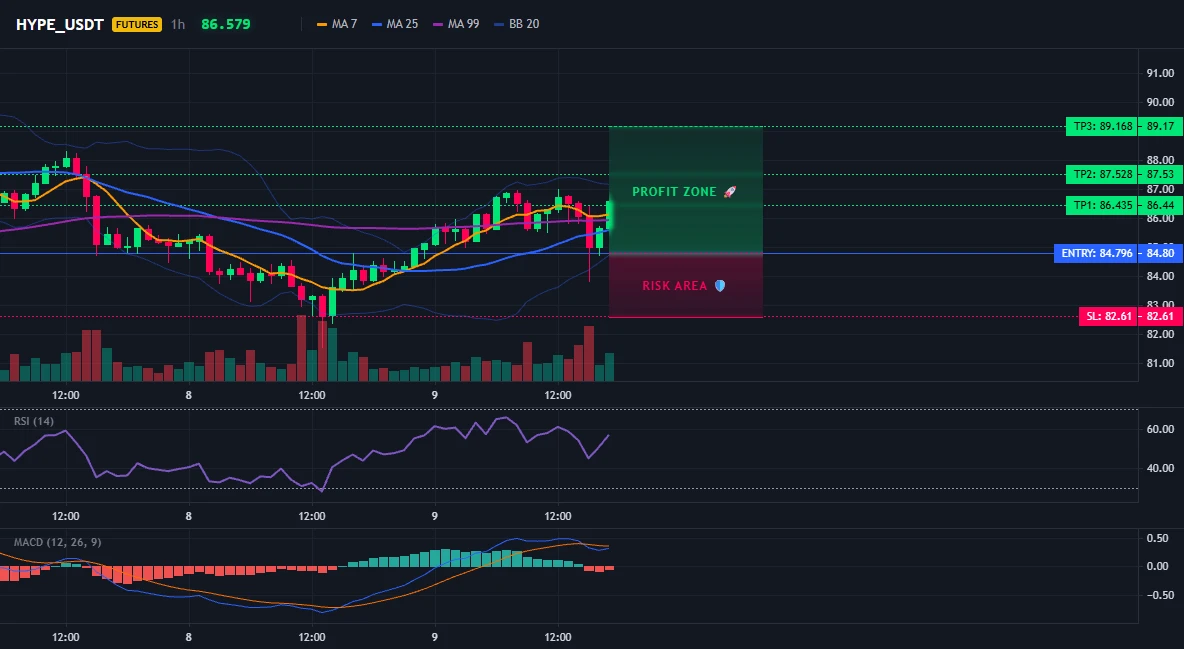
$HYPE /USDT - LONG

Trade Plan:
Entry: 84.568 – 85.024
SL: 82.610
TP1: 86.435
TP2: 87.528
TP3: 89.168

Why this setup?
Why now? The daily trend is bullish with a 95% confidence bias, yet the 1h price sits at 84.796 where the 15m RSI reads 61.26, showing room to run before overbought. The 1h ATR of 0.910793 means the entry zone between 84.568 and 85.024 is a precise, low-spread trigger. From there, TP1 at 86.435 is the initial target, with TP2 at 87.528 offering the real upside if mom
post-image
HYPE+0.56%
The daily-chart trend remains bullish, while the four-hour chart has entered a high-level consolidation and repair phase. After the previous surge, short-term upward momentum has weakened somewhat, the battle between bulls and bears has intensified, and the market has been oscillating back and forth. This is consolidation and shakeout during an uptrend, with no trend-reversal signal yet.

Short-term resistance above: 79500-80000, with relatively heavy selling pressure in this range; first support below: 78000-77500, with strong support at 77000-77300.
The intraday strategy is mainly to buy on
post-image
BTC-0.53%
This is why we can´t have nice things
post-image
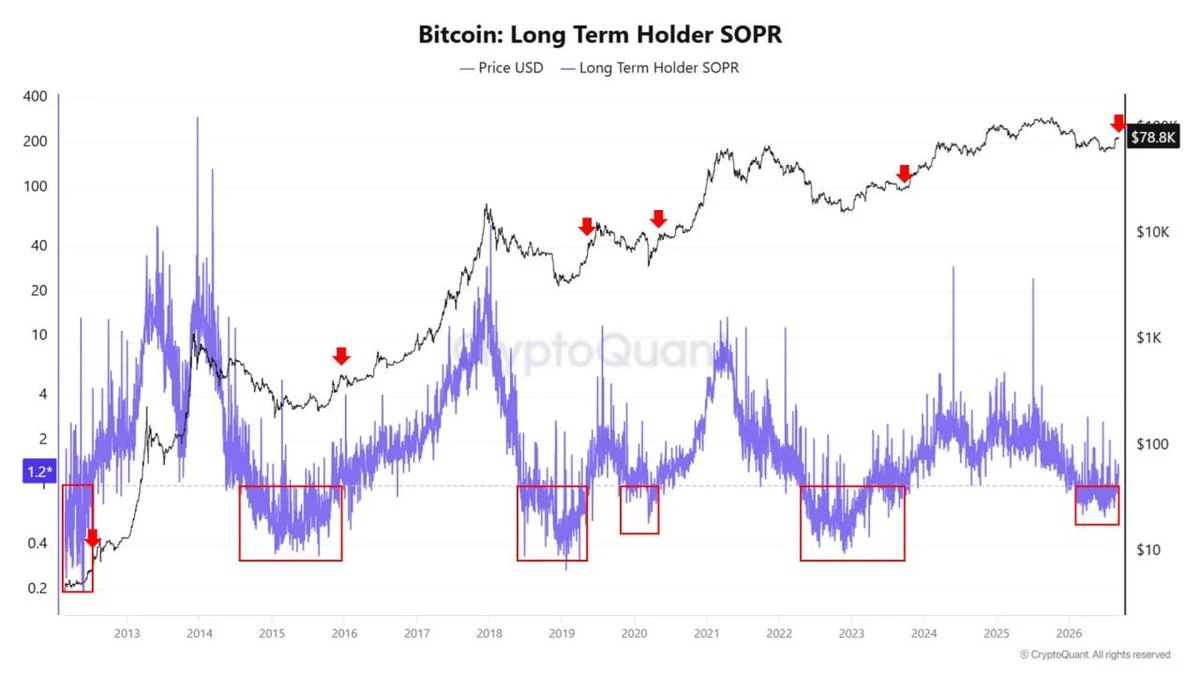
$BTC LTH-SOPR flipped back above 1 and has stayed there.
That's a very important shift after months of long-term holders selling around their cost basis.
Historically, this has been followed by a period of consolidation before a bigger move.
$BTC is doing exactly that right now.
This could be the start of the next leg higher.
post-image
BTC-0.53%
📊 TSLA — TECHNICAL TRADING ANALYSIS 🚗⚡
TSLA is currently sitting around some important Resistance, FVG & Support zones. It will be important to closely watch price action and volume at these levels. 👀
🔴 MAJOR RESISTANCE — $384
$384 is TSLA's key resistance zone.
If the price tests $384 and gets rejected, a short-term pullback may be possible.
📌 A $384 breakout + strong volume + successful retest could signal bullish continuation. 🚀
🔴 RESISTANCE — $375
$375 is the immediate resistance level.
If the price sustains above $375, buyers' strength may improve and the price could retest the $38
TSLA+0.08%
Retail investor: I check my 401k every single day & it's stressing me out. Red days ruin my mood.
Me: When's the last time you needed that money?
Retail investor: ...I'm 34. Not for like 30 years.
Me: So you're grading a 30 year investment every 8 hours.
Retail investor: When you put it like that...
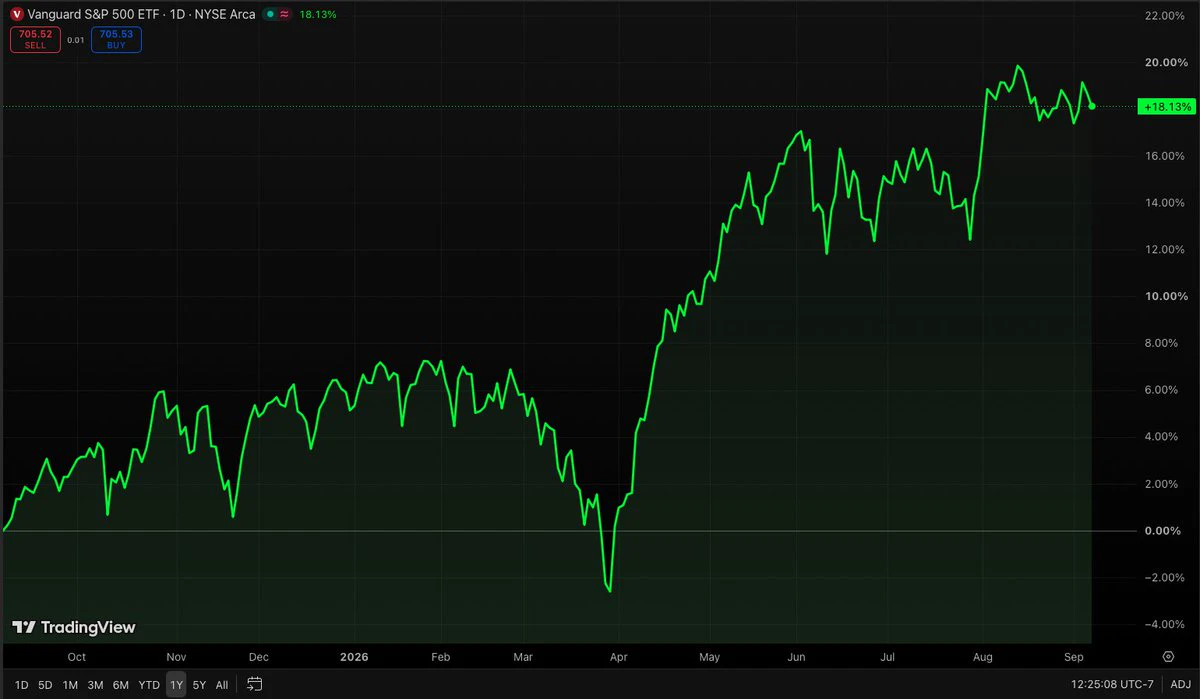
Me: Look at this chart & cover the last month with your hand. Could you have guessed it from the first 11?
Retail investor: No.
Me: Then what is Tuesday's red day telling you about 2056? Nothing. It's just a number that doesnt mater...
Retail investor: So don't look?
Me: Once a month for 401ks. Inv
post-image
Everyone missed SYMBOL dipping into the entry zone — but the daily trend says otherwise.

$BTC /USDT - LONG

Trade Plan:
Entry: 78341.5 – 78587.3
SL: 77284.5
TP1: 79349.3
TP2: 79939.3
TP3: 80824.2

Why this setup?
Why now? The daily trend remains bullish, giving a structural foundation for entries near 78464.4. The 15m RSI sitting at 47.1 means momentum is neither overbought nor oversold, leaving room for a directional move upward from this level. Meanwhile, the 1h ATR of 491.62 tells us average hourly volatility is wide enough to justify a stop placed just below 78531.4, the line in the sa
BTC-0.53%
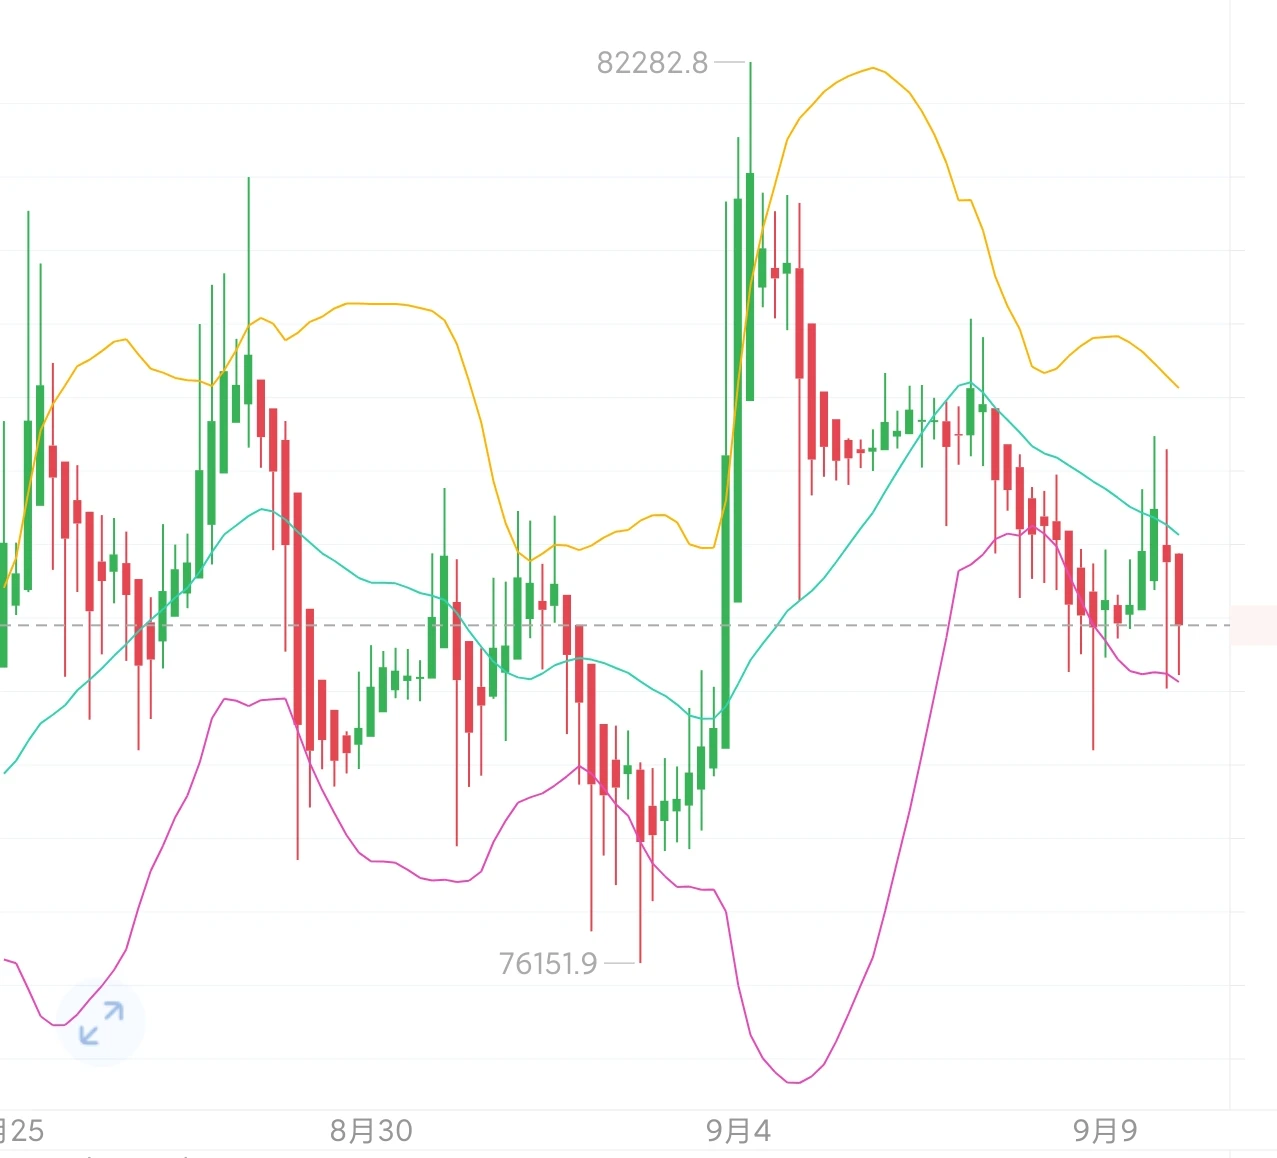
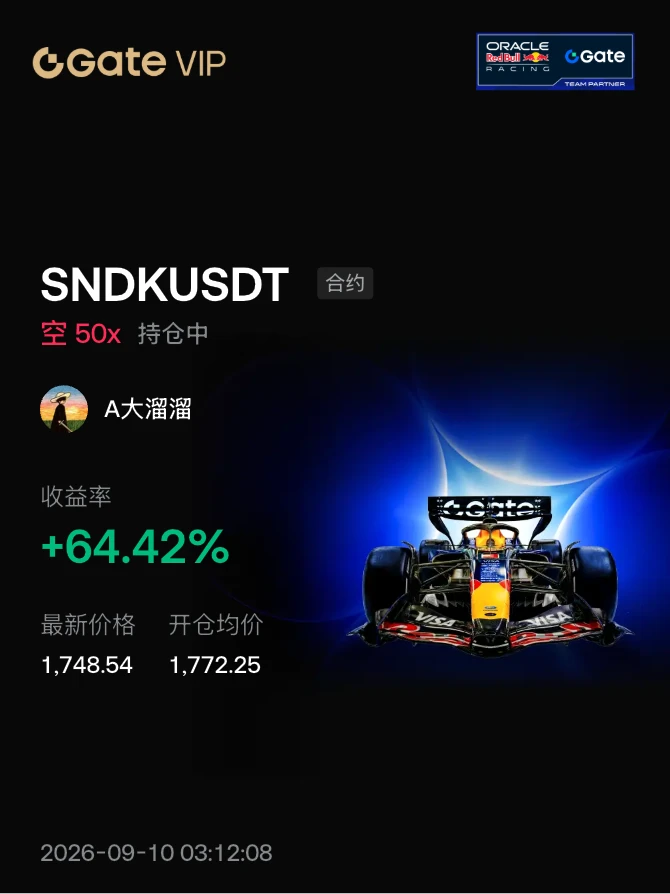
#晒出我的持仓收益 failed to break 1730 and pulled back.
post-image
  • 9
  • 2
IOST Bulish Market Updates
live-cover
LIVE59
🔥 YOUNAS TRADER LIVE | BTC, ETH & Altcoins 🚀 | Market Update
live-cover
LIVE1,174
Is SYMB going to blow past 1322.4 while everyone watches the wrong indicator on the 1h chart?

$ZEC /USDT - LONG

Trade Plan:
Entry: 1232.9 – 1246.7
SL: 1173.7
TP1: 1289.4
TP2: 1322.4
TP3: 1372.0

Why this setup?
Why now? The daily trend is bullish, but the 1h ATR at 27.536796 signals explosive momentum is building as we hold the 1239.8 entry reference, and the 15m RSI at 58.59 confirms we have room to run before overbought. The 1h price action is compressing around a tight range between 1232.9 and 1246.7, which means a breakout from this zone targets 1289.4 first, then the swing high at 13
ZEC+7.36%
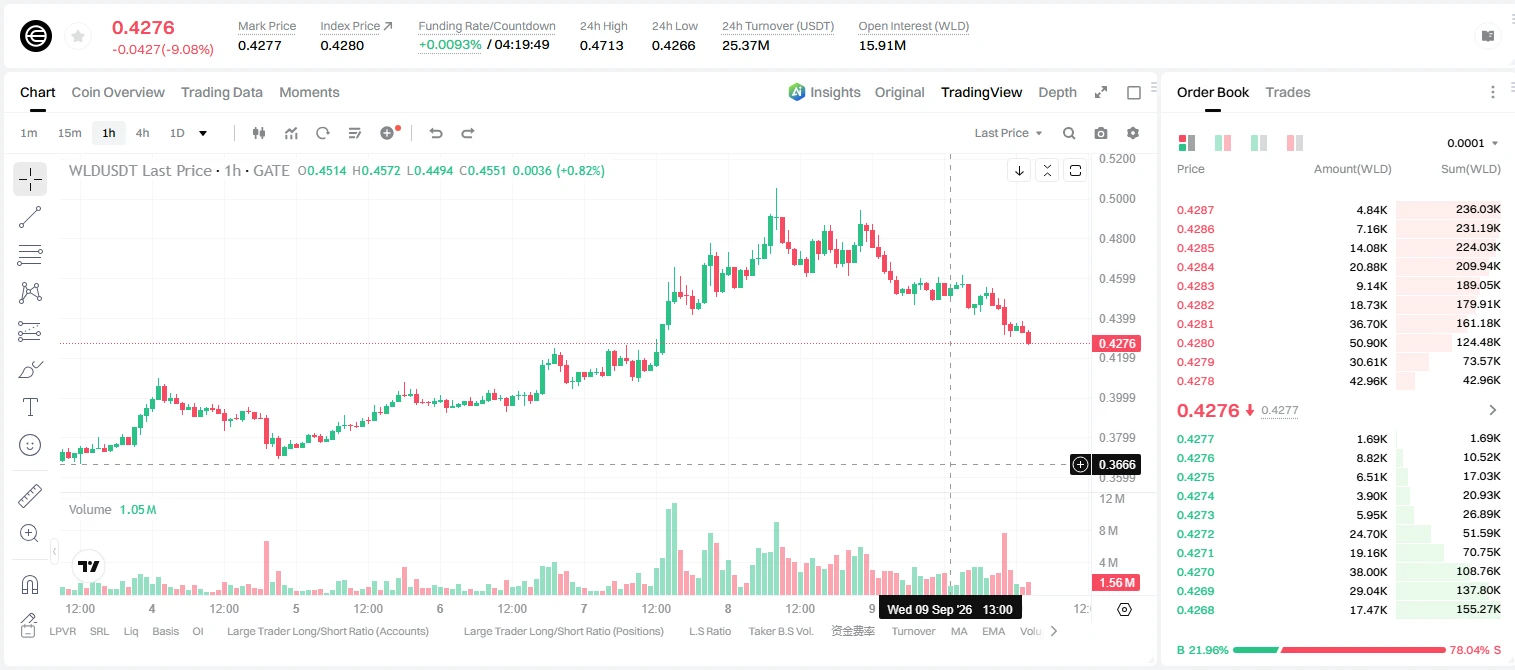
Everyone's betting on WALL STREET, but WLD is about to shock the entire market.

$WLD /USDT - SHORT

Trade Plan:
Entry: 0.4252 – 0.4298
SL: 0.4495
TP1: 0.4110
TP2: 0.4000
TP3: 0.3835

Why this setup?
Why now? The daily trend is still range-bound, so a breakdown from the 4h level at the 0.4275 reference is the tactical trigger for a short. With the 15m RSI at 37.51, momentum is already fading from the top, and the 1h ATR of 0.009171 sets a realistic first target at 0.4110 before the 0.4000 extension. Enter only within the 0.4252 to 0.4298 zone, and treat 0.4306 as the line in the sand.

Deb
post-image
WLD-7.53%
Is this really a rebound? This is CPR for my account, isn’t it?

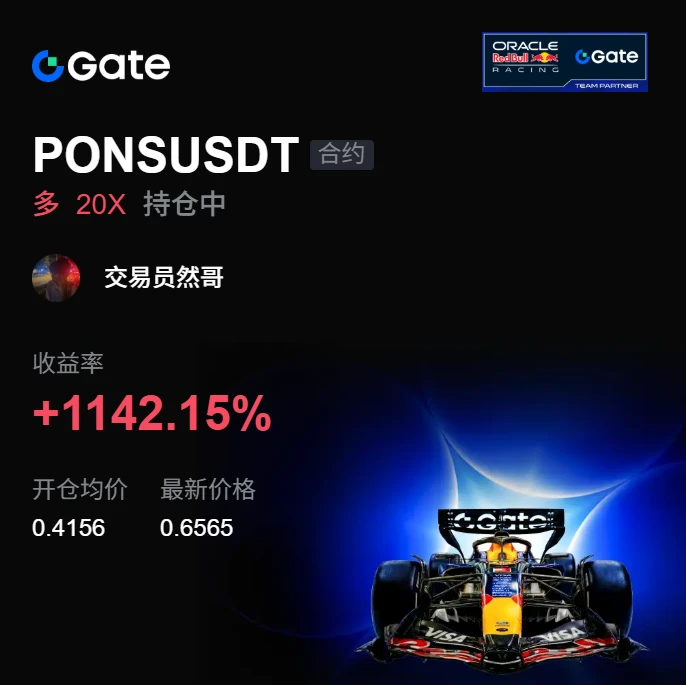
A few days ago in the early hours, when $PONS was bottoming out, I didn’t rush to buy the dip. I waited until the pullback held around the key level at 0.4156, and only entered with a small position once buying pressure quietly began to strengthen. The idea was simple: set a stop-loss, admit it if I’m wrong, and hold on if I’m right.

When I opened the chart this morning, 0.6532 had already been reached, and the floating profit had jumped straight to +1138.36%. Catching this move wasn’t about being quick; it was about honestly
post-image
PONS-23.32%
ETH-0.99%
DOGE-3.50%
$MU /USDT short squeeze is fading faster than expected, 1h ATR says the move is already over. Watch this.

$MU /USDT - SHORT

Trade Plan:
Entry: 1024.63 – 1029.79
SL: 1051.98
TP1: 1008.63
TP2: 996.24
TP3: 977.66

Why this setup?
Why now? The 1h price sits at 1027.21 inside a narrow range, the 1h ATR of 10.32 confirms the recent impulse has stalled, and entry sits right at 1027.21 with a tight band between 1024.63 and 1029.79. TP1 at 1008.63 is the first clear target, TP2 at 996.24 is the extension, and the daily trend being range-bound means momentum is weak. The 15m RSI at 57.52 shows we a
MU+2.35%
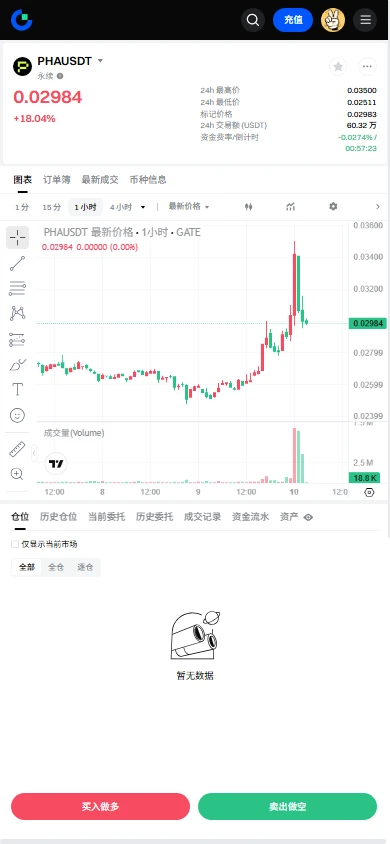
$PHA Signal】Long: 1H high-level consolidation awaiting momentum
$PHA 1H high-level consolidation, pulling back from 0.0349 to 0.03088, with a funding rate of -0.0038% and bid/ask depth of 1.11. The 4H MACD histogram is expanding, the Bollinger middle band is 0.0270, and the current price is above the middle band. OI is stable, and active selling pressure has not continued to increase.
🎯Direction: Long
⚡Entry/Limit order: 0.0307874 - 0.0308800
🛑Stop-loss: 0.0305712
🚀Target 1: 0.0313432
🚀Target 2: 0.0315748
🛡️Trade management:
- Execution strategy: After reaching Target 1, reduce the posit
post-image
PHA+14.82%
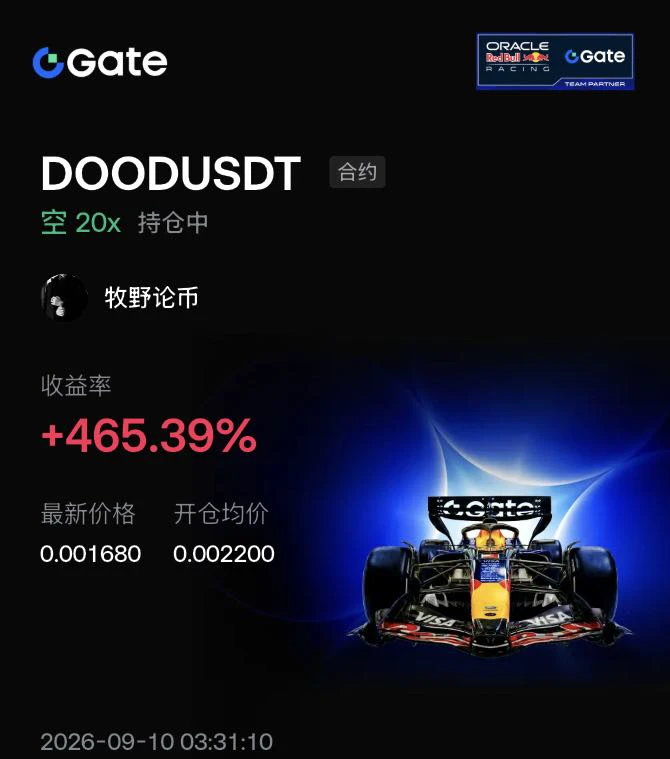
$DOOD USDT 20x short, opened at 0.002200, latest price 0.001680. Around 61.11 million tokens will be unlocked on September 9, accounting for 0.6% of the total supply and approximately 1.4% of the market cap. Recipients are primarily insiders and the foundation, with monthly linear releases creating sustained supply.
Prices all pulled back after the unlocks in June, July, and August. Following the August unlock, the price fell approximately 17% over six days, confirming the supply pressure historically.
Professional traders use the unlock window as an anchor for short positions rather than bett
post-image
DOOD-7.38%
BTC-0.53%
ETH-0.99%
🚀 PayPal’s PYUSDx just crossed a monumental $100M in stablecoin volume! Saturn, Concrete, and Cap are blazing the trail with custom coins. 💰 How will this reshape the stablecoin landscape? $PYUSD #CryptoInnovation
PYUSD+0.07%
Most traders will ignore this UNI signal and regret it later.

$UNI /USDT - LONG

Trade Plan:
Entry: 6.352 – 6.410
SL: 6.020
TP1: 6.652
TP2: 6.833
TP3: 7.104

Why this setup?
Why now? The daily trend is firmly bullish, giving the broader backdrop for a long. The 15m RSI at 50.4 confirms momentum is neutral-to-rising, so we are not chasing an overextended move. The 1h ATR of 0.115841 tells us normal price swings are small enough to manage risk tightly around the entry zone of 6.352 to 6.410. TP1 at 6.652 and TP2 at 6.833 offer a favorable reward-to-risk from the 6.381 entry reference. The li
UNI-5.60%
Load More

Join 40 M users in our growing community

⚡️ Join 40 M users in the crypto craze discussion

💬 Engage with your favorite top creators

👍 See what interests you

View More