Share your thoughts
placeholder
Article
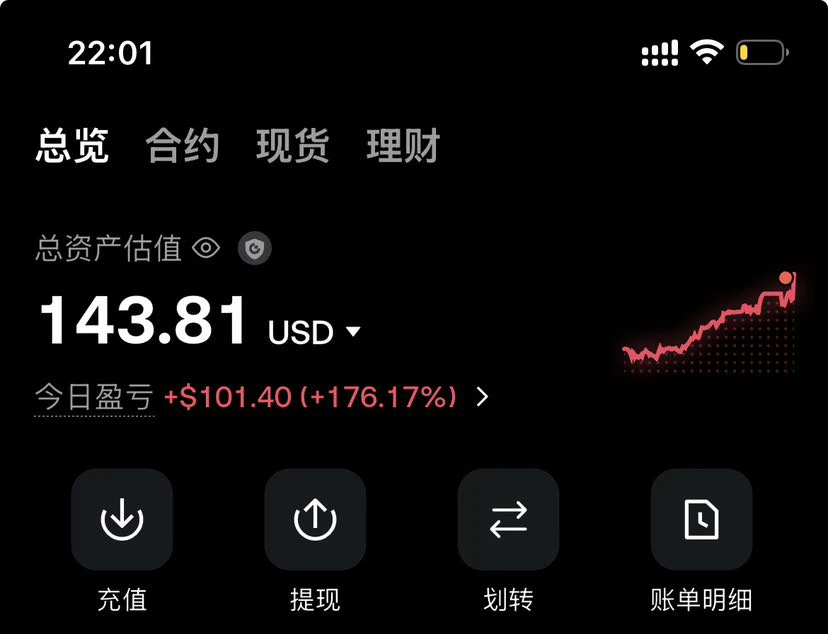
This return has me feeling nervous, worried the market will come to its senses tomorrow and blacklist me.

A few days ago, I took one last look at the market before bed, and $SNXX pulled back to around 13.489 and stopped moving. It was forming a base without breaking support, while funds were still quietly entering. I felt this level had potential, so I casually opened a long position.

The first thing I did after waking up was check my phone: 17.772 had appeared directly, locking in +1529.84%. After dragging on for so long, seeing it finally break out feels great.

Don't rush to add to yo
post-image
SNXX+5.34%
SNDK+2.91%
BTC+0.83%
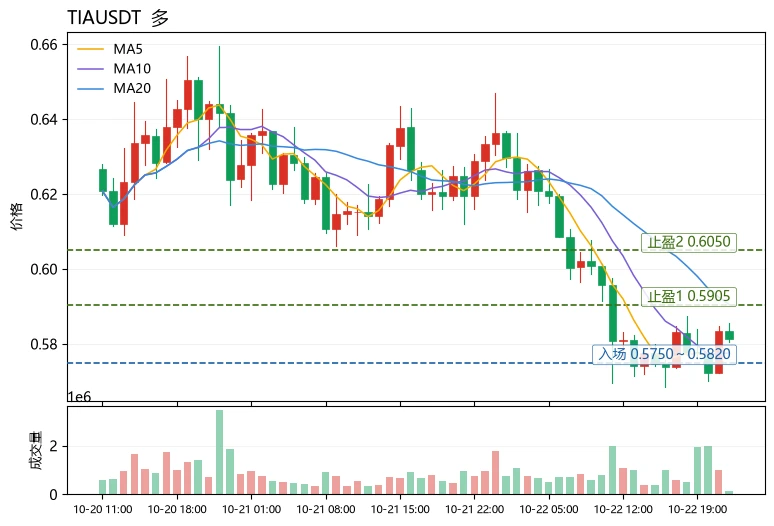
$BULLA Signal】Long | 1H MACD Momentum Restart
$BULLA RSI 1H 68.78, MACD histogram turns positive and expands, with price moving above 0.0739. The 4H Bollinger upper band is opening upward, order book bid depth has a slight edge, Bid/Ask 1.04. OI is flat, funding rate 0.08%, and short-term upward momentum is still expected.
🎯Direction: Long
⚡Entry/Orders: 0.07371220 - 0.07393400
🛑Stop-loss: 0.07023730
🚀Target 1: 0.07947905
🚀Target 2: 0.08225157
🛡️Trade Management:
- After reaching Target 1, reduce the position by 50% and move the stop-loss up to breakeven. If the price falls back to the e
post-image
BULLA+202.01%
BTC+0.83%
ETH+1.43%
SOL+2.87%
Why is $ETH /USDT whispering lower while everyone’s still staring at the green 15m RSI?

$ETH /USDT - SHORT

Trade Plan:
Entry: 2455.54 – 2460.20
SL: 2480.25
TP1: 2441.08
TP2: 2429.89
TP3: 2413.11

Why this setup?
A 4h short setup is live at 2457.87, but the invalidation line sits just 2.28 points above—tight, explosive.
- RSI (15m) at 58.3 shows a weak bounce, not a trend shift.
- ATR (1h) at 9.32 means small candles; the range 1D trend is compressing.
- Why now? The entry window (2455.54–2460.20) is a knife’s edge: break above 2460.15 kills the short; hold below, and TP1 at 2441.08
ETH+1.36%
Standard Chartered just opened spot BTC and ETH trading for institutional clients in the UAE.
First globally systemic bank to do it here, running it through the same desks as everything else.
Dubai now has a G-SIB taking crypto orders. That changes who is allowed to buy.
Dubai, Do Buy.
post-image
BTC+0.83%
ETH+1.43%
$1000 to $100,000 Crypto Trade Challenge Today
live-cover
LIVE903
Will BTC pump?
live-cover
LIVE1,299
What you do DAILY becomes your habits.
Your habits become your character.
And your character eventually creates your life.
So I created 16 daily activities designed to help you become a better version of yourself.
This is not a motivation.
It is a system.
Pick Few and Start today.
Do it consistently.
Your future self is watching.
post-image
Everyone’s buying XRP at 1.42, but the 4h tape just whispered something else.

$XRP /USDT - SHORT

Trade Plan:
Entry: 1.4184 – 1.4228
SL: 1.4415
TP1: 1.4049
TP2: 1.3944
TP3: 1.3787

Why this setup?
- The 1D trend is *range*, not breakout—so chasing longs here is gambling on noise.
- RSI on 15m is hot at 64 while price stalls at 1.4206, a classic bull trap setup.
- ATR is tight (0.0087), meaning the next 4h candle decides direction—my model leans SHORT with TP1 at 1.4049 and TP2 at 1.3944.
- Why now? The stop at 1.4415 is far, but invalidation at 1.4049 is close—risk/reward favors the
XRP+2.09%
Everyone’s chasing the 1D range—but the 4h clock on $MU /USDT is ticking toward a trapdoor.

$MU /USDT - SHORT

Trade Plan:
Entry: 1014.86 – 1017.08
SL: 1029.83
TP1: 1005.57
TP2: 998.64
TP3: 988.24

Why this setup?
Why now?
- RSI 15m at 55.7 is cooling, not reversing—momentum is bleeding into the 4h short bias (77.4 confidence).
- ATR 1h at 4.44 shows tight coils; the 1015.97 ref is a pivot. A break below 1014.86 opens TP1 at 1005.57, then TP2 at 998.64.
- 1D range means no rescue rally—just chop that favors sellers on the 4h.
- Your entry is waiting, not filled. That’s the edge.

post-image
MU+1.67%
$UNITREE Confucius, this original stock, will be priceless once it is listed on the spot market.
post-image
UNITREE+0.39%
#Gate用户突破6000万 The future has arrived—are you coming or not? Confucius goes all-in.
Everyone’s chasing longs on $SLX /USDT—but the 4h tape is quietly screaming the opposite.

$SLX /USDT - SHORT

Trade Plan:
Entry: 0.06995 – 0.07027
SL: 0.07167
TP1: 0.06894
TP2: 0.06816
TP3: 0.06699

Why this setup?
- RSI 15m is dead at 48.21—no momentum to push through the range.
- ATR 1h (0.000649) is thin; a break below 0.06995 triggers a fast slide to TP1 (0.06894) and TP2 (0.06816).
- Trend 1D is *range*, not uptrend—so shorts have room to breathe until 0.06949 invalidates.
- Why now? Entry at 0.07011 is the exact pivot; hesitation here is a gift for sellers.

Debate:
Are you sh
SLX+2.18%
Everyone’s chasing SUI at 0.80, but the 4h chart is quietly building a trap for the bulls.

SUI/USDT - SHORT

Trade Plan:
Entry: 0.8002 – 0.8052
SL: 0.8265
TP1: 0.7849
TP2: 0.7730
TP3: 0.7551

Why this setup?
- 1D trend is range, not breakout—so 0.8027 is the middle of a warzone, not a launchpad.
- RSI 15m at 60 shows short-term heat, but the SHORT bias (Conf: 55) says the upside is capped.
- ATR 1h (0.0099) is thin—meaning the move to TP1 (0.7849) is a 2.2% slide that could happen in one candle if volume hits.
- Why now? The price is sitting right at entry_ref, with invalidation at 0
SUI+7.10%
#Gate60MillionUsers
My first Gate trade still makes me laugh 😂
I remember staring at the chart like I had everything figured out. I saw a move, got excited, and entered without giving much thought to risk.
For a few minutes, everything looked perfect.
Then the market moved against me.
I kept staring at the screen thinking, “It’ll come back.”
Spoiler: it didn’t. 😂
That tiny trade taught me something I still remember today: the market doesn’t care how confident you feel.
Looking back, losing that trade wasn’t the worst part. The funny part was how seriously I thought I knew what I was doing.
post-image
Doge is finally catching up😂···
Keep it up, let’s see if it can reach 5w before the election.
post-image
DOGE+6.90%
🟢 SPOT TRADE SIGNAL — $ETH USDT
📍 Buying Zone: $2,350 – $2,450
🔴 Sell/Profit Zone: $2,800 – $3,100
🛡️ Risk Level: Below $2,200
ETH has pushed strongly out of its recent base, with $2,350–$2,450 acting as the key support/retest area. Holding this zone keeps the structure constructive, while $2,800–$3,100 is the next major resistance region. ‌
post-image
ETH+1.43%
I originally only wanted to mooch a breakfast, but the market ended up trapping me in a six-month grind. I opened the chart this morning, and $SNDK ripped straight up from the 1503.37 area, without even giving me time to hesitate.

I had my eye on it during those days of bottom consolidation. Capital was quietly flowing in, key levels kept moving higher, and pullbacks never broke structure. I was actually worried that going long would make me grind through another round, but thankfully it didn't pull any tricks this time.

Now at 1761.84, +1220.73% secured. This run feels incredible—it's li
post-image
SNDK+2.91%
SOL+2.84%
DOGE+6.86%
$PI Blue rain, blue rain, blue rain. Got it?
post-image
PI+1.42%
With this price action, I don’t even need to think—the account is dancing on its own 💃

While the market was forming a bottom intraday, many people were still hesitating over whether to cut their positions. I saw buying clearly strengthen around 0.3669, and several dips failed to break down. Funds were quietly entering, and the signal was basically obvious. I directly called for opening long positions at the time, and those who dared to follow should be laughing now 😏

The price has now reached 0.4008, up +652.19%, giving us the answer. I’d rather miss a limit-up move than catch a falling
post-image
WLD+6.18%
SOL+2.84%
ZEC+2.63%
my Rebalance bot - when patience pays off.
#gate #sol #btc $avax #nvidia
SOL+2.87%
BTC+0.83%
AVAX+3.50%
NVDA+0.87%
Load More

Join 40 M users in our growing community

⚡️ Join 40 M users in the crypto craze discussion

💬 Engage with your favorite top creators

👍 See what interests you

View More