Share crypto content and earn up to 60% commissions through content mining.
placeholder
gatefun
There’s a big profit to be made from the ETH short at 2,465—brothers, come to the livestream!
View Original
post-image
  • Reward
  • Comment
  • Repost
  • Share
By the time I got back from a quick bathroom break, the K-line had already wiped out my losses for me. 👀

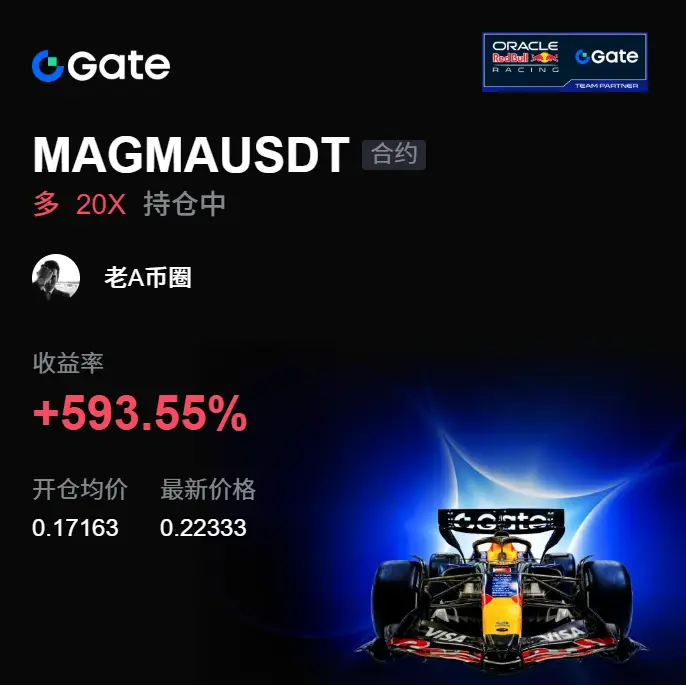
A few days ago, the market was still grinding back and forth in the early hours. I was watching the key level, which had held, so I casually shared the idea of going long. I didn’t expect it to explode immediately, but I had no intention of letting go either. Entered at 0.17163, and when I checked again just now, it was already at 0.22338, with unrealized gains of +593.55%. This profit came from letting the trade run. 😌

I’ve taken 80% in profit first, and moved the stop-loss on the re
ETH1.99%
XRP-0.47%
View Original
post-image
  • Reward
  • Comment
  • Repost
  • Share
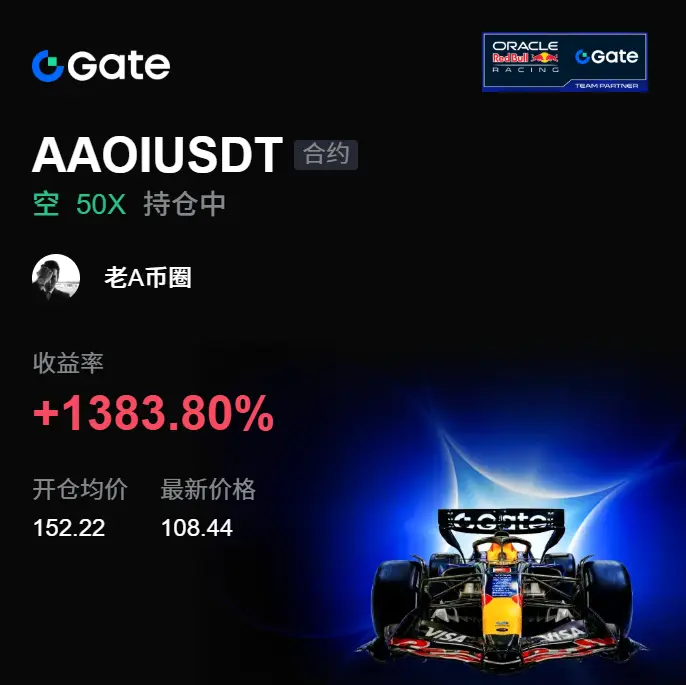
I didn’t expect it to drop, but it hit the target directly—excellent execution. When the screen was full of green, $AAOI rebounded to 152.22 but couldn’t move higher. Selling pressure was strong, so I alerted everyone to the short. I was worried about missing the move, but it handed me a nice leg down. Now at 108.15, +1394.87%. Feeling great, brothers.

Take 80% off first to lock in profits, and move the stop-loss on the remaining 20% to breakeven. Don’t panic on a rebound—you’re protected.

Don’t lose patience grinding through the range, only to try to regain your dignity in a one-way move.
AAOI-1.05%
DOGE0.57%
ZEC2.62%
View Original
post-image
  • Reward
  • Comment
  • Repost
  • Share
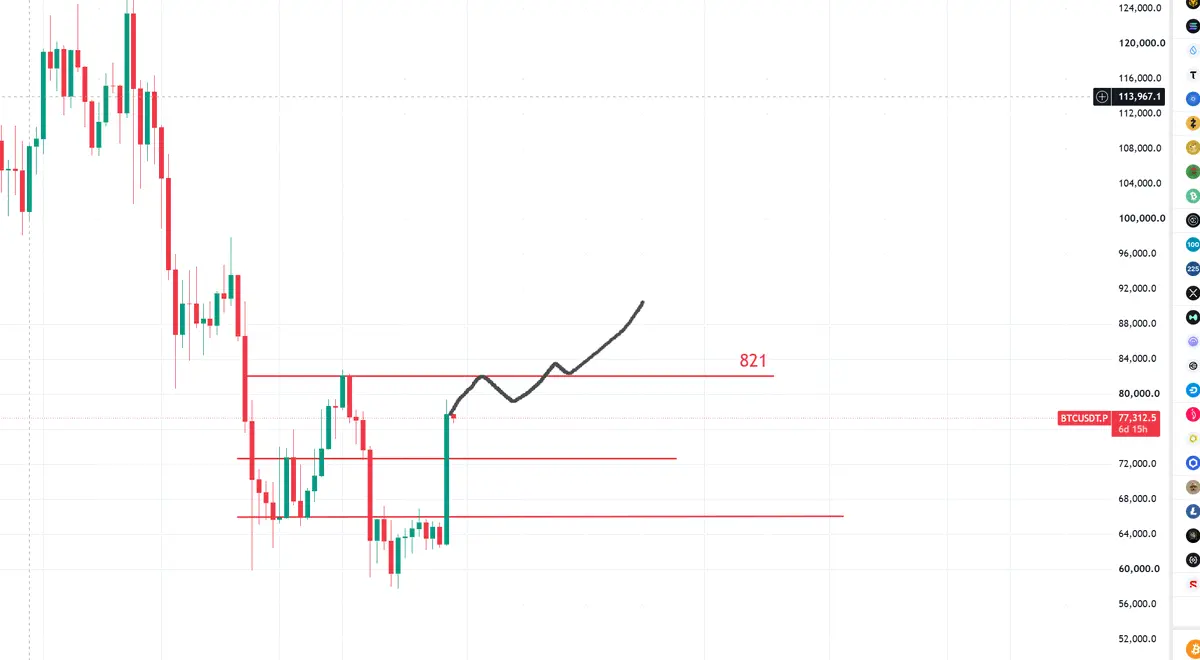
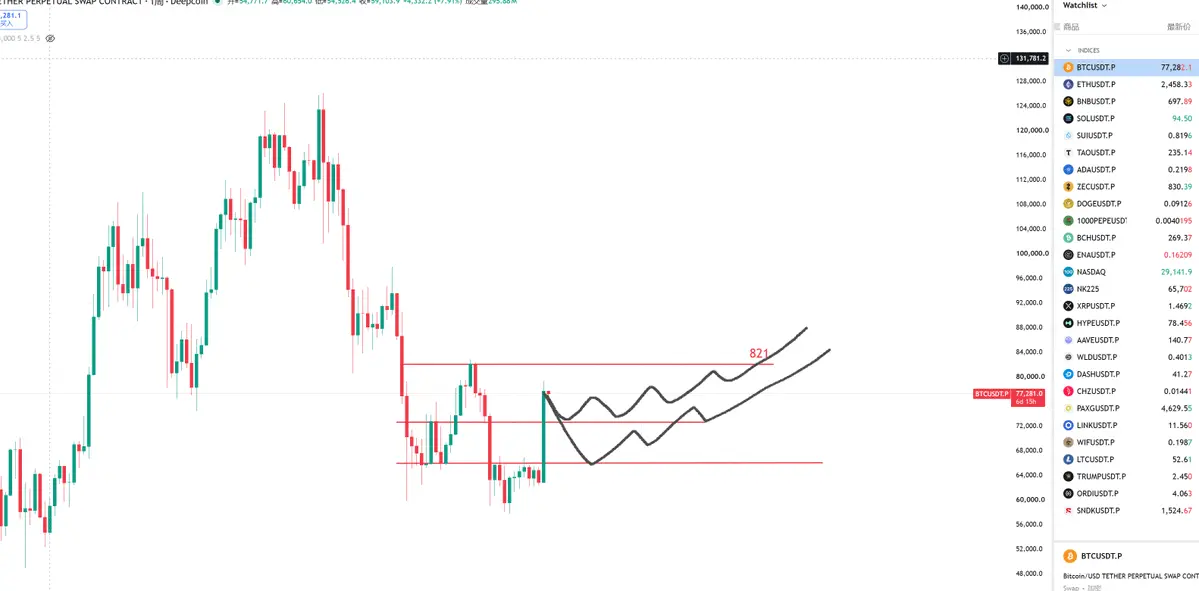
This is the weekly chart. We know that before the midterm elections actually take place, they have a bullish expectation effect. There are still 70 days, or 10 weekly candles.
Now, looking at Figures 1 and 2, which one do you think is more “realistic”?
If the price follows the pattern of the lower line in Figure 2, the weekly chart will basically look like a weaving machine. The amplitude of every weekly candle would have to be greater than or equal to 3000 points for this trend to be completed. The pattern shown above in Figure 2 may be relatively more realistic.
Therefore, before the midterm
View Original
post-image
post-image
  • Reward
  • Comment
  • Repost
  • Share
Market Update
gate liveLIVE
1,741
live-coin
  • Reward
  • Comment
  • Repost
  • Share
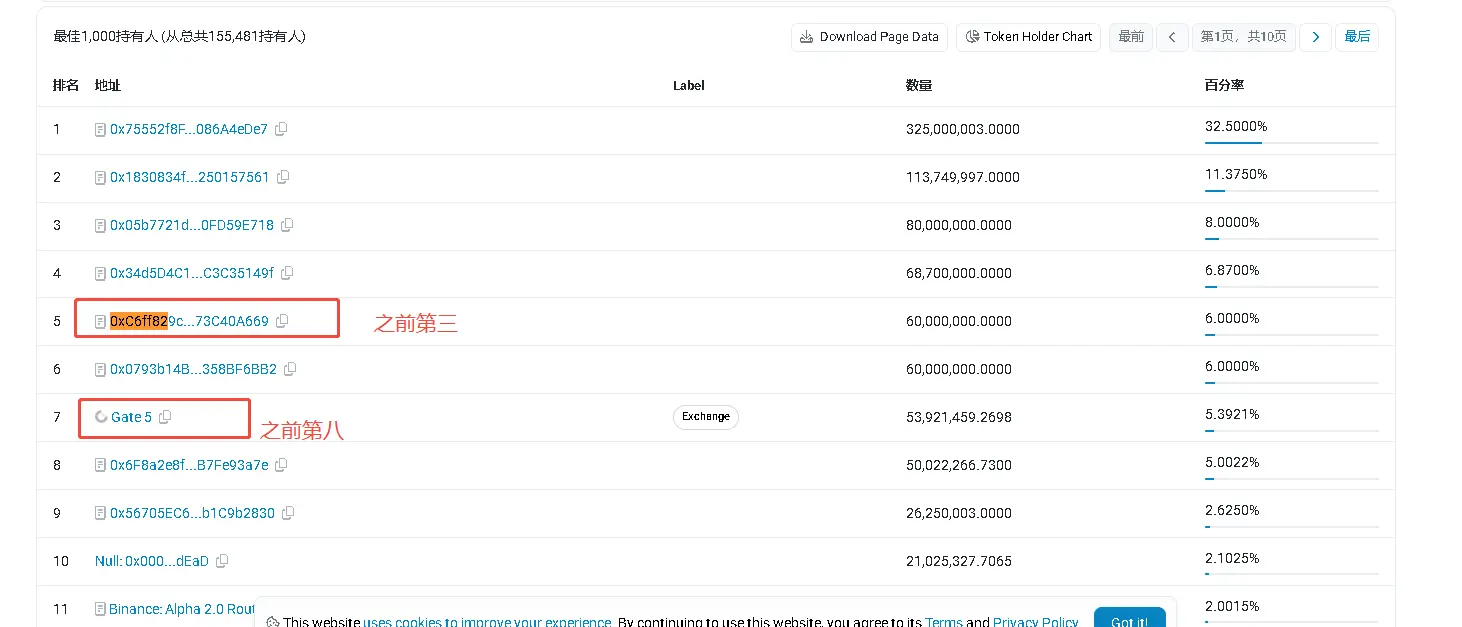
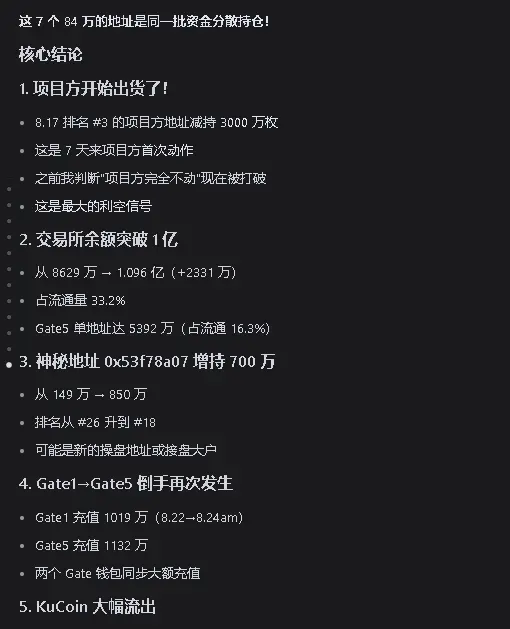
$BEAT holder address changes
BEAT-5.32%
View Original
post-image
post-image
  • Reward
  • 1
  • Repost
  • Share
AscendToHeaven:
Go to zero.
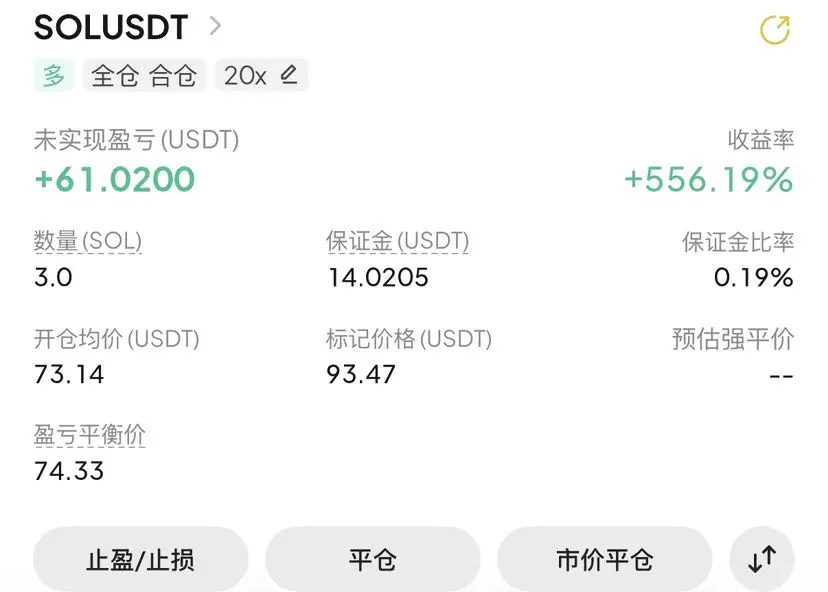
Previously went long following Silk Road, then didn’t pay much attention. Didn’t expect to still make a little
Still holding…$SOL
SOL1.36%
View Original
post-image
  • Reward
  • Comment
  • Repost
  • Share
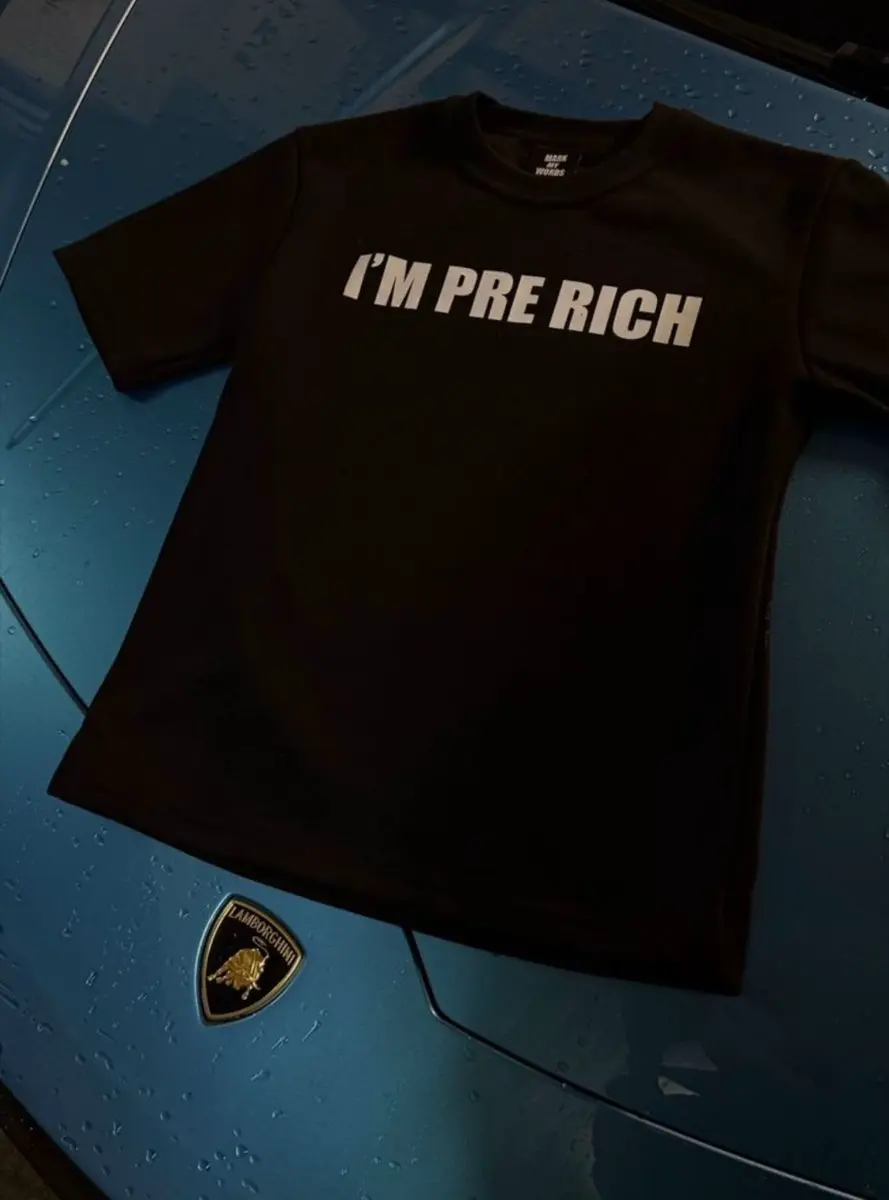
We're not broke, we're pre-rich
post-image
  • Reward
  • Comment
  • Repost
  • Share
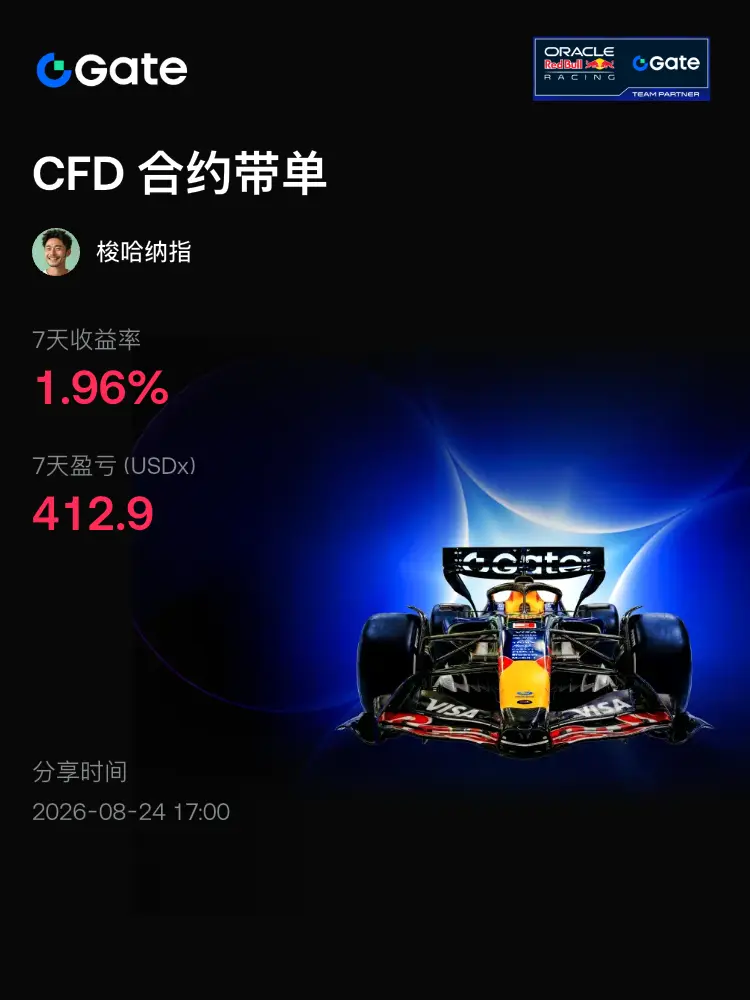
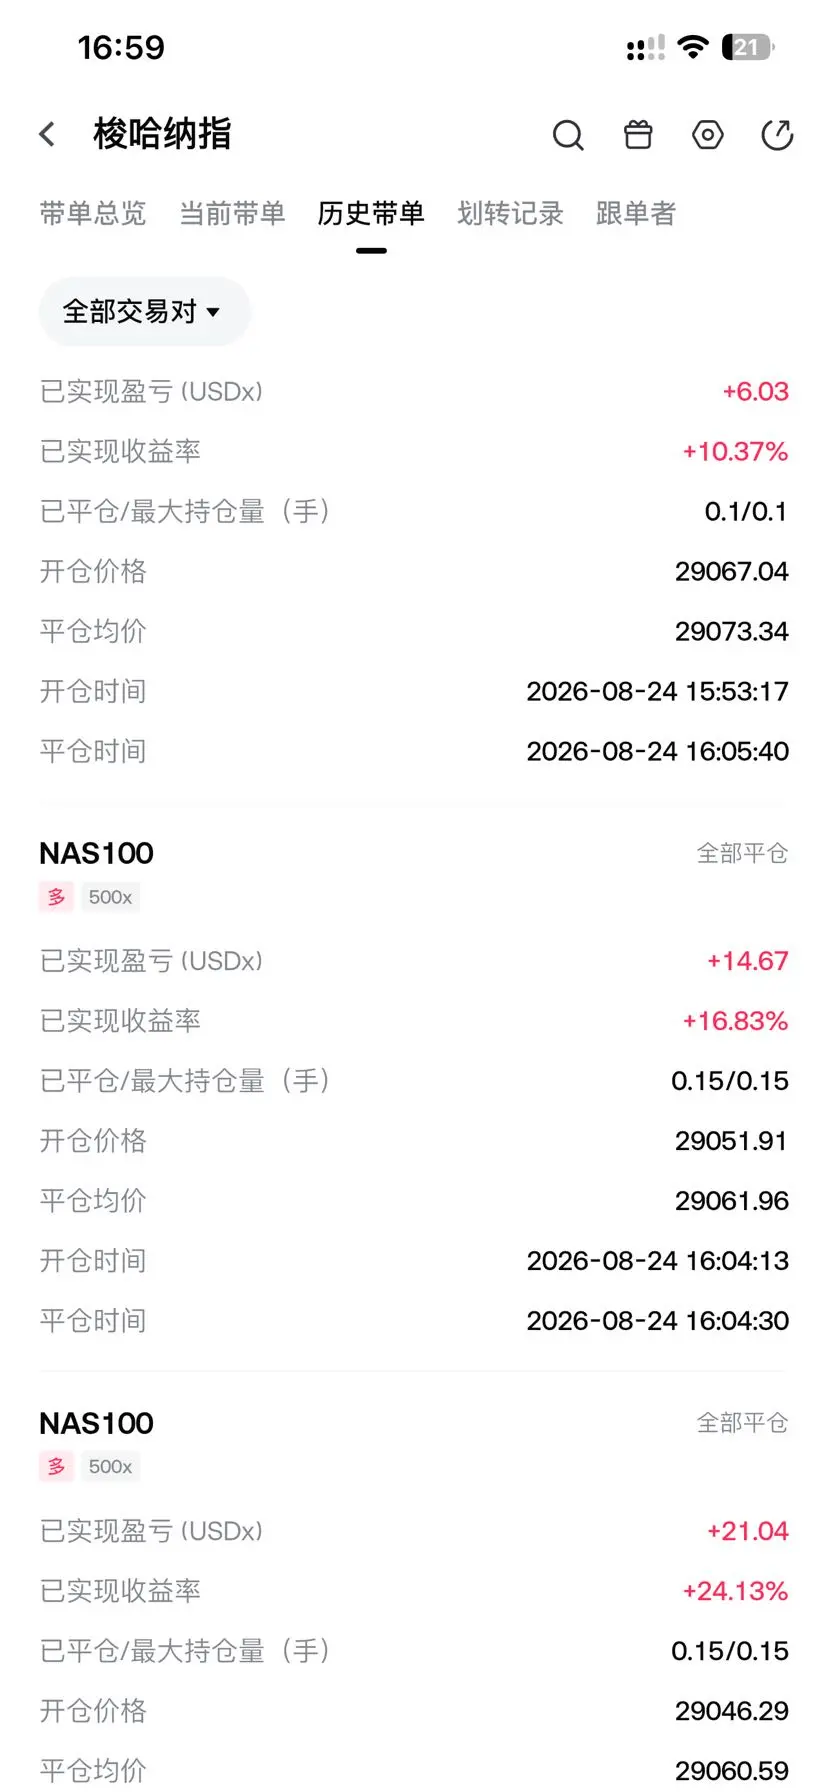
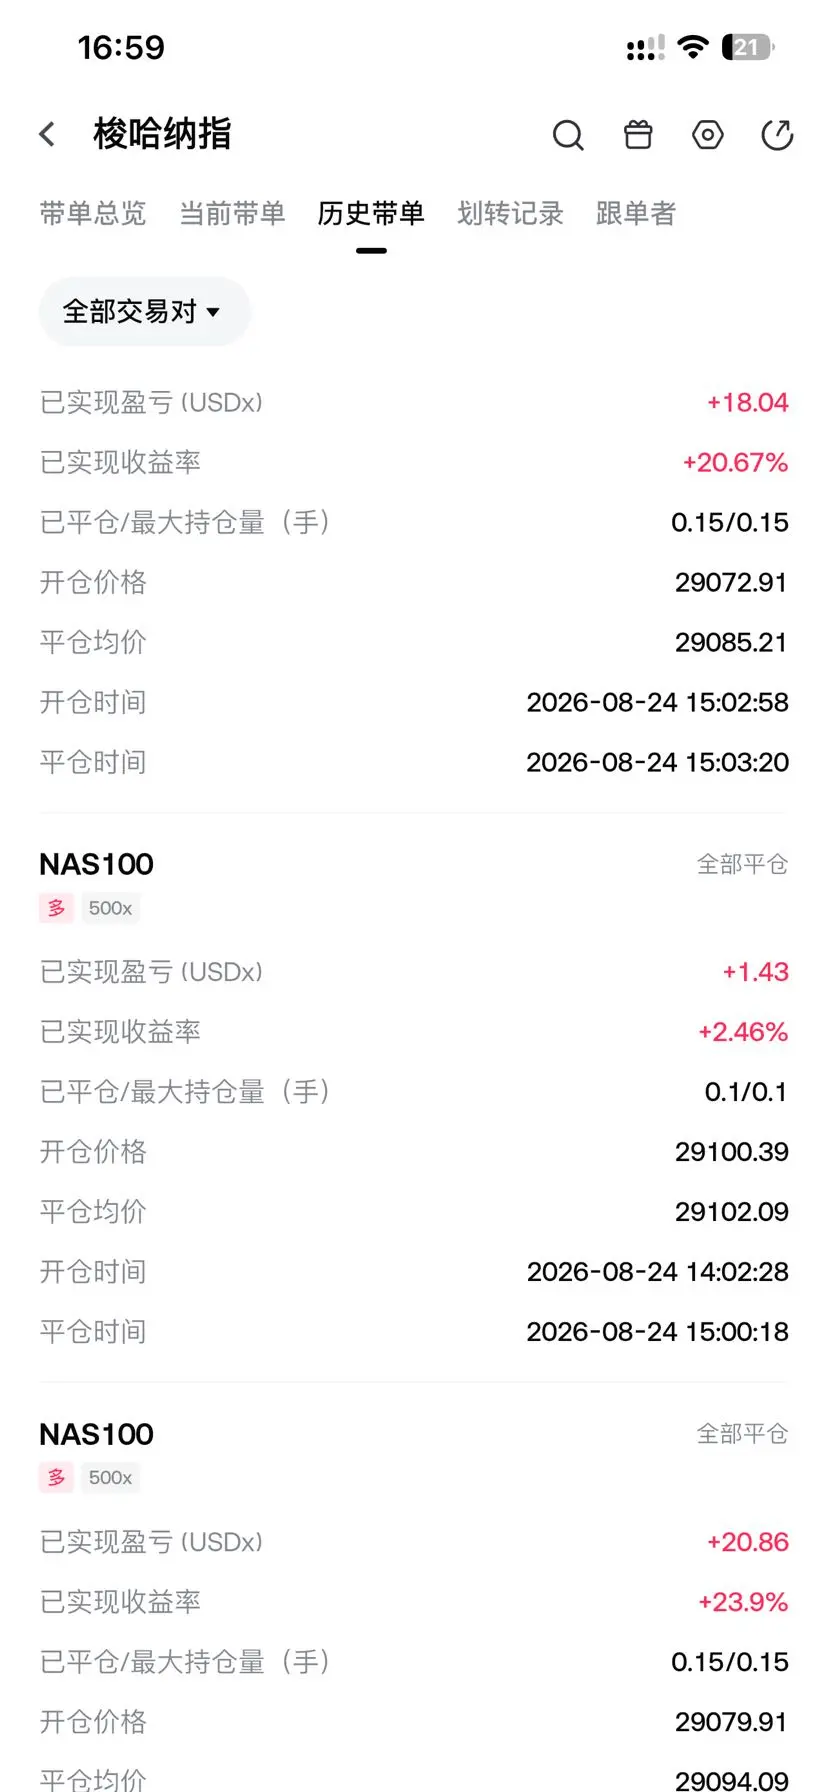
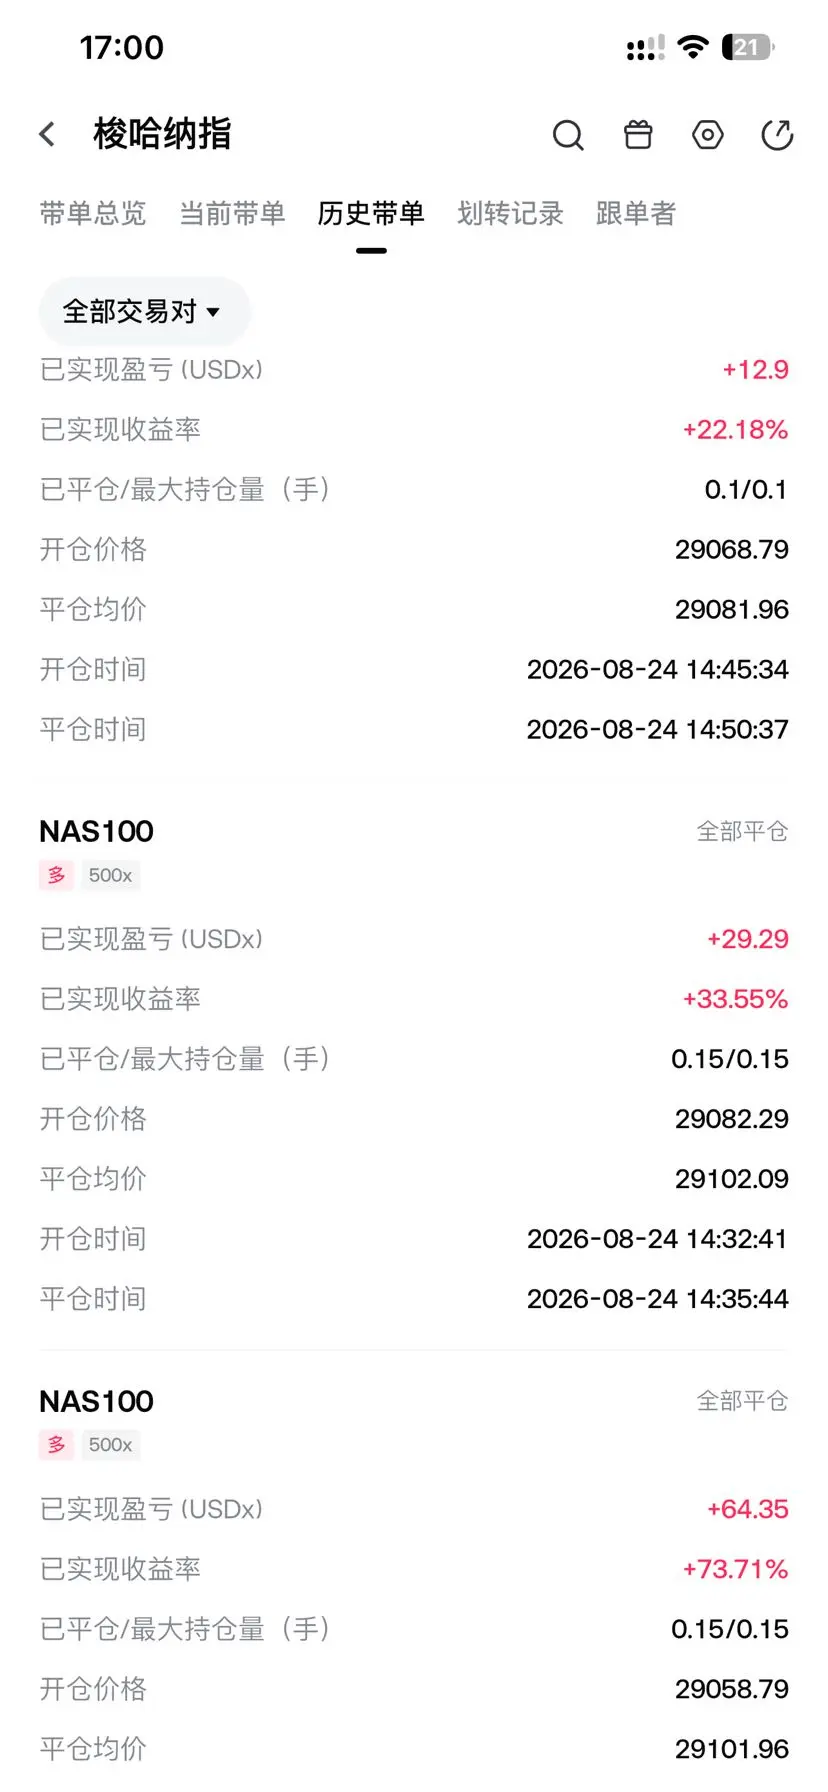
Even if it’s a bit tiring, it’s worth it. I’m now using over 300 in profits to trade; those interested can follow along.
View Original
post-image
post-image
post-image
post-image
  • Reward
  • Comment
  • Repost
  • Share
Good Morning Frens!🌤☕️ New week, new opportunities!
post-image
  • Reward
  • Comment
  • Repost
  • Share
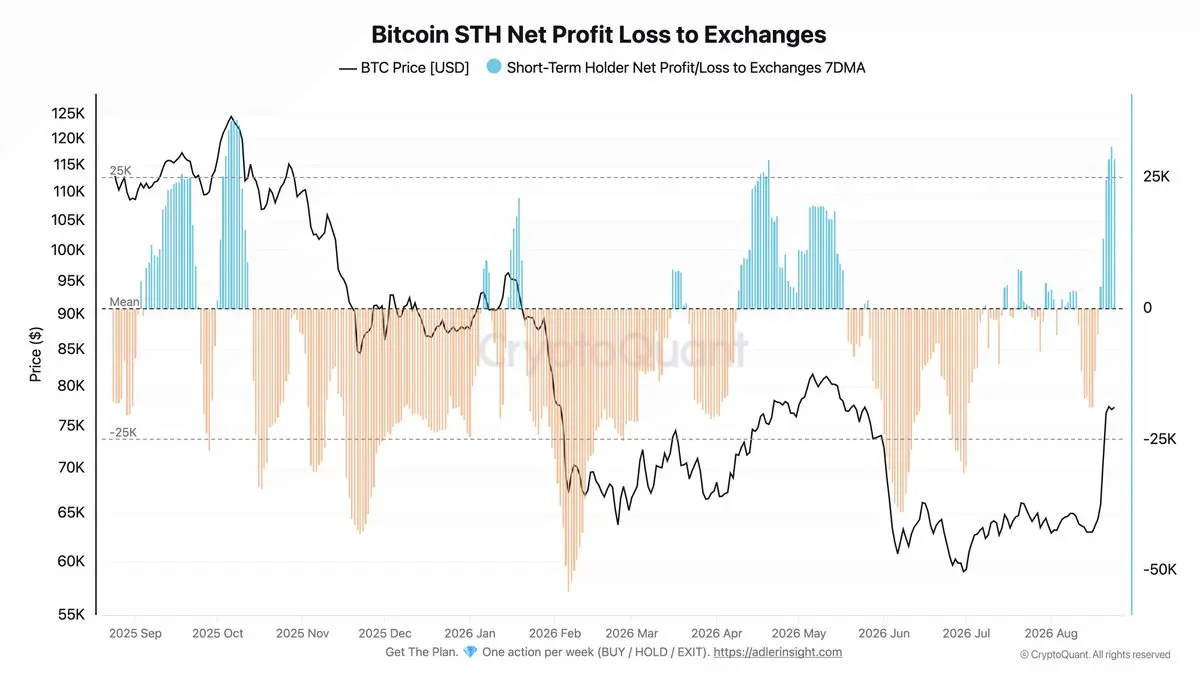
STHs are back in profit and are sending coins to exchanges.
The flow has exceeded the +25K threshold. Selling pressure is rising.
Full breakdown in Morning Brief #241 👇
FLOW-0.03%
post-image
  • Reward
  • Comment
  • Repost
  • Share
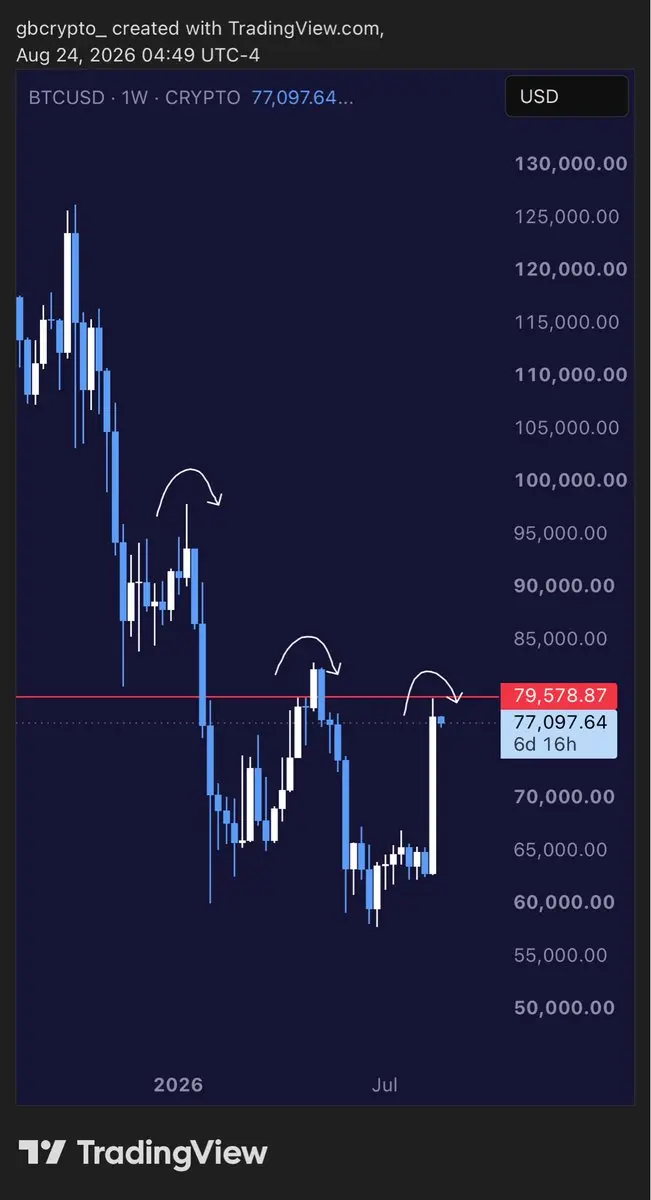
$BTC
It still baffles me how anyone can look at this chart and conclude that the low is in and we’re about to enter an “up only” phase.
The broader market structure simply doesn’t support that conclusion yet.
We can start discussing a potential structural shift once we see clear acceptance above 82.8K. Until then, I think it’s premature to assume the downside is over.
BTC1.08%
post-image
  • Reward
  • 3
  • Repost
  • Share
CryptoSpecto:
2026 GOGOGO 👊
View More
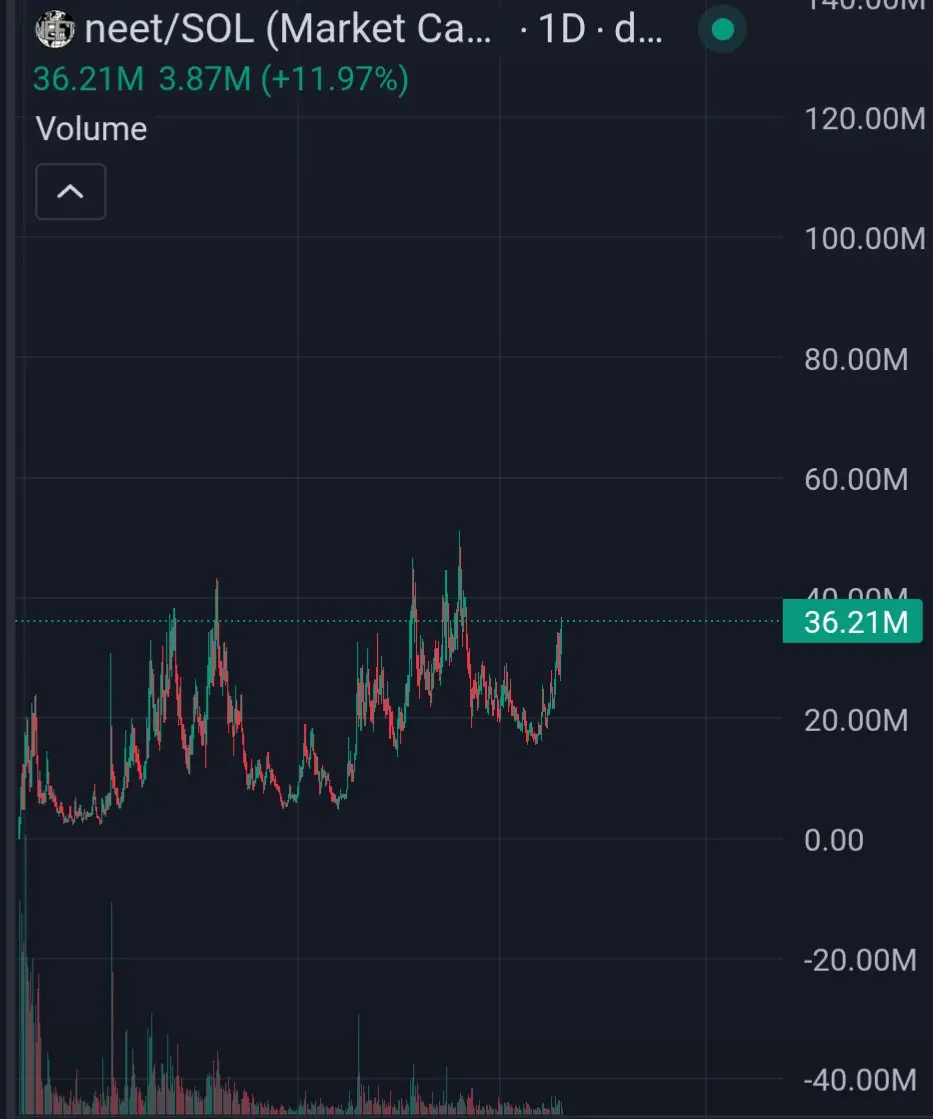
$neet is always edging a god candle
any day now
post-image
  • Reward
  • Comment
  • Repost
  • Share
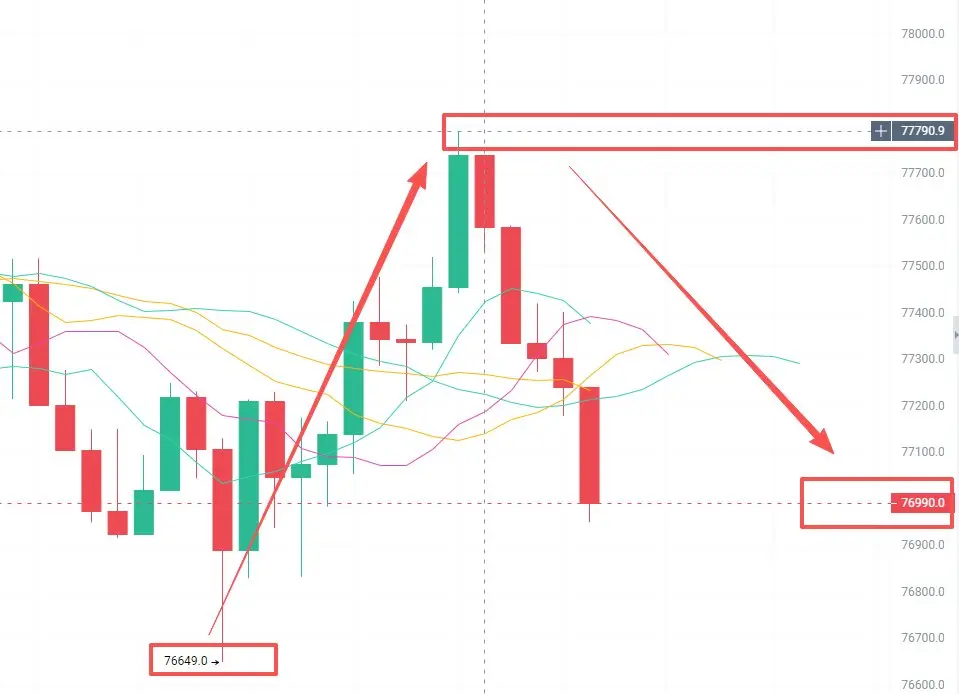
Bitcoin captured another 700 points on the intraday short, bringing the total captured to 1,500 points. I’ve now reversed into a long at 770 and am waiting to take profits.
The most comfortable state for intraday trading is not making money ten times a day.
It’s capturing one or two of the clearest trends throughout the day.
Filter out all the noise.
Don’t chase fake breakouts to the upside, don’t take fake breakouts to the downside, and only act when the real main move arrives.
The longer you watch the market, the more you understand what should be done and what isn’t worth wasting ammunition
BTC1.08%
View Original
post-image
  • Reward
  • Comment
  • Repost
  • Share
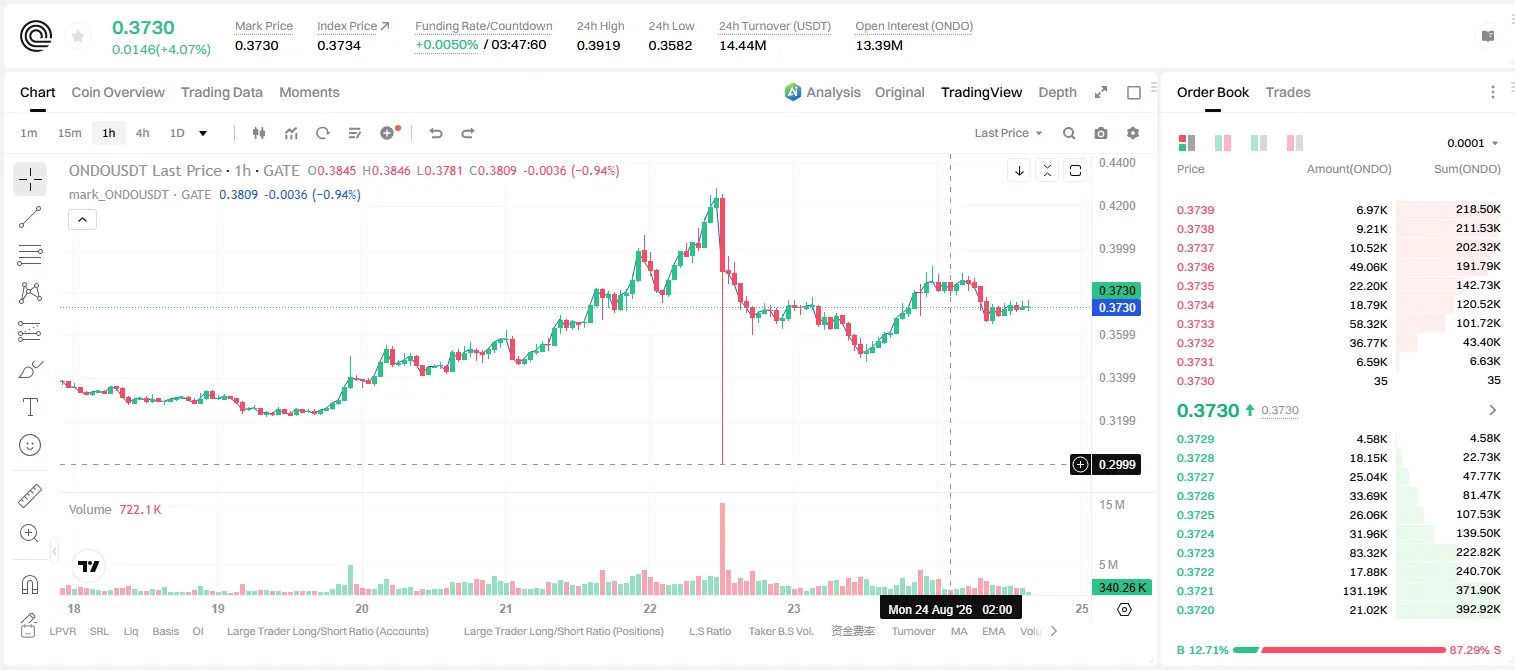
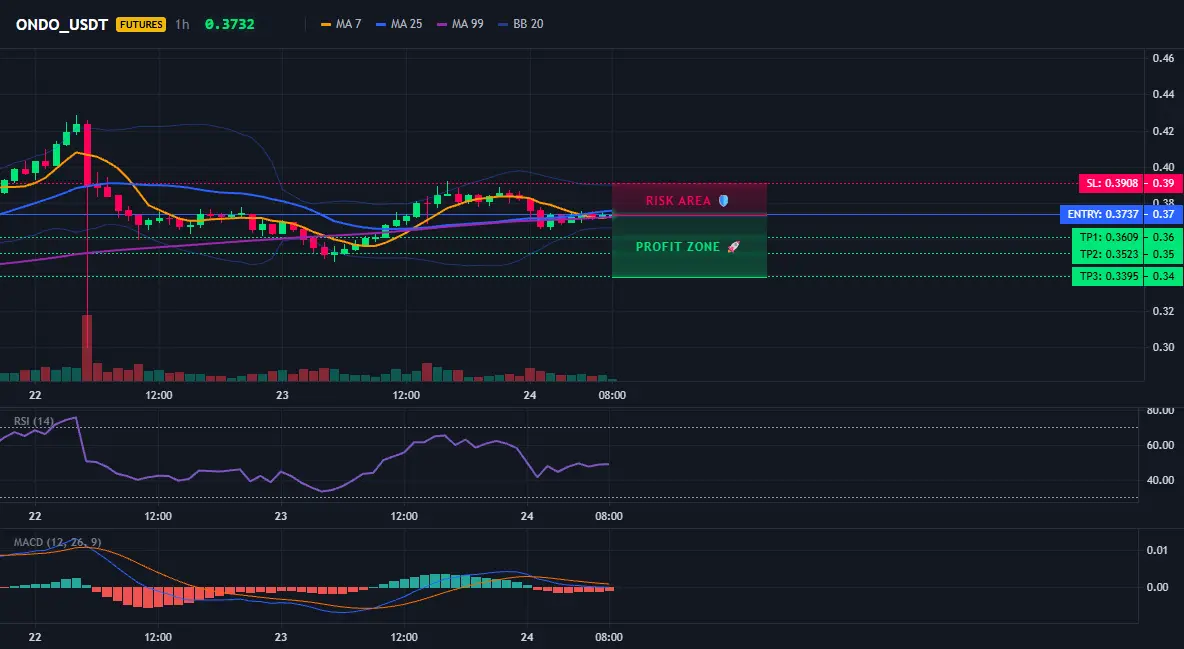
ONDO 4-hour short signal armed, but confidence is only 55%

$ONDO /USDT - SHORT

Trade plan:
Entry: 0.3719 – 0.3755
SL: 0.3908
TP1: 0.3609
TP2: 0.3523
TP3: 0.3395

Why watch this setup?
- The 4-hour EMA structure is bearish, but the 1D trend is still range-bound, not a one-sided market
- The 15-minute RSI is 49.78, neutral to weak, with a lackluster rebound and room for further short-term downside
- The 1-hour ATR is 0.0071, with moderate volatility, suitable for a swing short
- Key levels: Current price around 0.3737, with TP1 at 0.3609, TP2 at 0.3523, and SL at 0.3908
- Why now? The upper
ONDO4.45%
View Original
post-image
post-image
  • Reward
  • Comment
  • Repost
  • Share
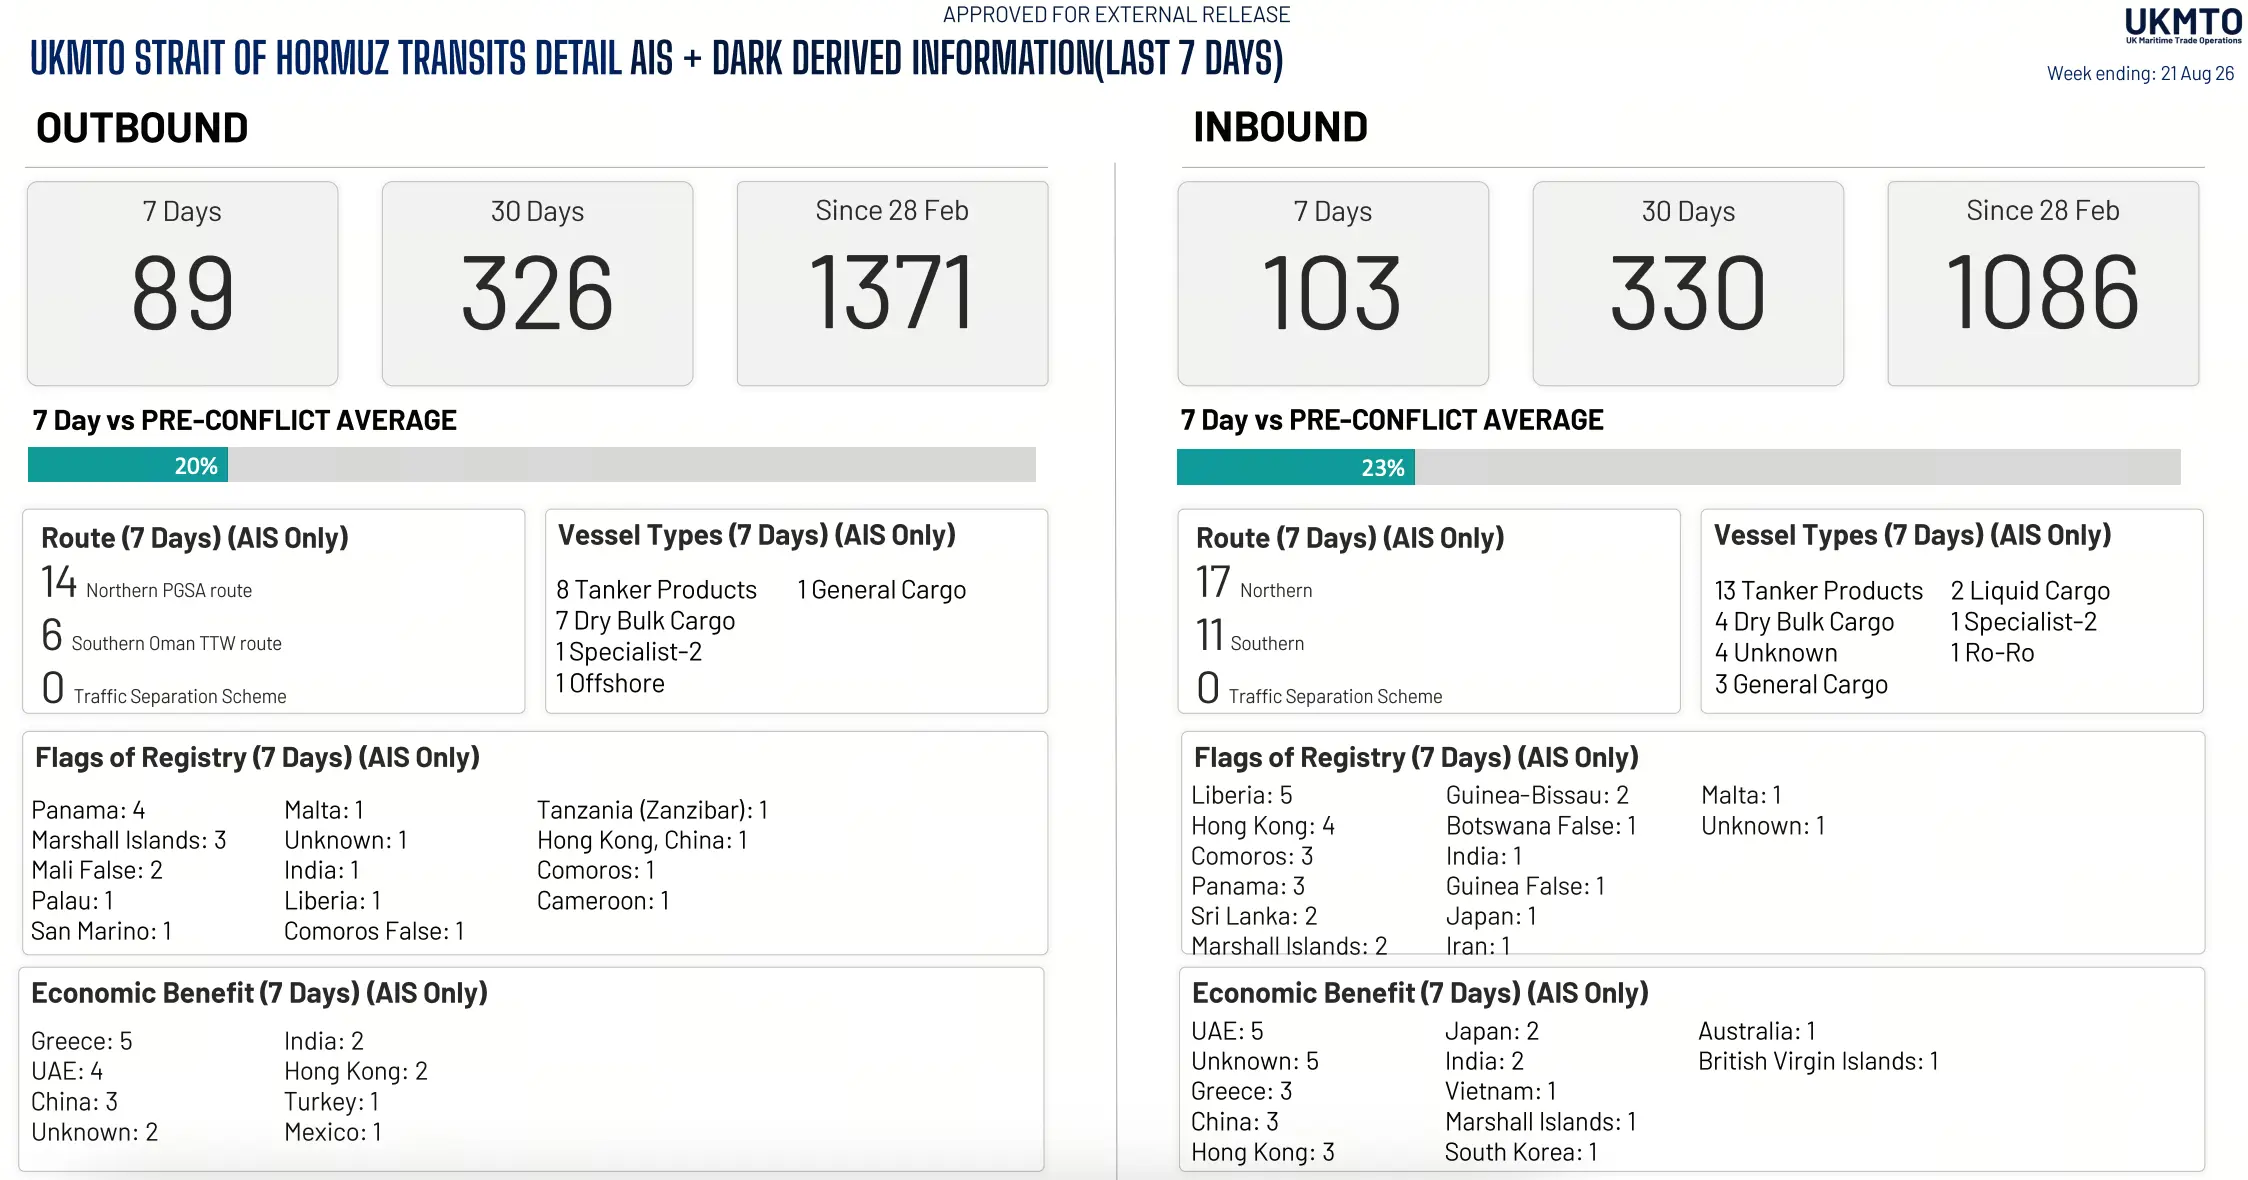
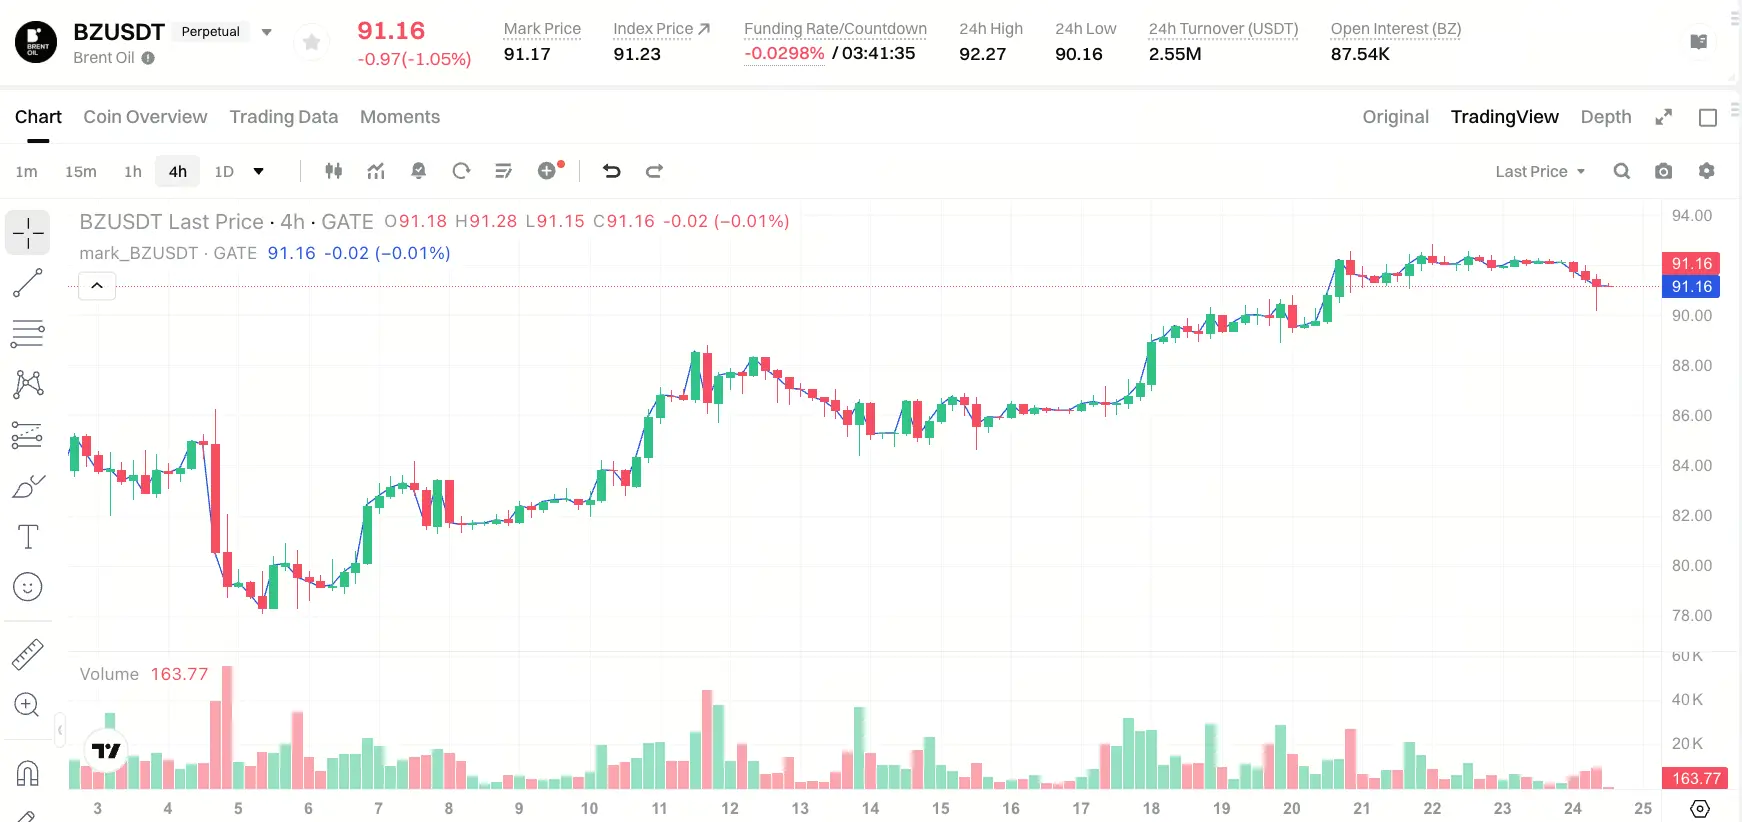
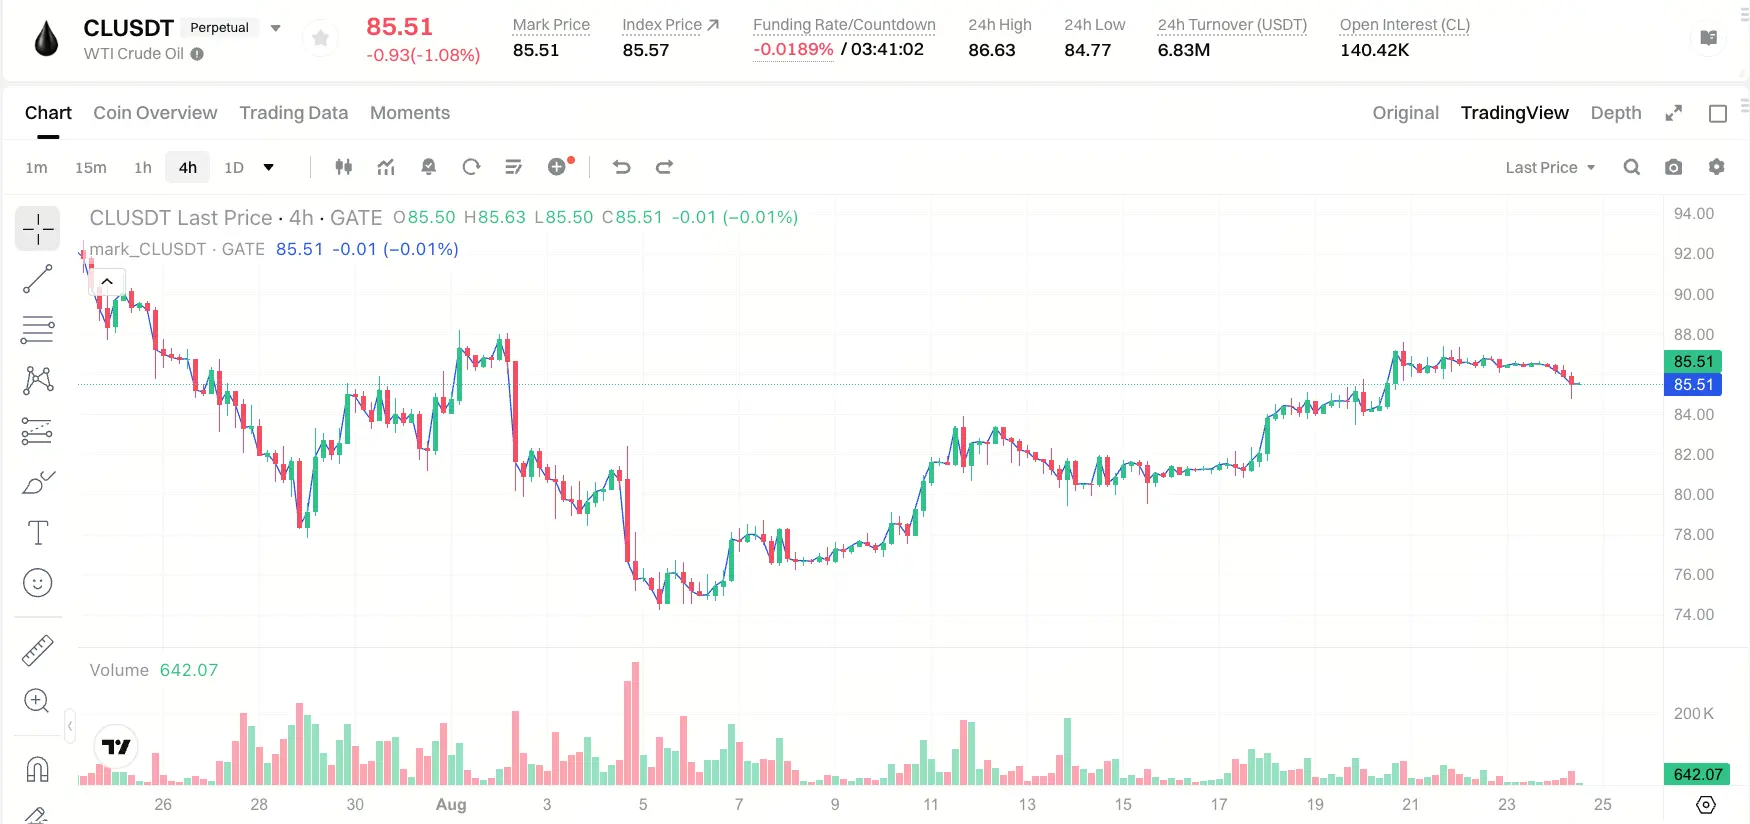
The headline looks bullish for supply relief: Hormuz traffic has jumped sharply and oil has pulled back. But the latest data suggests the market may be easing the geopolitical risk premium not declaring the supply crisis over.
On August 24, Brent was trading around $93, while WTI was around $86, both down roughly 1% in early trading. The decline came as traders reacted to signs of selective shipping recovery and positioned ahead of expected new U.S. sanctions on Iran.
The most eye-catching figure is the reported nearly 400% increase in vessel traffic over two weeks. Traffic rose from around 4
post-image
post-image
post-image
post-image
  • Reward
  • 2
  • Repost
  • Share
Venüs_:
To The Moon 🌕
View More
gm,
is a good day to have a good day. and to do something ridiculous.
🐸
post-image
  • Reward
  • Comment
  • Repost
  • Share
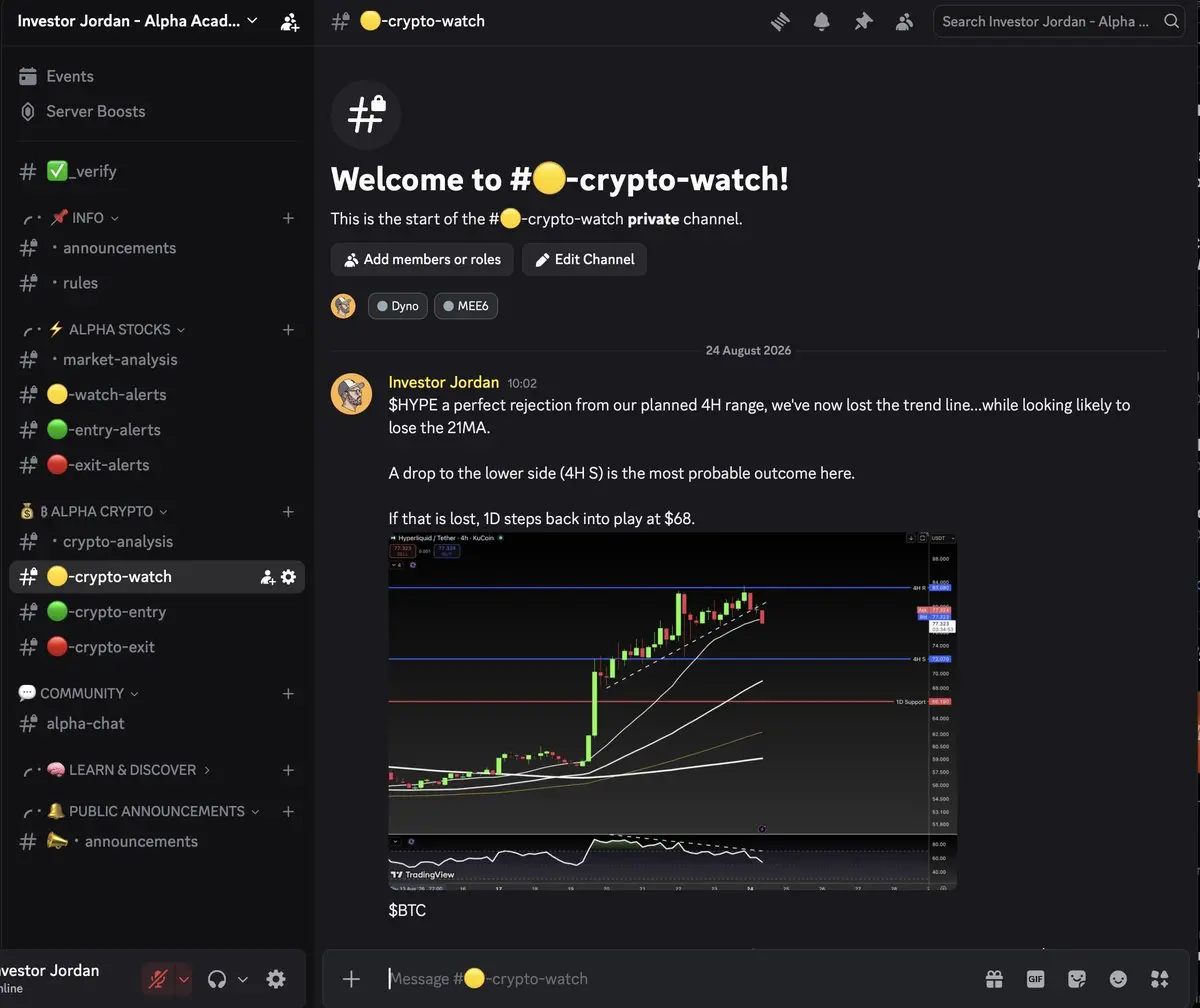
ALL 1,500+ subscribers now get access to my private Discord 🚨
Daily stock + crypto setups, alerts, charts and live portfolio updates.
Updated every day 📈
post-image
  • Reward
  • Comment
  • Repost
  • Share
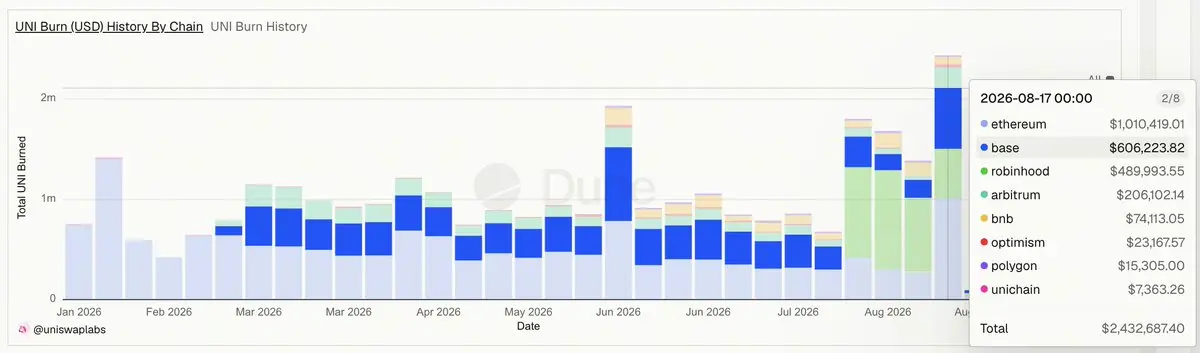
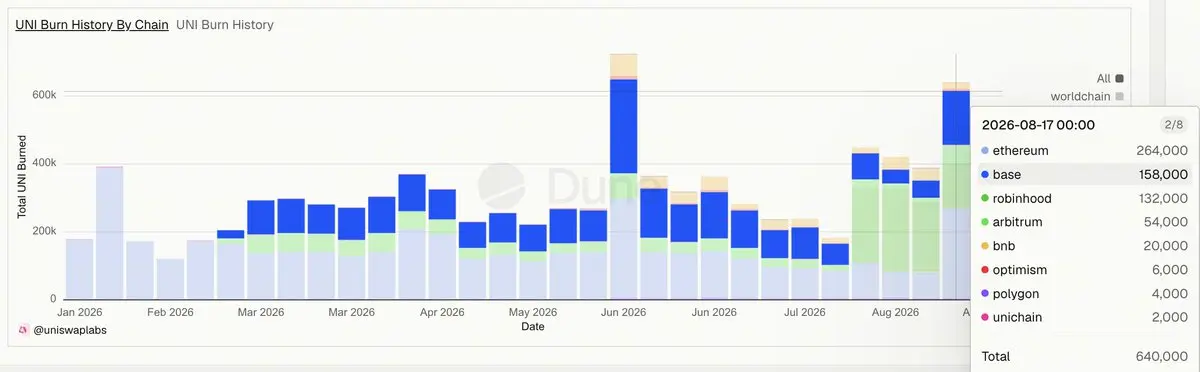
Last week, Uniswap trading activity burned over $2.4 million worth of UNI, setting a new all-time weekly high
At the same time, UNI burn value exceeded $1 million for four consecutive weeks for the first time ever
The weekly burn value of over $2.4 million corresponds to 640k UNI, the second-highest level ever in coin terms
The Meme + RWA craze sparked by Robinhood Chain has stimulated Base & Coinbase to some extent
For Uniswap, this can be considered a windfall, with Base and Robinhood Chain being the second- and third-largest chains for UNI burns after Ethereum
UNI5.21%
MEME0.86%
RWA2.67%
COING1.23%
View Original
post-image
post-image
  • Reward
  • Comment
  • Repost
  • Share
Load More

Join 40 M users in our growing community

⚡️ Join 40 M users in the crypto craze discussion
💬 Engage with your favorite top creators
👍 See what interests you
  • Pinned