Share your thoughts
placeholder
Article
$APT APT Buyers Trapped Again?
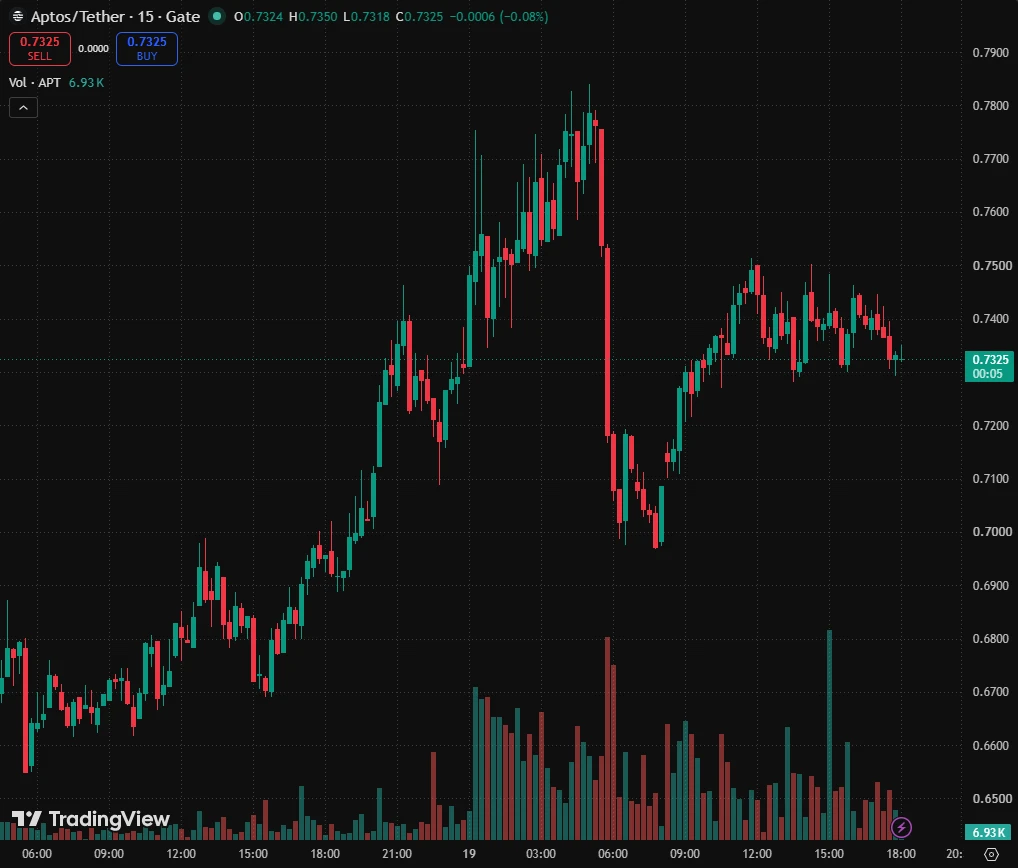
Yello Paradisers, are APTUSDT buyers about to get trapped again while price continues struggling directly below a critical intraday resistance zone?
APTUSDT has already shown us an important sequence. Price first pushed above the previous highs around the $0.77 area, attracting breakout buyers and taking liquidity resting above those highs. Instead of continuing higher, that move was aggressively rejected and followed by a sharp sell-off toward $0.70.
That rejection is important because it suggests the breakout above the highs acted as a buyers' trap rather than
post-image
APT+6.34%
Layout for Bitcoin, Ethereum, and Dogecoin
live-cover
LIVE893
Insiders are fading the bounce on SYMBOL while the 1h candle barely holds above 9.688.

$AVAX /USDT - SHORT

Trade Plan:
Entry: 9.639 – 9.737
SL: 10.161
TP1: 9.333
TP2: 9.097
TP3: 8.742

Why this setup?
Why now? The daily trend is range, so mean reversion is the path of least resistance and the 1h ATR of 0.19712 confirms enough volatility to push price toward the first target. The 15m RSI sitting at 62.61 shows momentum is still leaning bullish, which makes a short entry at the 9.639 to 9.737 zone a high-probability fade against that exhaustion. From entry, TP1 sits at 9.333 and TP2 at 9.09
AVAX+18.87%
#BOJHikesTo1.25%31YearHigh
JAPAN JUST CHANGED THE GLOBAL MACRO EQUATION
The Bank of Japan has taken another major step away from its ultra-low-rate era.
The BOJ raised its policy rate by 25 basis points, from 1.00% to 1.25%, bringing Japanese rates to their highest level in 31 years. The decision passed 7–2, showing that the policy shift still has meaningful disagreement inside the central bank.
But the most interesting part was not the rate hike itself.
It was the market reaction.
The yen weakened after the decision, USD/JPY moved toward the 157–158 area, and Japanese equities remained stron
BTC+0.48%
JPN225+0.23%
XAUUSD+0.83%
NDAQ+2.44%
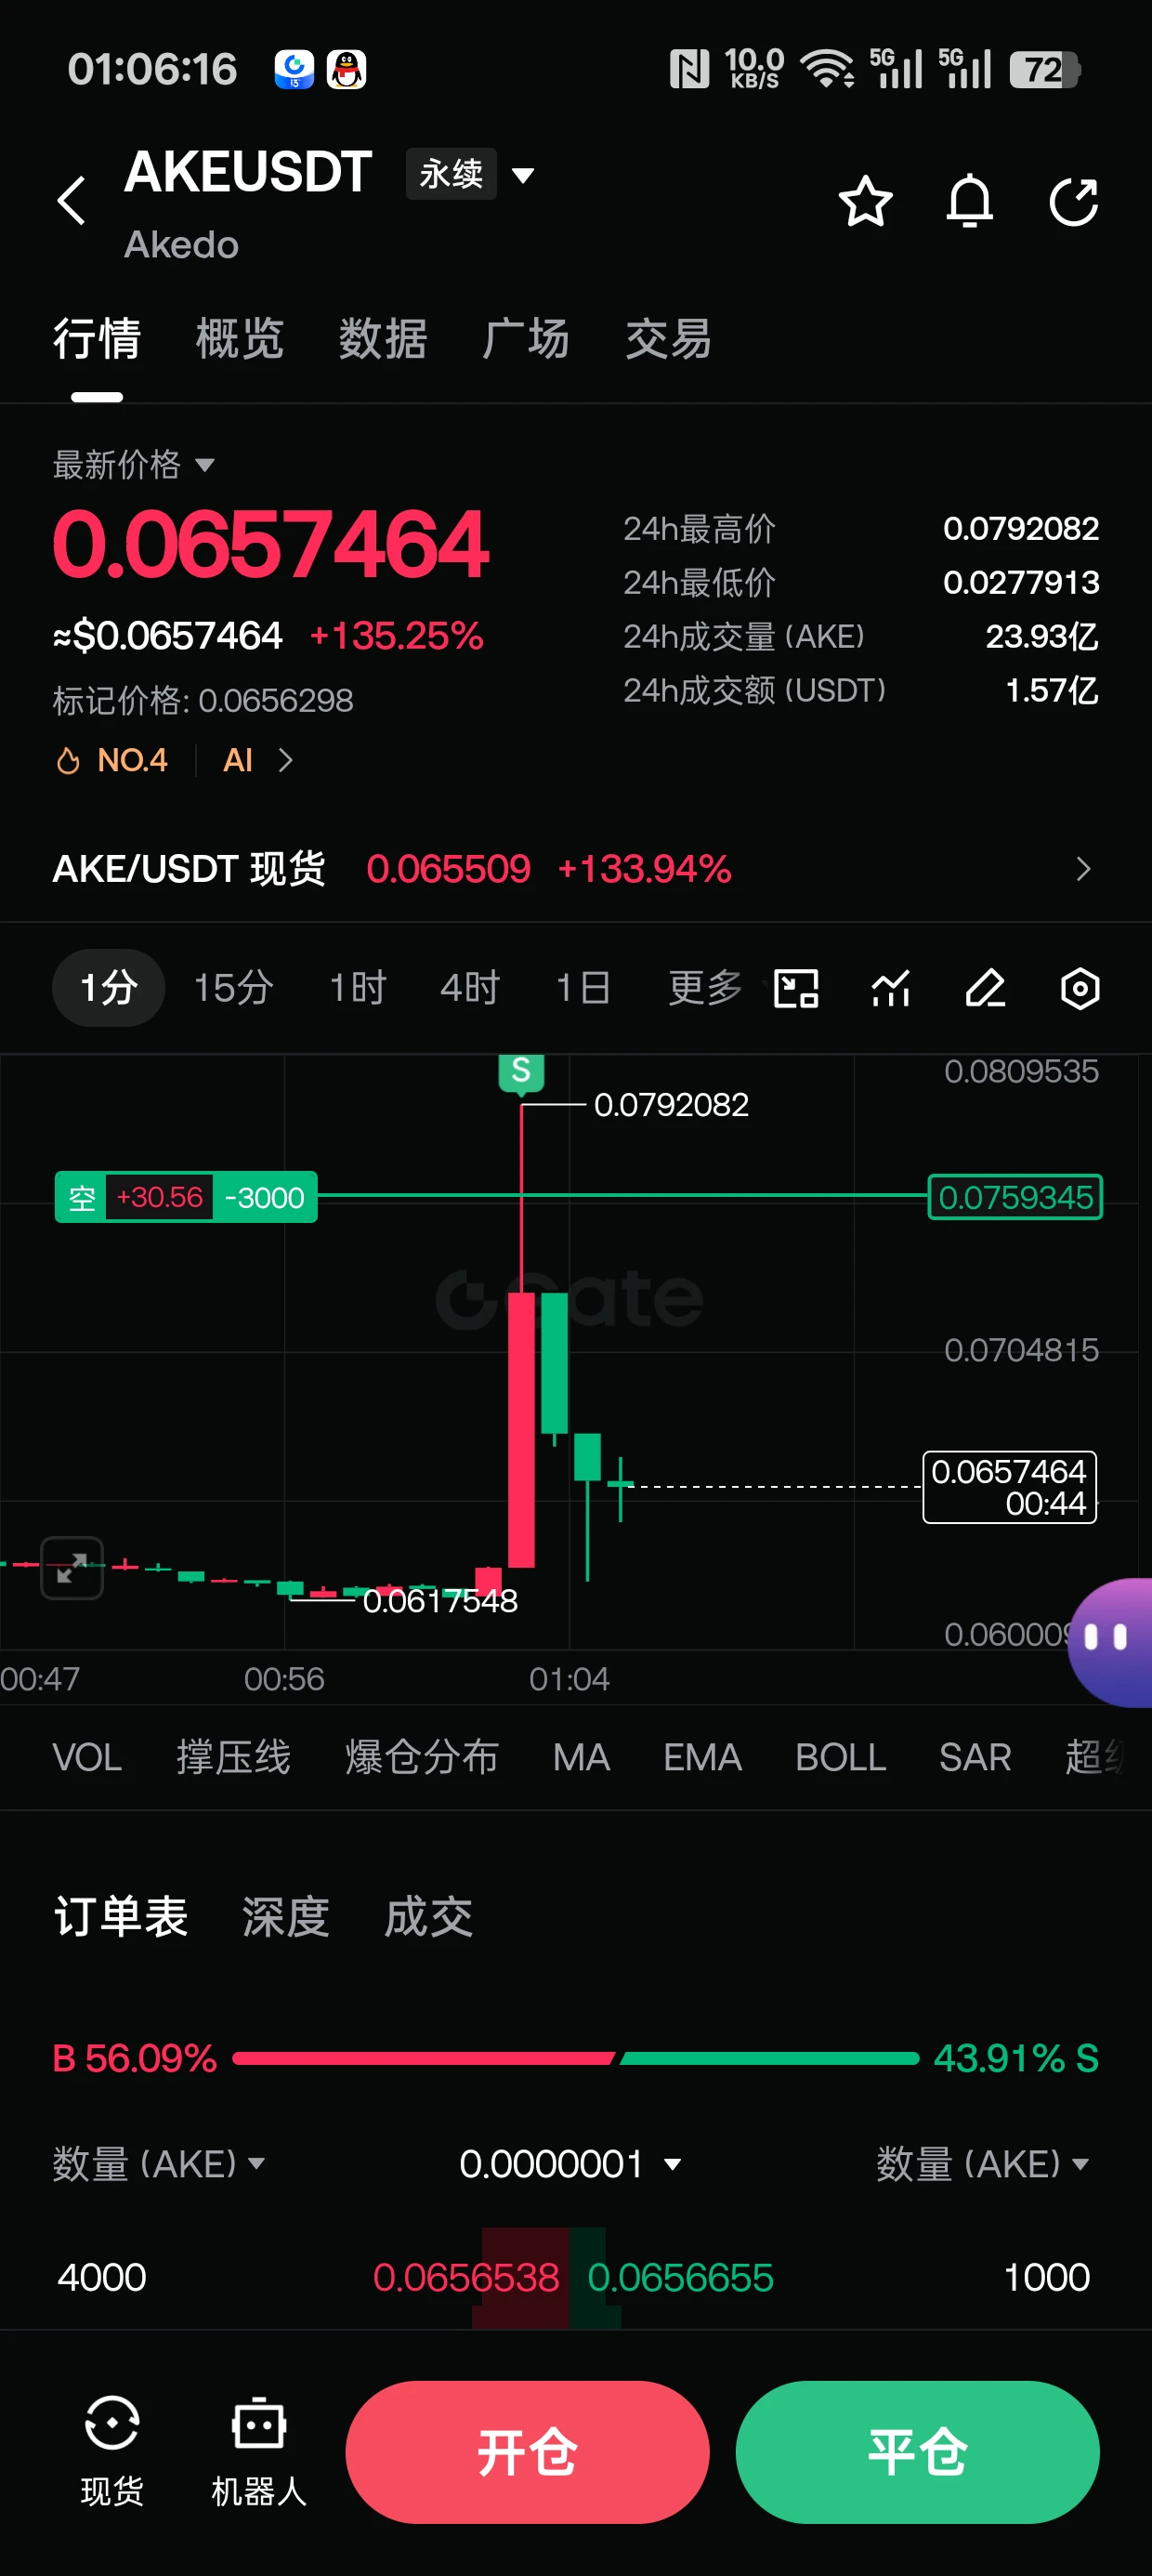
$AKE how high can it go? It’s pumping hard—definitely short it, but why do I feel this thing could rise to a few dollars? Could it replicate the previous shitcoin’s run to dozens of dollars, then go to zero? Why does it feel like the more I short it, the more it rises? What do you think?
post-image
AKE+72.17%
19 years ago, the first-generation iPhone began shipping.
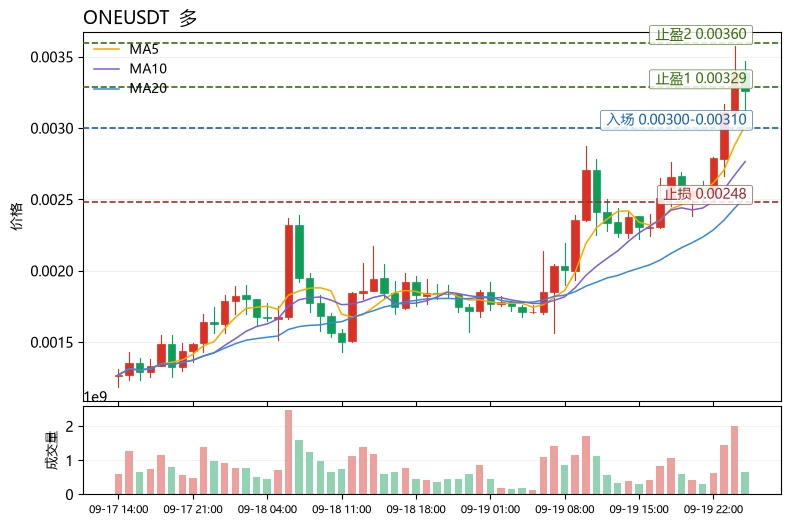
Many people see a coin surging over 24 hours and immediately think, "If I chase it, it can still rise," but overlook that horizontal comparison within the same sector is key to judging sustainability. $ONE is up 81.18% today with a trading volume of 45.7M, while $STRK is up only 17.33% and $ZEC only 3.18% over the same period. ONE is clearly leading its peers and is the only one of the three with a positive MACD histogram (+7.849e-05); the MACD for $STRK and $ZEC is bearish, making the relative strength gap clear at a glance.
Technically, ONE's MA5=0.0030184 has crossed above MA20=0.00251
post-image
ONE+136.64%
STRK+4.53%
ZEC+1.56%
$ZEC One of the strongest market moves.
From around $180 in March to over $1,580 now… nearly an 8x increase. After such a strong bullish rebound, a pullback is normal. This latest leg seems increasingly momentum-driven: breakout chasing and short covering may be adding further fuel. After surging to $1,595, some cooling-off is completely normal. The real test will come after volatility settles: $ZEC can it hold these higher levels and establish genuine demand? At $1,580, the risk is entirely different from at $180. Don’t blindly chase the rally. Long $ZEC.
ZEC+1.56%
crypto night update
live-cover
LIVE1,904
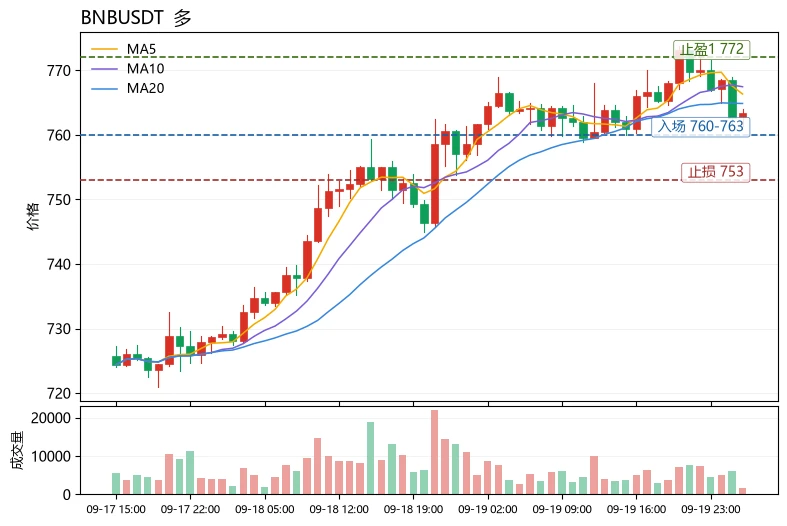
The Fear & Greed Index has surged to 71, into the greed zone, yet $BNB only edged down 0.18%; this divergence is the most unusual feature of today’s market. Normally, overheated sentiment tends to come with crowded longs, but the BNBUSDT funding rate is only +0.0081%, far below the +0.0100% for $ZEC and $NEAR , indicating that leveraged longs have not rushed in. Meanwhile, the price is stuck between MA5=766.3 and MA20=764.9, a typical battle among existing funds with no clear direction.
Technically, the MACD histogram at -1.016 remains bearish, RSI=51.2 is neutral to weak, and the Bollinger B
post-image
NEAR-4.29%
The trending search is back, but leverage hasn’t followed: this FIL move is genuinely built on volume
Damn, $FIL surged over 20% in a day and hit the trending searches—I’m bullish, but only buying dips, not chasing! Currently at 1.0886, with 24h volume of 32.08 million USDT and a volume ratio of 2.67x.

My view: bullish on the daily chart; no adding before 1.0967 breaks out.

First, leverage hasn’t entered the table: the funding rate is neutral at 0.0001, and OI is only up 0.03% from the 09-14 archive, making a sudden liquidation squeeze unlikely.

Second, the structure is healthy: MACD ha
FIL+19.62%
#USAIConceptStocksRally #GateSquareMidAutumnReunion
There is a genuine bid under US AI equities right now, but the accurate version of the story is a narrow, volatile rotation rather than a broad melt-up. On Friday, 18 September 2026, the S&P 500 closed at 7,650.50, up 0.17 percent, and the Nasdaq Composite finished at 26,522.55, up 0.39 percent, while the Dow Jones slipped 0.18 percent to 51,682.64 for its third consecutive weekly decline. Chips and AI infrastructure did the heavy lifting. Most of the rest of the market simply did not participate.
That rally has also survived two serious sho
  • 1
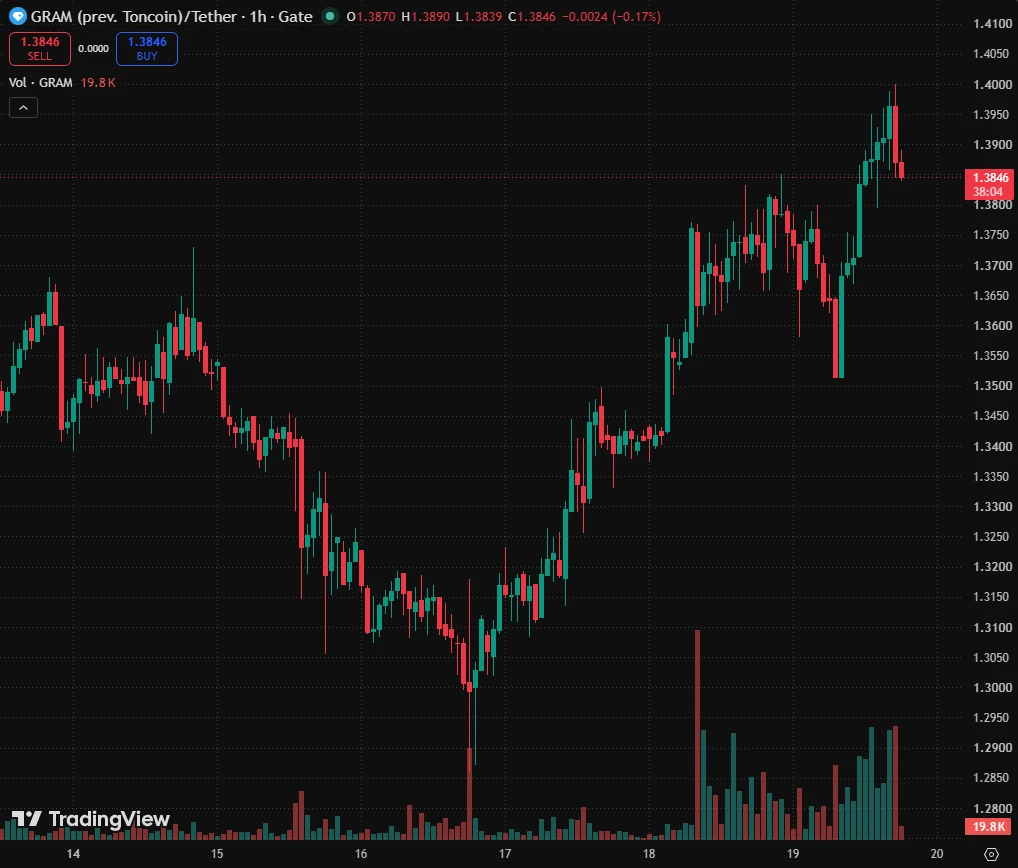
$GRAM GRAMUSD Analysis
GRAMUSD
Market Structure Analysis:
GRAM is bullish on the 1H chart, with higher highs and higher lows forming after the previous bottom.
Entry & Exit Signal:
Buy Entry: 1.3950
Stop Loss: 1.3851
Targets: 1.4148 R/R:2 - 1.4103 - 1.4320
Key Support & Resistance:
Key Resistance: 1.4103 / 1.4320
Key Support Area: 1.3851 / 1.3514 / 1.3180 / 1.2985
⚠Risk Management:
Maximum 1% risk per trade.
post-image
GRAM+0.39%
Everyone's chasing $ETH /USDT highs but this 84-score setup says otherwise.

$ETH /USDT - SHORT

Trade Plan:
Entry: 2637.71 – 2646.59
SL: 2697.59
TP1: 2600.57
TP2: 2572.85
TP3: 2531.27

Why this setup?


Debate:
Are we hitting TP2 or getting trapped by the daily trend?

⚠️ Personal market analysis only. NFA — manage risk and DYOR.
Educational content, not investment advice or a recommendation to buy, sell, deposit, or withdraw any asset. No paid promotion or referral/affiliate links.
ETH+0.74%
#日股地产电力半导体板块走强 #Gate广场中秋团圆局 Japan’s latest stock-market session looked like a broad Nikkei rally on the surface, but the internal data tells a much more concentrated story. The Nikkei 225 closed at 65,018.95, gaining 882.70 points or 1.38%, after trading between 64,403.85 and 65,436.57. Trading value across the Tokyo Prime market reached approximately ¥10.40 trillion, with about 2.86 billion shares changing hands. The headline was therefore strong, but the distribution underneath it is where the real sector-rotation signal appears.
① Nikkei vs TOPIX — the first warning that this was not a unif
post-image
JPN225+0.64%
INDEX-19.64%
USDJPY+0.58%
The established public chain $AVAX has pumped. Based on the pattern of ecosystem correlations, $JOE should pump as well. AVAX is currently undergoing a weekly-level rebound and has already broken through the daily resistance level. Under normal circumstances, JOE could be accumulated, but its trading volume is too low, so it can only be treated as a shitcoin for a gamble.
post-image
AVAX+18.77%
JOE+10.08%
Momeaze turns a school flyer photo into calendar events you can add with one tap.
Snap the schedule, review what it found, hit Add. Mayla also suggests prep before games and plans dinner around the day you are actually having.
Would you let an app carry the mental load?
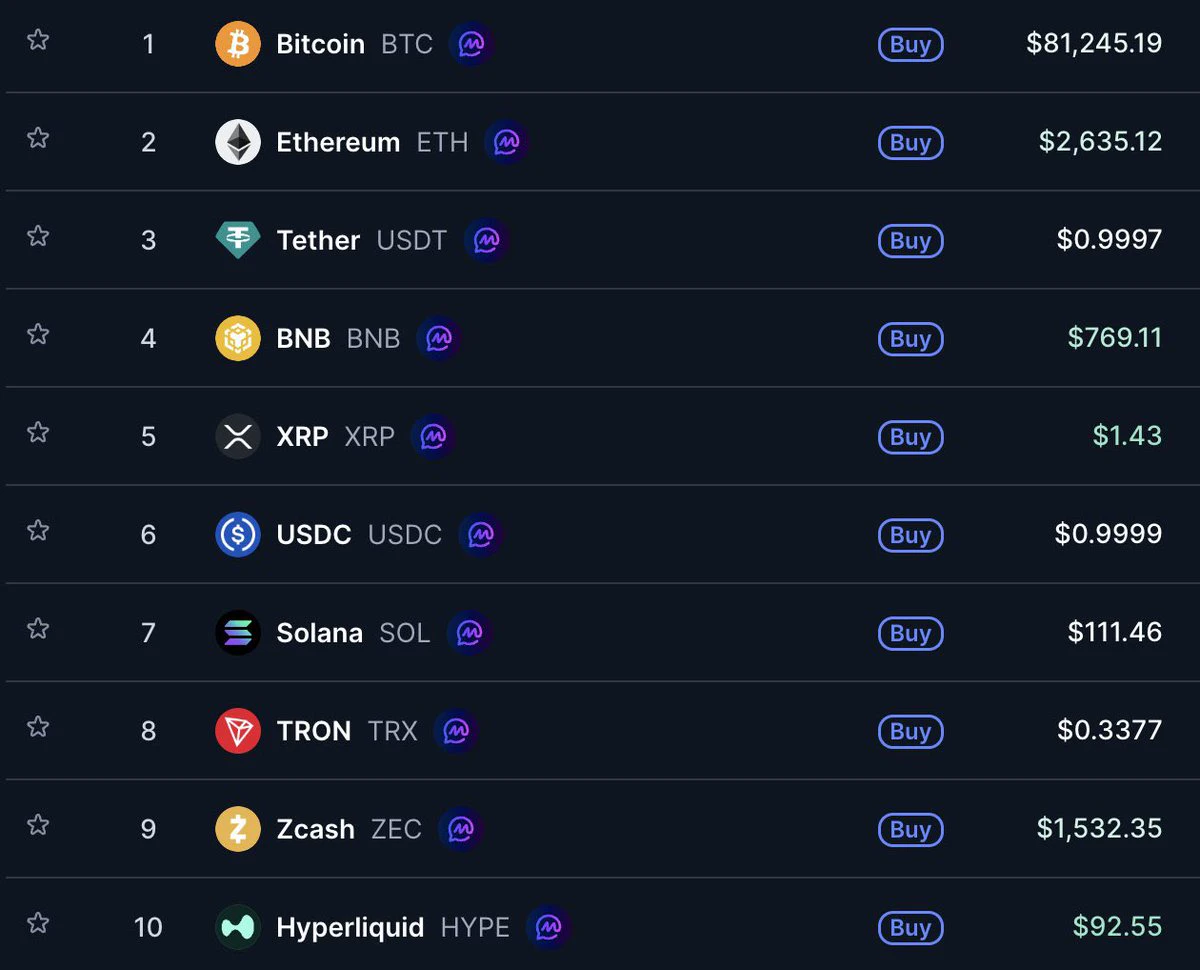
Crypto holders, we’re finally seeing some life again.
$BTC above $81K, $ETH around $2.6K, and altcoins are waking up too.
now let’s see if it can hold.
post-image
BTC+0.48%
ETH+0.80%
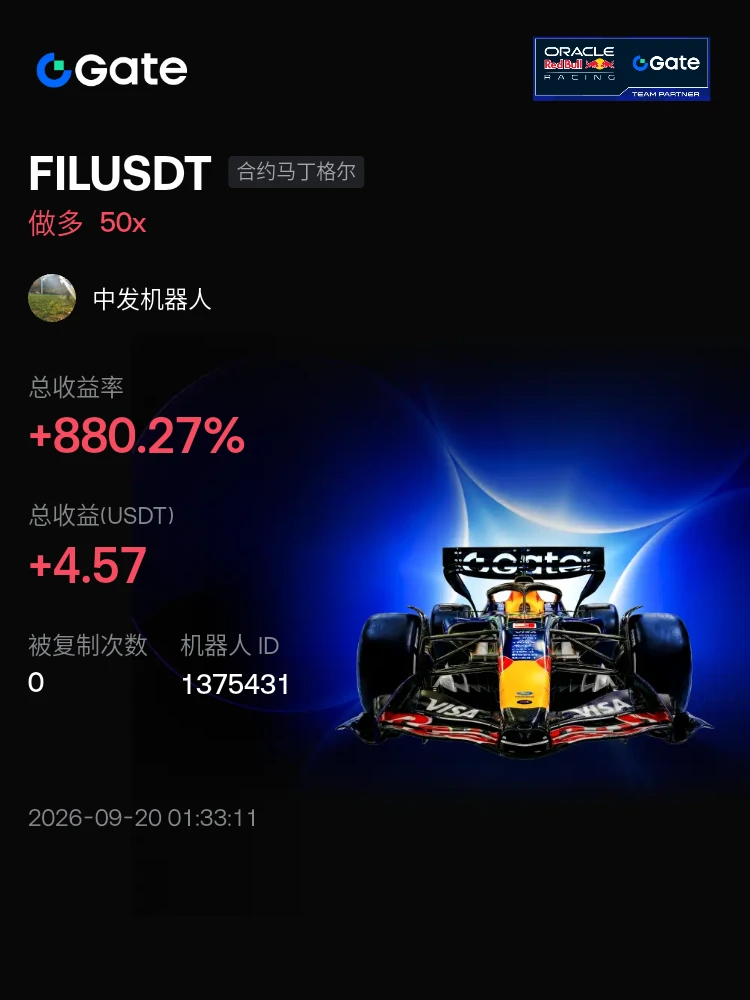
#交易机器人 I’m using the FILUSDT Futures Martingale Bot on Gate—come copy trade with me.
post-image
Load More

Join 40 M users in our growing community

⚡️ Join 40 M users in the crypto craze discussion

💬 Engage with your favorite top creators

👍 See what interests you

Trending Topics

JapanRealEstatePowerChipStocksRise

59.64k Views4.49k Discussing

Japan's Nikkei extended gains on Sept 18, with real estate, power, and semiconductor sectors leading. Gate covers over 12,800 global stocks and ETFs, offering one-stop USDT trading across US, HK, Korean, and Japanese markets. [👉 Read more](https://www.odaily.news/en/newsflash/518749)

USAIConceptStocksRally

34.36k Views1k Discussing

GateTopsStockPerpetualCoverage

38.62k Views2.59k Discussing

View More