

Square
Following
Hot
News
Profile
Share your thoughts
placeholder
Article
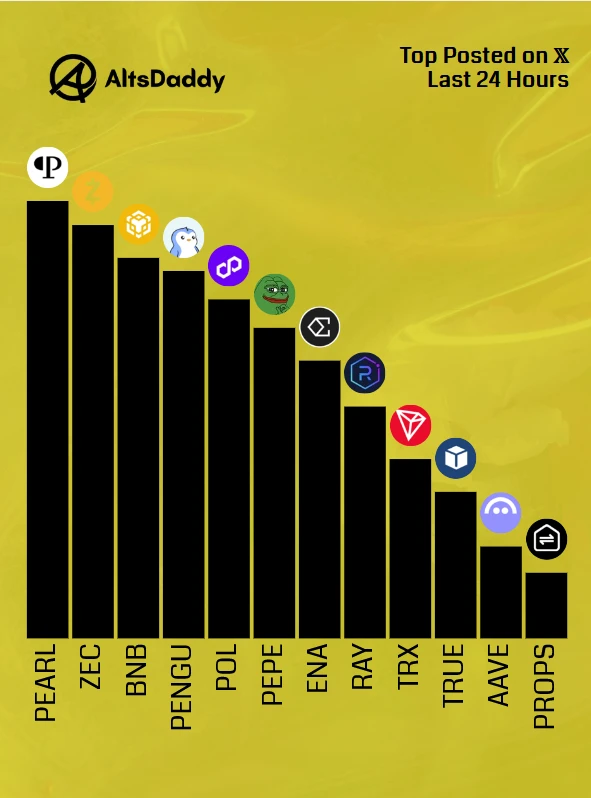
🎗️ Saturday’s Top Posted #Altcoins 🎗️
1️⃣ $PEARL
2️⃣ $ZEC
3️⃣ $BNB
4️⃣ $PENGU
5️⃣ $POL
6️⃣ $PEPE
7️⃣ $ENA
8️⃣ $RAY
9️⃣ $TRX
🔟 $TRUE
1️⃣1️⃣ $AAVE
1️⃣2️⃣ $PROPS
Runner ups: $DRV, $TAO, $QTC, $GRASS, $STRX
#Altseason2026 #Altcoins $DDY
post-image
PEARL-2.04%
ZEC+1.16%
BNB-0.76%
PENGU+0.40%
POL-0.19%
Total crypto market cap exceeds $2.60 trillion, with Bitcoin dominance at 59.9 percentage
live-cover
LIVE2,906
Trenches
IDOL
I
bade
b
IDOL
0x3b...ab07
Market Cap
$.
Change
.
24h Vol
$.
Holders
.
Q
Q
bade
b
Q
0xc0...0589
Market Cap
$.
Change
.
24h Vol
$.
Holders
.
ZIG
Z
bade
b
ZIG
0x8c...1145
Market Cap
$.
Change
.
24h Vol
$
Holders
.
SAFU
S
bade
b
SAFU
0x7c...7777
Market Cap
$.
Change
.
24h Vol
$.
Holders
.
GTA6
G
bade
b
GTA6
4kjr...zDnz
Market Cap
$.
Change
.
24h Vol
$.
Holders
.
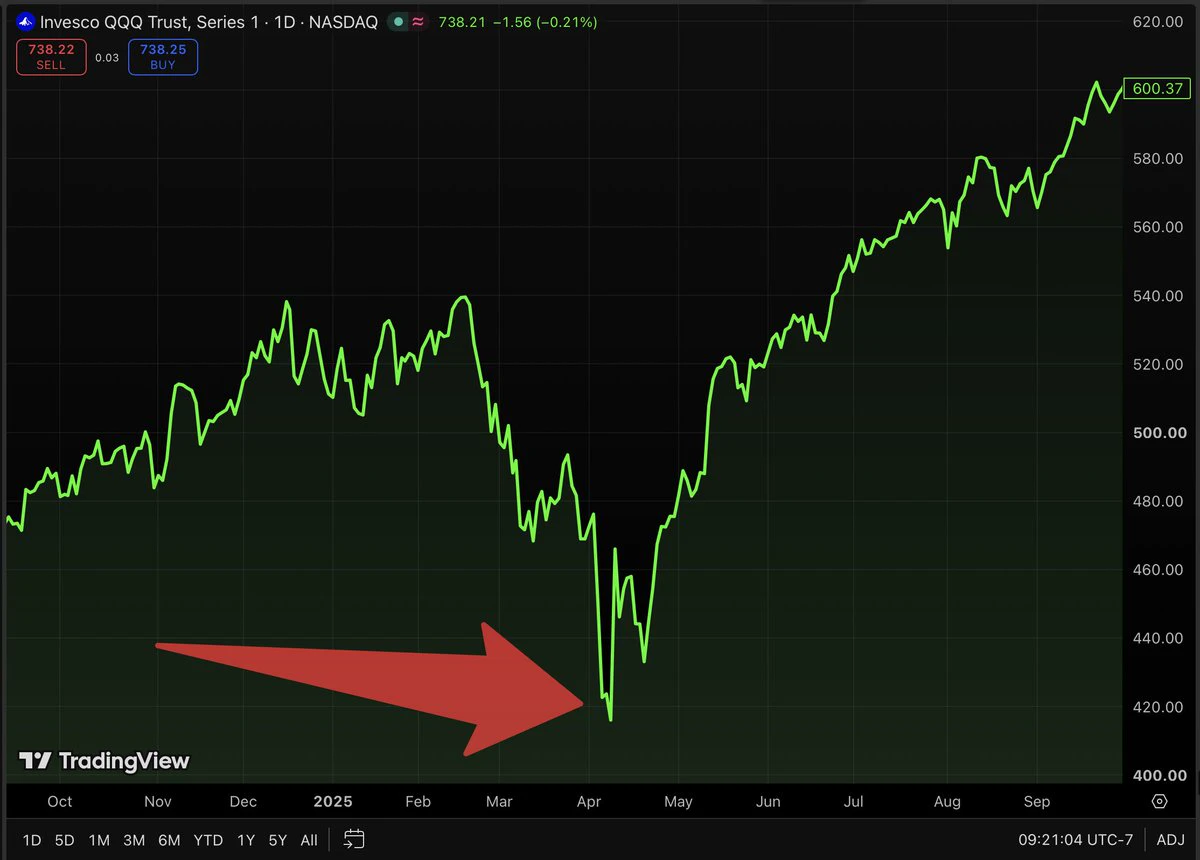
The most underrated thing about selling a 2 year portfolio secured put...
You don't have to hold it for all 2 years.
April 2025. Tariff panic. Everyone was scared & paying top dollar for puts to protect themselves. So I sold them 2 year puts.
About 3 months later the market had bounced... & nobody wanted to pay up for puts anymore. Everyone wanted calls again.
The puts I sold for top dollar were suddenly worth a fraction of that. I bought them back & kept roughly 75% of the premium.
I was in the trade for about 3 months out of 24.
That wasn't theta doing the work. The share price went up AND t
post-image
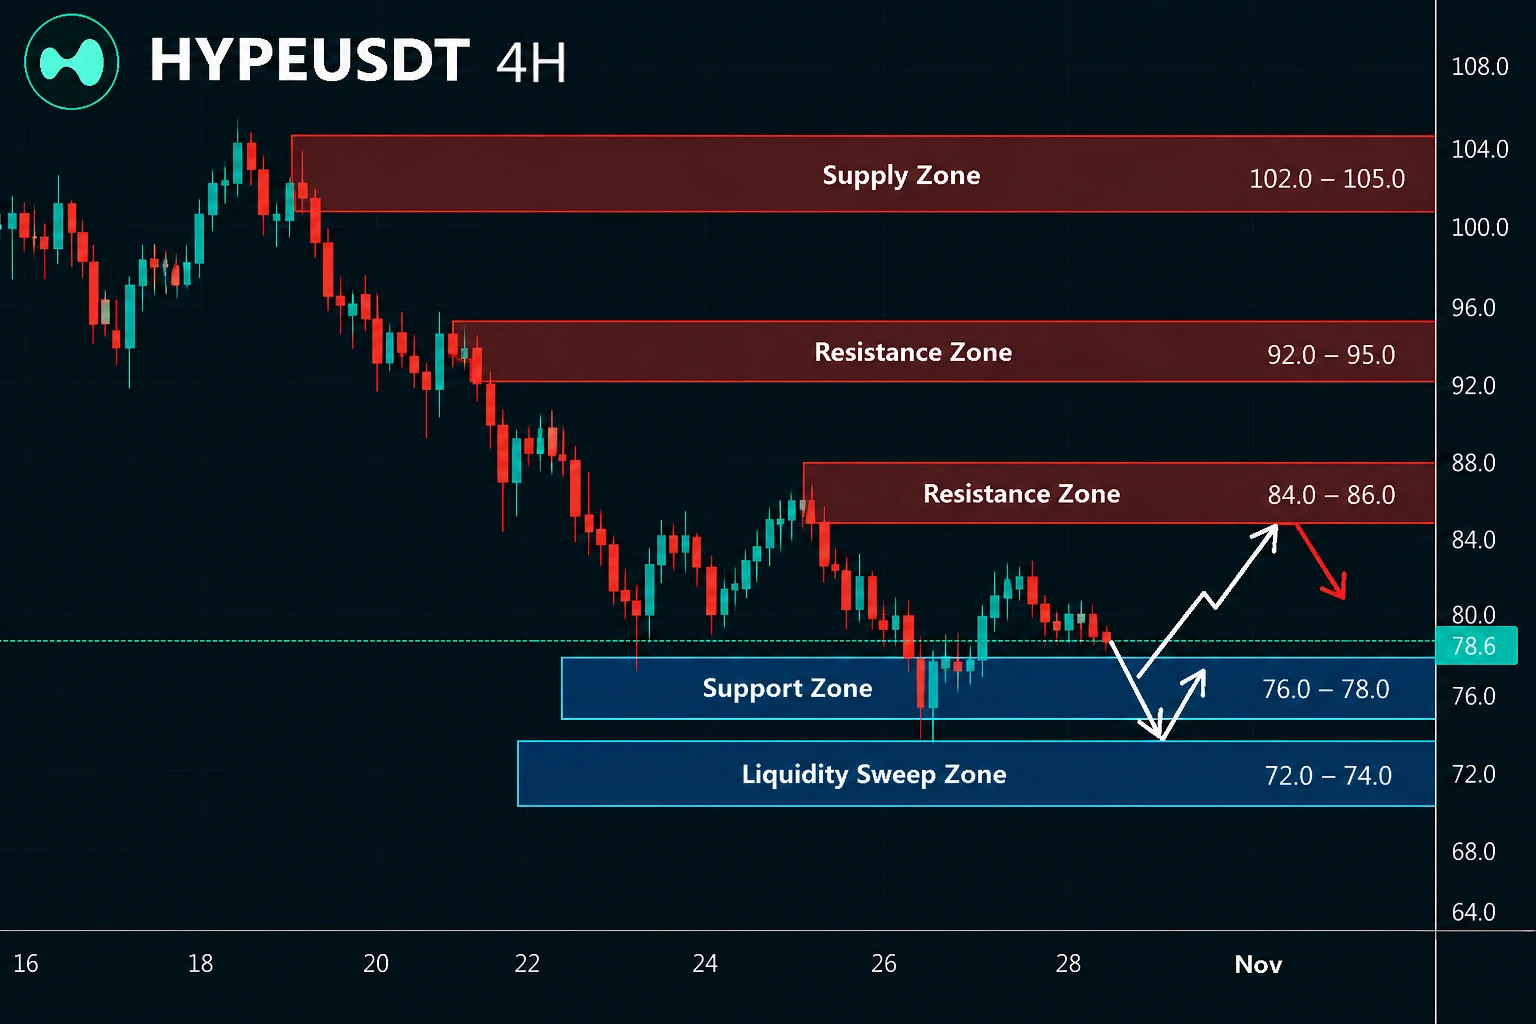
$HYPE Sell-Off Sparks Debate After Deleted Tweet
At The post points to a familiar crypto reflex: headline-driven selling can outrun the underlying reporting. With no price, volume, or official confirmation provided, watch whether credible follow-up validates the claim-or if liquidity is chasing a deleted social-media signal.
Bullish 58%
42% Bearish
The sell-off was triggered by deleted posts and may be an emotional overreaction
Financial Times reporting boosts the event's credibility and attention
HYPE faces selling pressure, with short-term market sentiment weakening
Deleted posts trigger co
post-image
HYPE+0.24%
Official images of the 2027 Lynk & Co 08 EM-P have been released; it debuts on November 5. It features roof-mounted LiDAR and a panoramic sunroof, a fastback design with an integrated spoiler, and an orange-red body with a contrasting black roof. The 230 Ultra-Long-Range Max version was already available in June, starting at 169.8k yuan for a limited time, with a CLTC pure electric range of 230 km.
The official images lean heavily into the sporty vibe, but at 4,825 mm long with a 2,848 mm wheelbase, it feels more like a large family car. However eye-catching the color, parking space is still t
post-image
BTC-0.67%
ETH evening outlook: 10.31.
ETH is consolidating between 2252 and 2213. A W-bottom neckline has formed at 2252 within the range. ETH can only bounce toward 2293 once it breaks above 2252; otherwise, it will keep consolidating between 2252 and 2213. ETH must break above 2293 to return to the consolidation range marked by the red box above. Only then can the hourly downtrend stop. Hopefully ETH won't break below 2213! If it does, a second retest will follow. Saturday's price action is pretty dull, and there isn't much to analyze.
Go long on the right side if ETH breaks above 2252 with volume. Go
ETH-1.26%
  • 2
#ETHPullsBack #GateSquareHalloween
#ShareWeekly
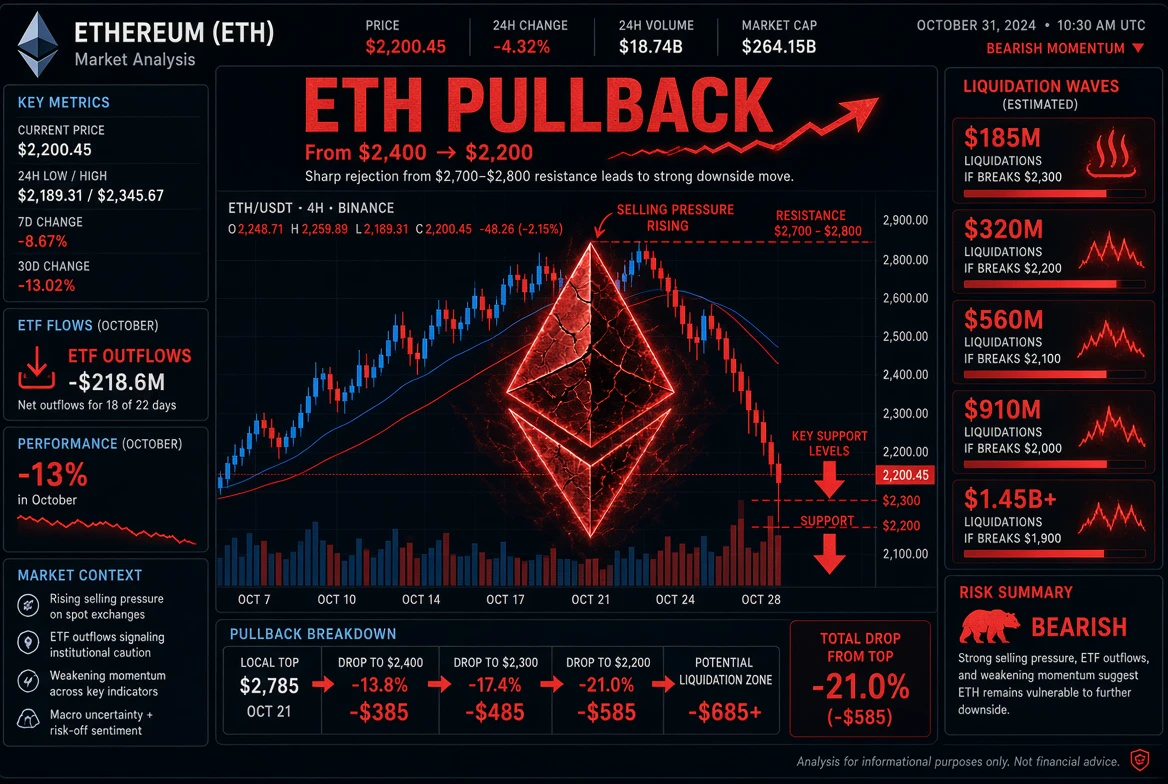
Ethereum Under Heavy Selling Pressure: Why ETH Is Falling, Where the Critical Support Levels Are, and What Could Trigger a Recovery
Ethereum is facing significant selling pressure as its price retreats toward the $2,200 region. The decline is not simply a normal daily fluctuation. It reflects a combination of weakening institutional demand, macroeconomic uncertainty, leveraged position liquidations, and declining confidence across the broader cryptocurrency market.
As of October 30, 2026, ETH is trading around $2,210–$2,230, down approximately
post-image
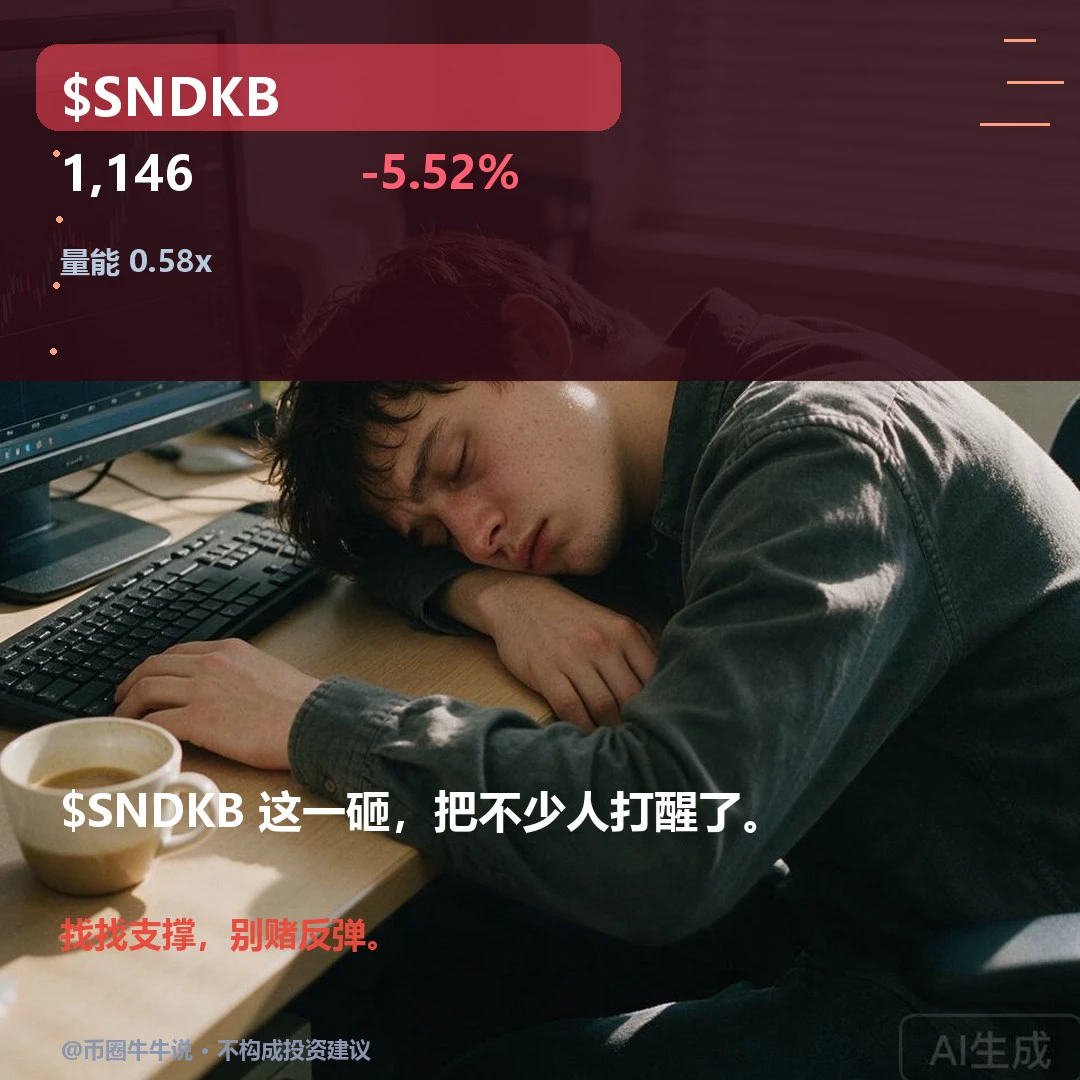
Weak, and oversold does not mean the bottom is in. $SNDKB is currently at 1,146.35. Trends are weak across both short and longer timeframes. The one-hour RSI is nearing 30, and the four-hour RSI is even lower. The decline has been deep, but trading participation is below 60%, suggesting this drop looks more like a slide caused by a lack of buyers than a confirmed halt in the decline. If a bottom were truly forming, why hasn’t there even been one high-volume rebound on the shorter timeframe? My view is that rebound demand is growing, but there is still no evidence of a reversal. The bearish out
post-image
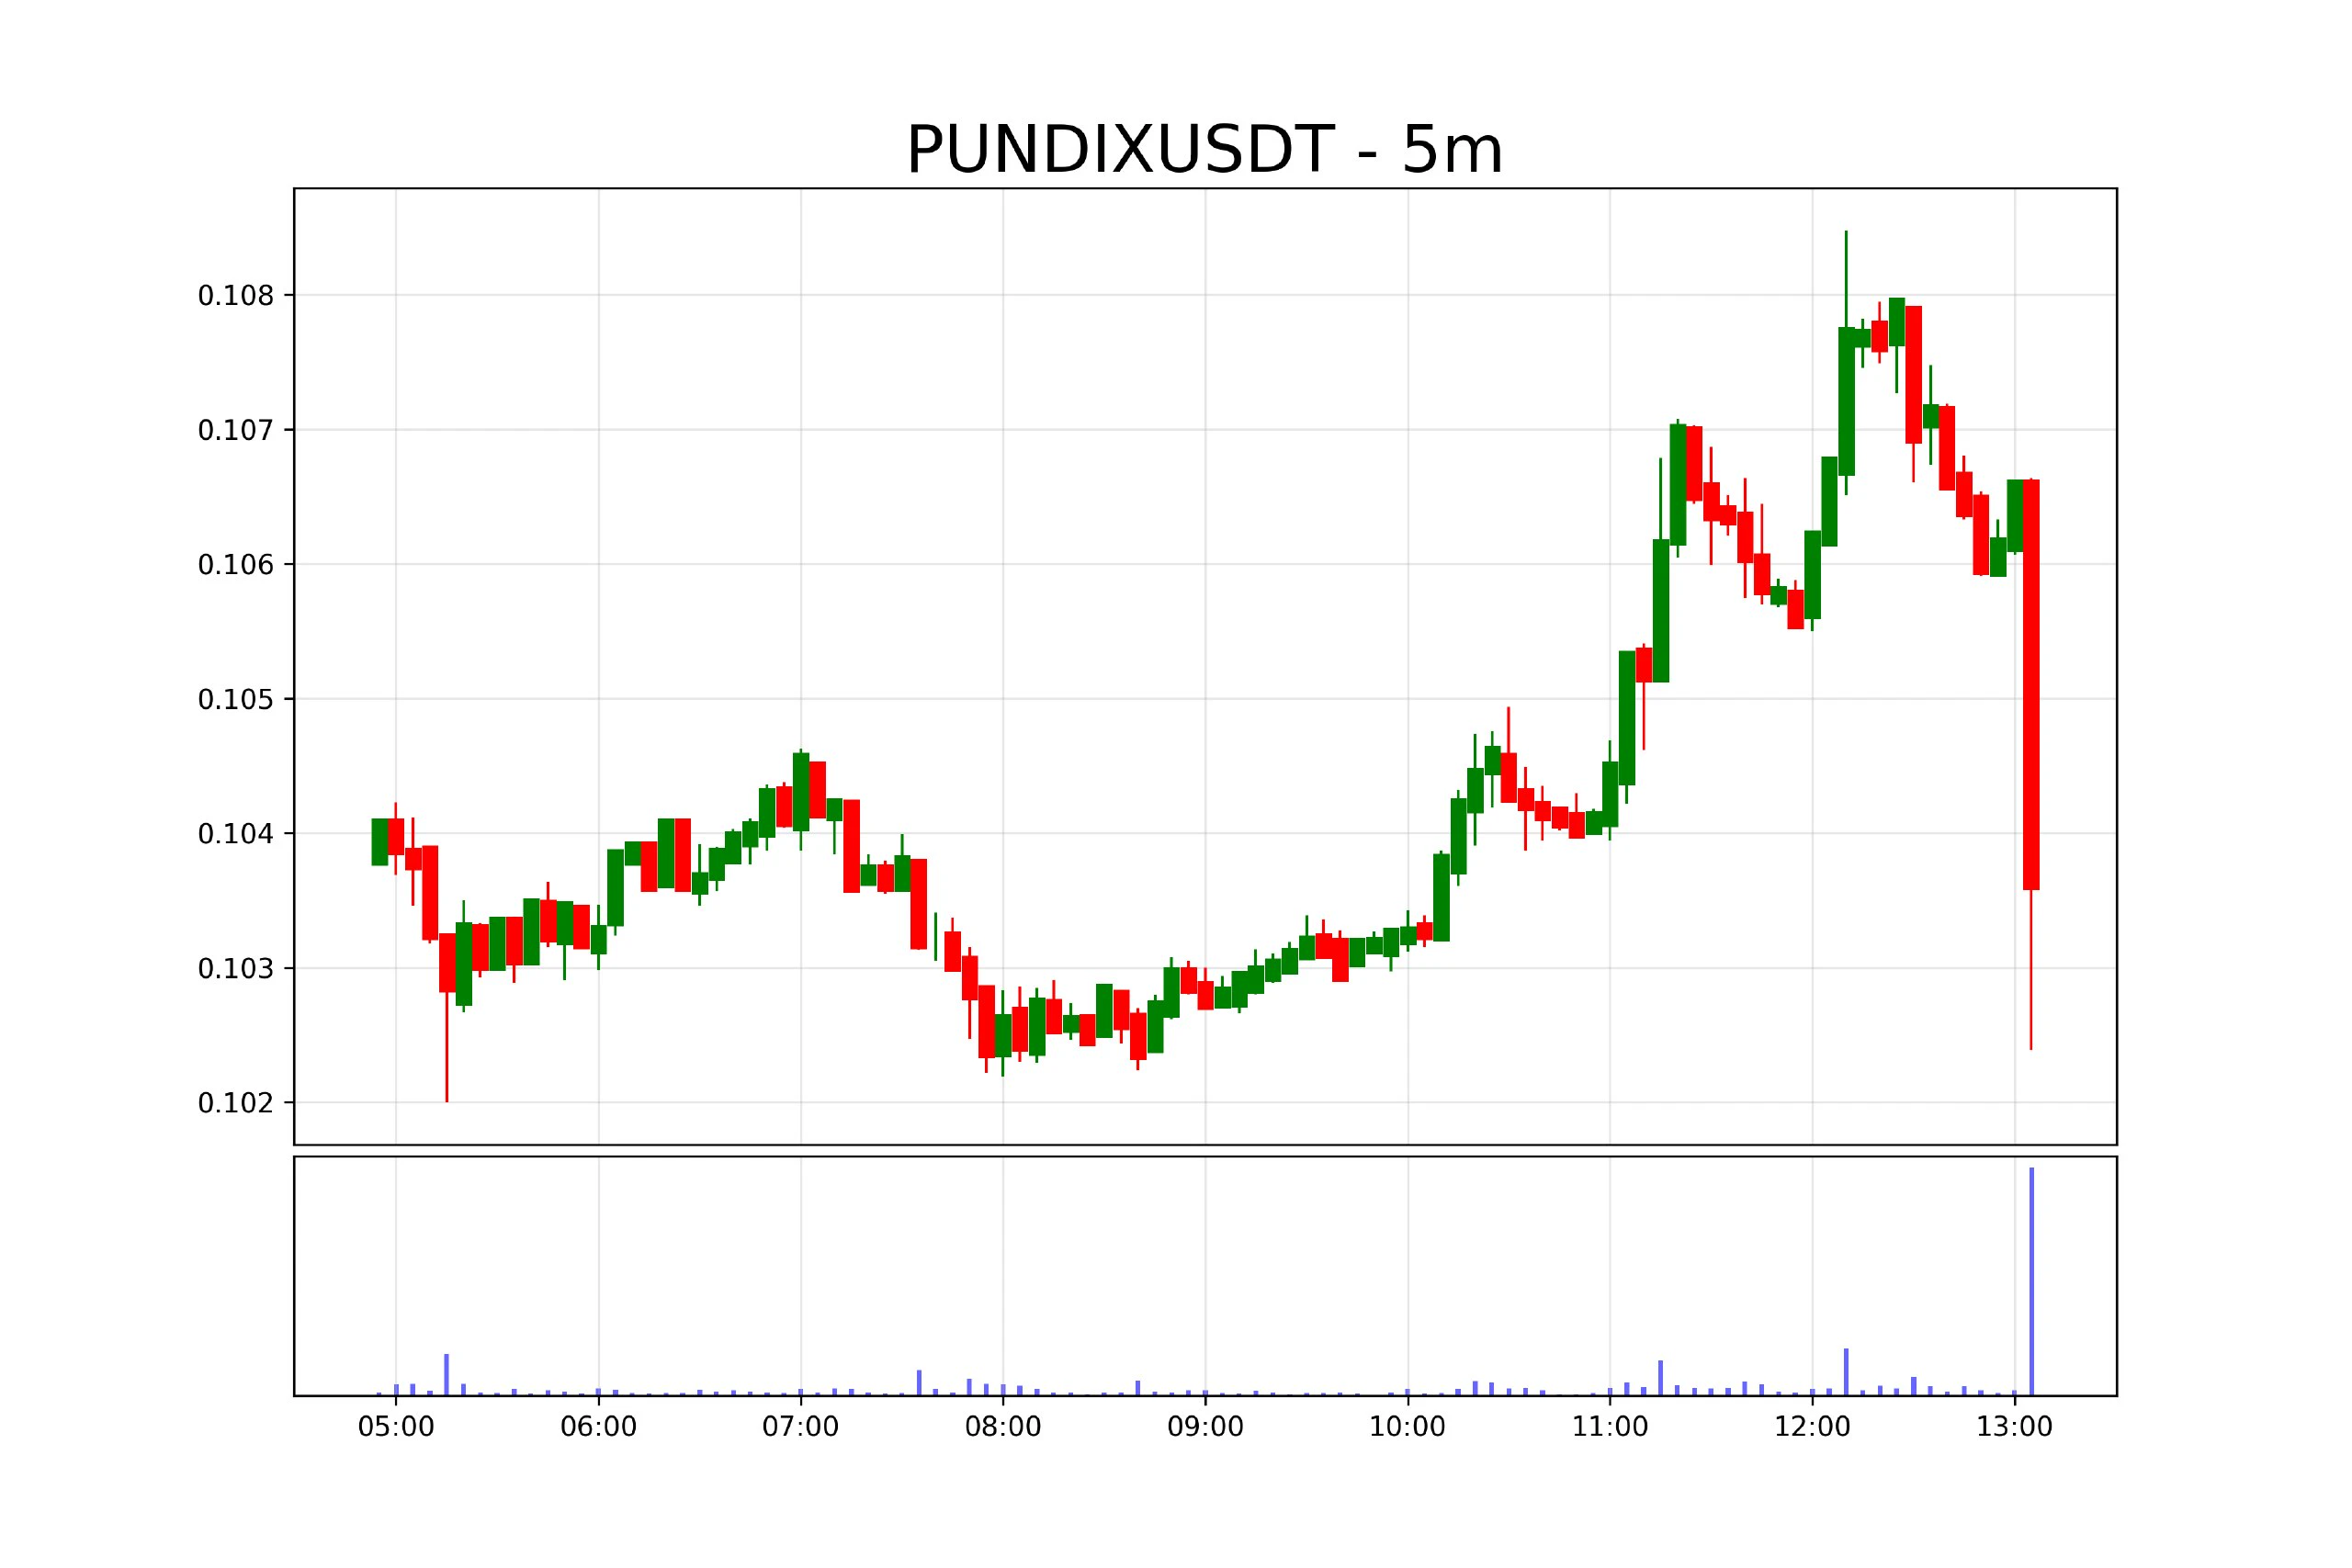
$PUNDIX USDT is under notable pressure, trading near $0.10364 after falling 5.2% over 24 hours. The latest move is down 2.75%, while volume has surged 2,910.5%. This sharp activity increase deserves attention, as it may signal aggressive selling or a potential volatility-driven reversal.
Support Zone: $0.1010–$0.0990
Resistance Zone: $0.1060–$0.1080
Next Bearish Target: $0.0960, followed by $0.0930
Bullish Recovery Target: $0.1100 if buyers reclaim resistance.
A decisive breakdown below support could extend bearish momentum. If buyers defend the support zone and push price above resistance, a
post-image
PUNDIX-1.36%
Crypto Market updates
live-cover
LIVE1,625
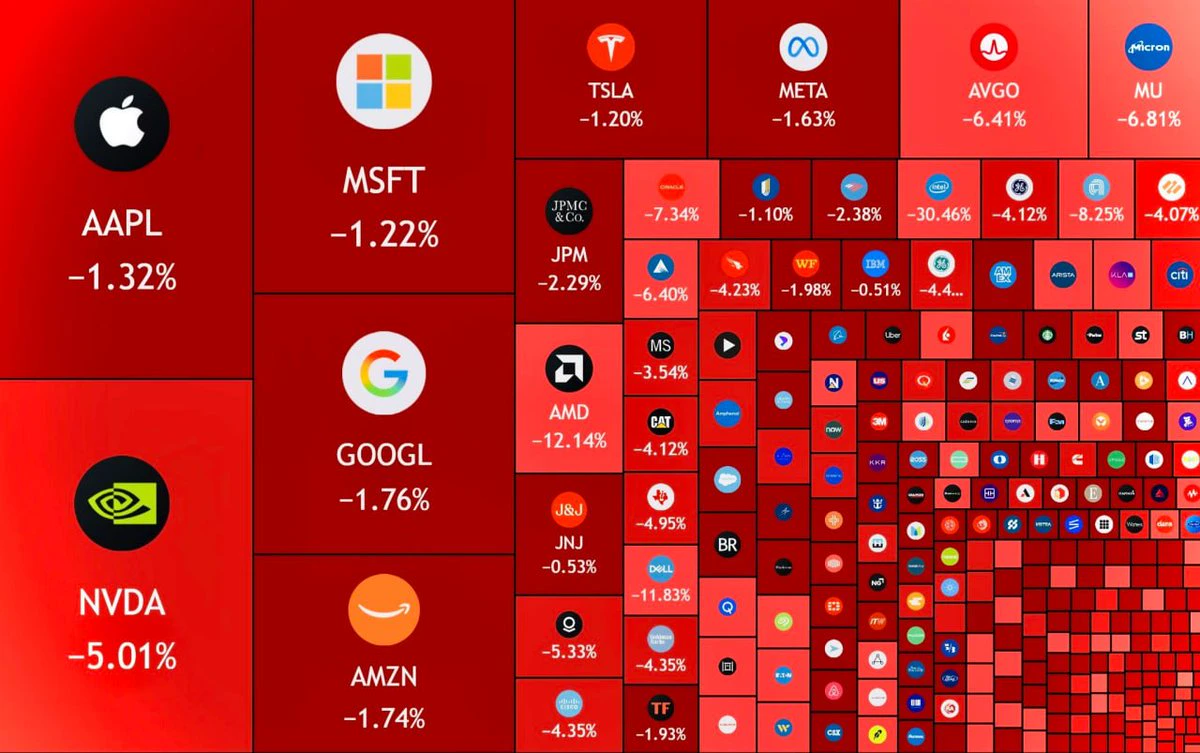
🚨 JUST IN: 🇺🇸 $1.8 TRILLION wiped out from US stocks in Friday's sell-off.
Here's how the major indexes closed:
1. Nasdaq: -3.4%
2. S&P 500: -2.1%
3. Dow Jones: -1.1%
What a brutal finish to October.
post-image
NDAQ+0.65%
DOW+3.25%
SPX500+0.19%
GM ☀️
Would you rather be lucky or talented?
post-image
#BTC大跌 #ShareWeekly $BTC
BTC lost $80K, wicked down to about $76.3K overnight and is now sitting near $77K, down more than 4% on the day. A security incident at a major exchange lit the fuse, but I don’t think that explains the whole move. Here’s how I’m reading it, with levels from my daily chart.
1. The fuse vs the fuel
The trigger was a reported ~$6.3B hack at a large exchange, and the exchange itself says roughly half of it is frozen. That hurts confidence, but price only drops this fast when there’s fuel. Liquidation snapshots put forced closes anywhere between $1.1B and $1.55B dependin
post-image
BTC-0.67%
Gm to everyone who says gm Back 🌞
post-image
#美股财报季 #Gate广场万圣节 Earnings blew past expectations, so why did SanDisk plunge?
SanDisk delivered earnings that beat expectations across the board, yet its shares plunged as much as 8% in U.S. premarket trading Friday. The problem was its Japanese wafer-fab partner, Kioxia: it issued a weaker-than-expected profit outlook and warned that the AI-driven flash memory price surge is cooling.
SanDisk’s results Thursday after the close were nearly flawless: revenue and earnings per share beat expectations, gross margin was 85%, guidance topped Wall Street expectations, it added $5 billion to its buybac
Crazy $AIN 🥳🥳🥳🥳🥳🥳🥳As predicted, it’s falling and has successfully reached the second take-profit target. 🤞💪💪💪💪💪 Now move the stop loss into profit and continue taking profits in batches. What else can I do for you, my pandas????? I can practically predict every move in advance. Congrats 🎉🎉🎉🎉🎉🎉🎉🎉🎉🎉🎉AIN HeYiSaysWithdrawalsExpectedtoResumeWithin42Hours
post-image
AIN+3.85%
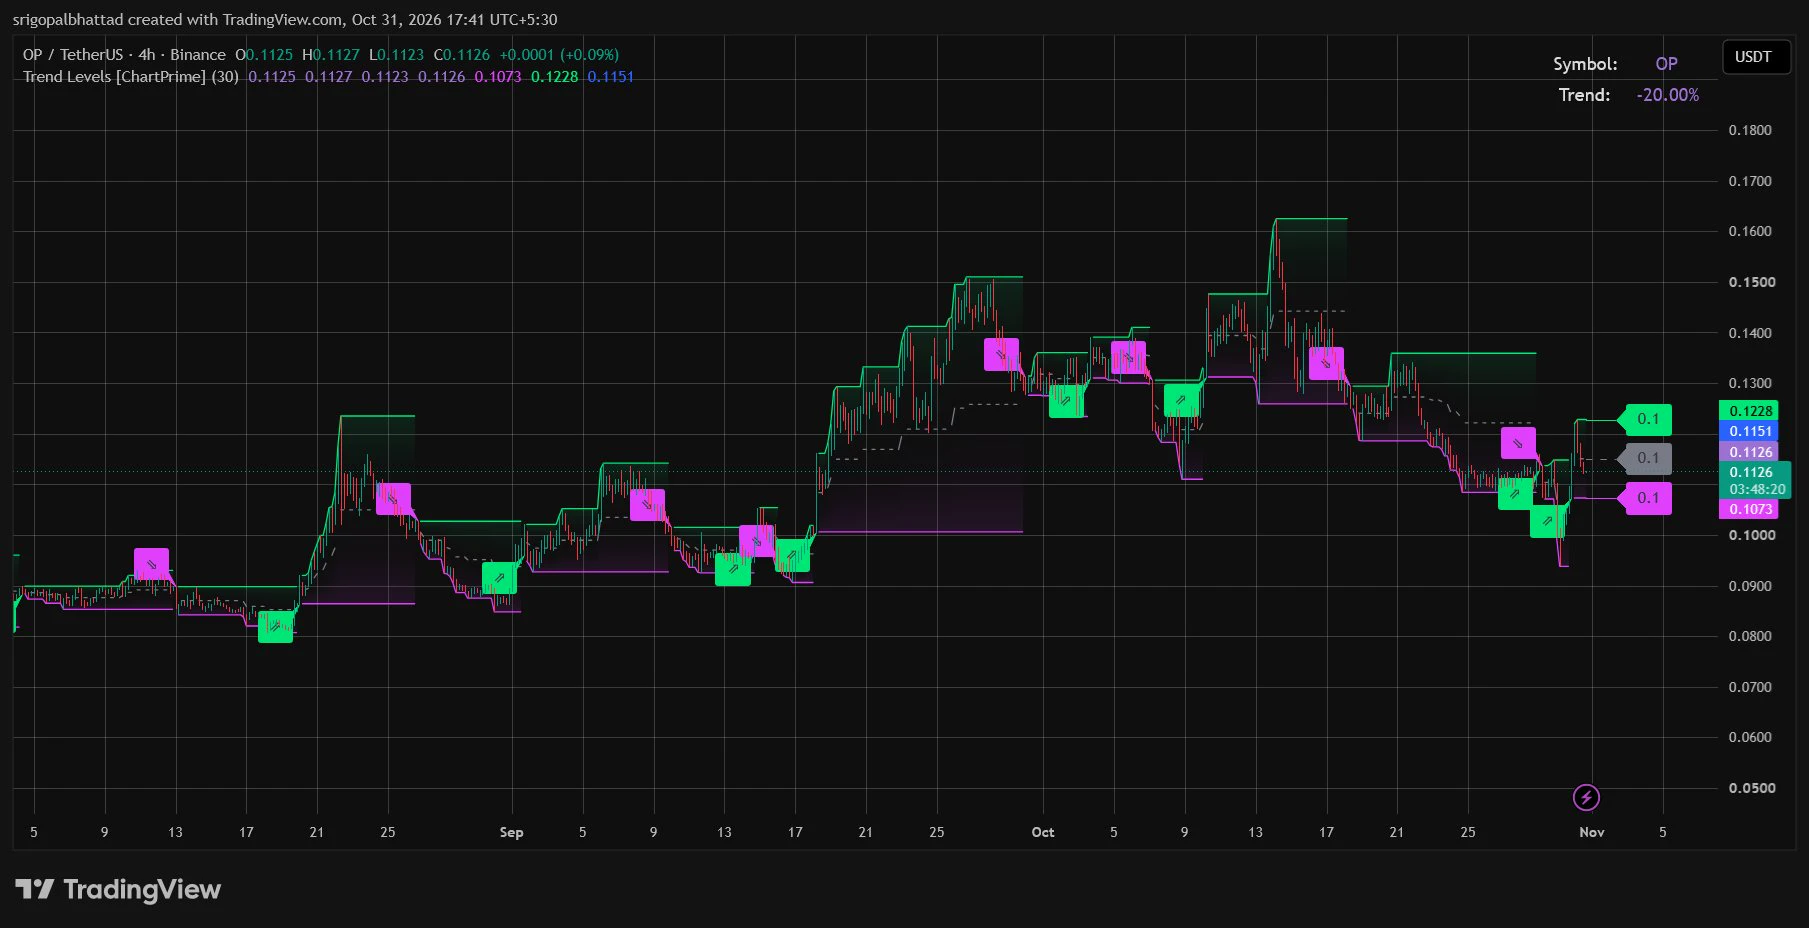
$OP 👀
Bullish reversal attempt on the 4H chart!
OP is recovering from the $0.095–$0.100 support zone and reclaiming short-term trend levels. Buyers are attempting to regain control after the recent downtrend.
💰 Current Price: $0.1126
🎯 Upside Target: $0.1228
🚀 Next Resistance: $0.1350
🛡️ Support: $0.1073
A sustained move above $0.1151 could strengthen bullish momentum. Watch for confirmation! 🔥
post-image
OP-1.33%
#ETHPullsBack
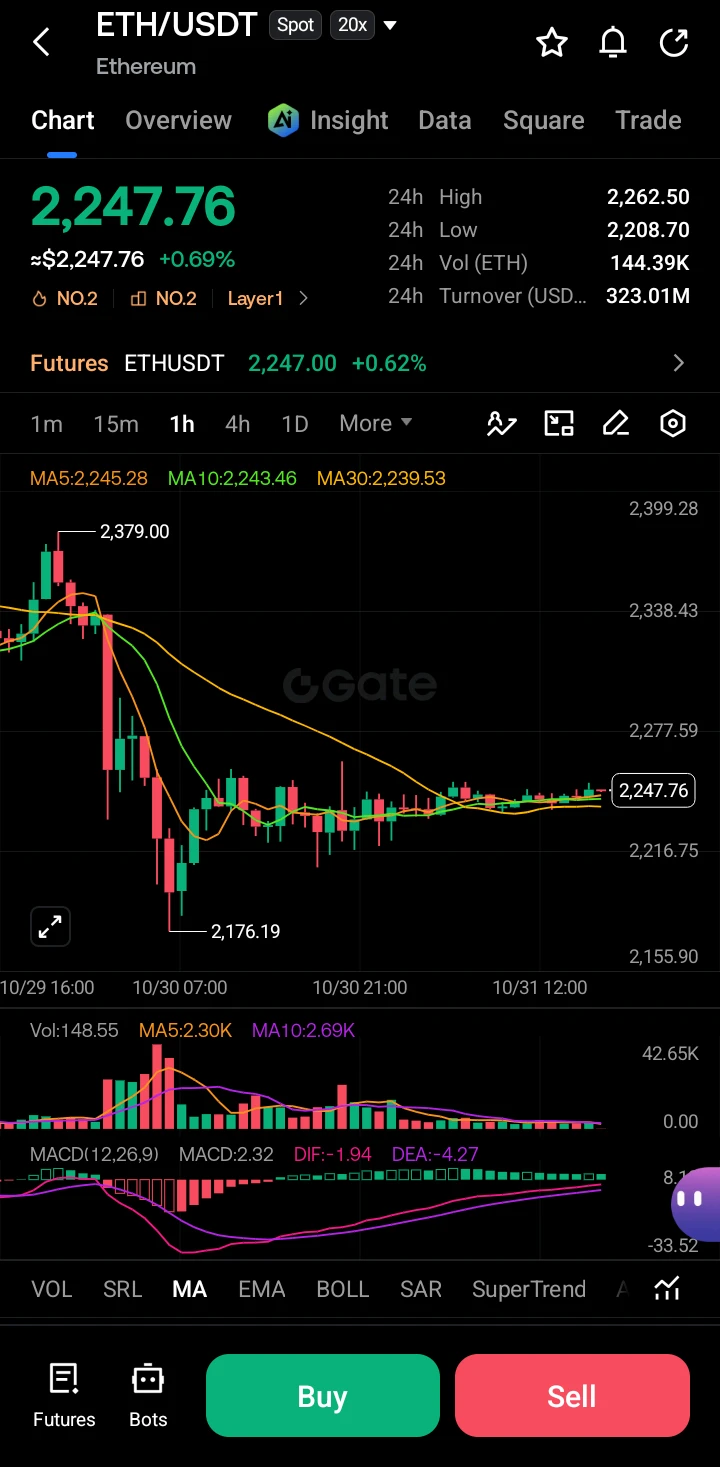
$ETH is trading at 2,247.76 (+0.69%). After a sharp drop from 2,379 to the low of 2,176 on Oct 30, price has stabilized and is consolidating just above the tightly clustered MAs (MA5 2,245 / MA10 2,243 / MA30 2,239). Volume has declined and MACD histogram has turned positive, showing fading selling pressure.
Key Levels
Resistance: 2,260–2,262 (24h high) → 2,277 → 2,300–2,338
Support: 2,216–2,220 → major support at 2,176
Kline Deep Analysis.
The sell-off was impulsive with large red candles and high volume. Since the 2,176 low, price has formed a tight sideways range with smaller
post-image
ETH-1.26%
  • 6
#StrategySTRCNears100ParValue
Strategy's STRC Approaches the Critical $100 Level – A Potential Turning Point for Bitcoin's Institutional Buying Strategy!
Strategy's STRC preferred stock is attracting renewed attention as investors watch its recovery toward the important $100 par value. This development matters not only for income-focused investors but also for Bitcoin's institutional investment landscape.
What Is STRC?
STRC, also known as Stretch, is Strategy's perpetual preferred stock listed on Nasdaq. It was designed to trade around its $100 stated value while providing variable-rate cash
STRC-0.39%
MSTR-7.78%
BTC-0.67%
📚 Wealth is what you don’t see.
That luxury car only proves the owner has less money than before they bought it.
Real wealth is the unspent cash that compounds quietly for decades.
Most of Buffett’s fortune came after age 65 because he started early and never stopped.
Behavior beats any formula.✍🏻
post-image
Load More

Join 40 M users in our growing community

⚡️ Join 40 M users in the crypto craze discussion

💬 Engage with your favorite top creators

👍 See what interests you

Trending Topics

BTC大跌

301.26k Views39.63k Discussing

$BTC briefly fell below $77,000 and remains under pressure around the $77K zone, with its 24-hour decline still above 4%. With risk appetite weakening and Fed uncertainty rising, where is the next key support after losing $80K?

IntelBeatsEarningsButStockPlunges

22.96k Views854 Discussing

StrategySTRCNears100ParValue

28.18k Views4.1k Discussing

View More