




Share your thoughts
placeholder
Article
$HYPE /USDT is about to test TP2 and most traders are not ready.

$HYPE /USDT - LONG

Trade Plan:
Entry: 78.897 – 79.445
SL: 75.748
TP1: 81.739
TP2: 83.450
TP3: 86.018

Why this setup?
Why now? The daily trend is bullish, the 1h price sits at 79.171, the 15m RSI is at 27.71 showing oversold exhaustion, and the 1h ATR of 1.097242 confirms the volatility is expanding enough to fuel the next leg higher. The entry zone between 78.897 and 79.445 aligns perfectly with the current 1h price, giving a precise risk-defined setup. The first target sits at 81.739, while the second target extends to 83.
HYPE-5.44%
Nobody is shorting $CL /USDT right now, but the setup is begging for it.

$CL /USDT - SHORT

Trade Plan:
Entry: 100.39 – 101.09
SL: 105.16
TP1: 97.43
TP2: 95.22
TP3: 91.90

Why this setup?
Why now? The daily trend is range-bound, which often sets up a sharp directional breakout. The 1h ATR of 1.416489 signals enough volatility to fuel a fast move once price leaves the entry zone of 100.39 to 101.09. The 15m RSI at 63.82 shows the short-term momentum is still leaning bullish, creating a crowded long crowd that a reversal can sweep away. The target TP1 sits at 97.43, with TP2 at 95.22, offeri
CL+5.40%
JUST IN: South Korea’s KOSPI opened down 3.29% to around 7,000, with SK Hynix and Samsung Electronics each off about 4%. Could ripple into broader risk sentiment for tech-heavy equities. $KRW, $KOSPI
post-image
Layout for Bitcoin, Ethereum, and Dogecoin
live-cover
LIVE1,456
Spot gold:
From a short-term perspective, gold prices are expected to recover after falling to $4313 on the 15-minute chart. The MACD histogram has turned from green to red, the three KDJ lines have formed a bullish crossover and are moving upward, and the 5MA is trending toward crossing above the 10MA.
In the short term, a light long position can be opened at the current price of $4315, with a stop-loss below $4310 and a take-profit at $4335#黄金 #伦敦金 $XAUUSD
post-image
XAUUSD+0.05%
In August, the U.S. PPI rose 0.4% month-on-month and 5.4% year-on-year. The monthly increase was in line with expectations, but the annual increase was slightly higher than expected and accelerated further from July
This data is not particularly comfortable for either U.S. stocks or Crypto. The key question remains whether inflation is starting to pick up again
If CPI, employment, and other data remain hot, market expectations for rate cuts may be pushed back further. U.S. stocks, especially high-valuation tech stocks, will come under pressure first, and Crypto will also find it difficult to r
BTC-1.73%
AAPL+3.55%
Why is $HOME /USDT about to break its daily trend when everyone expects more downside?

$HOME /USDT - LONG

Trade Plan:
Entry: 0.00536 – 0.00540
SL: 0.00514
TP1: 0.00556
TP2: 0.00568
TP3: 0.00586

Why this setup?
Why now? The daily trend is bearish, yet the 1h ATR of 0.000077 confirms the market is still compressing before a burst. The 15m RSI at 25.59 shows extreme oversold conditions that rarely last, especially when the 1h price is pinned at 0.00538. This entry zone between 0.00536 and 0.00540 sits right where the bounce meets the trendline, turning a bearish structure into a long setup.
HOME-4.57%
Why is SYMBOL suddenly the most talked-about range breakout on the board?

$ADA /USDT - LONG

Trade Plan:
Entry: 0.204 – 0.206
SL: 0.194
TP1: 0.213
TP2: 0.218
TP3: 0.226

Why this setup?
Why now? The 1d trend is range, but the 1h ATR of 0.003369 shows volatility is compressing right as the 15m RSI drops to 30.93, signaling a potential squeeze. The 1h price is pinned at 0.205, the exact entry_ref where a LONG bias makes sense with 77.4 confidence. Hitting TP1 at 0.213 validates the move, while TP2 at 0.218 confirms momentum toward the larger structure. The invalidation level of 0.211 acts as
ADA-2.60%
Conversation with Fejau: The Next Digital Asset Bull Market Has Finally Arrived
[Plain-Language Guide] The SEC’s tokenization innovation exemption has been implemented, prompting the crypto industry to move beyond regulatory uncertainty and “financial nihilism,” while compliant assets on-chain reshape the global clearing and settlement system.
The market is shifting from mindless speculation to rigorous corporate finance logic. Only high-quality protocols with genuine cash-generation capabilities and rational capital reallocation can capture core value.
Amid global fiscal dominance and fiat cu
post-image
This move was purely because the market was in a good mood—it casually tossed out some gold coins, and one happened to hit me right on the head. While everyone was still watching from the sidelines, $CLO ’s rebound lacked momentum, selling pressure was strong, and trading volume was low. Every push upward fell just short, so I signaled bullishness and waited for confirmation before shorting at highs.

Panic comes from having no plan; losses come from overthinking.

From 0.16393 to 0.09758, the short position gave the answer: +796.94%. That felt really good. This was a comfortable profit, and
post-image
CLO-1.97%
SNDK-4.15%
ETH-0.68%
$SPCX /USDT is quietly arming for a move most traders will miss.

$SPCX /USDT - SHORT

Trade Plan:
Entry: 147.68 – 148.66
SL: 152.85
TP1: 144.66
TP2: 142.32
TP3: 138.81

Why this setup?
Why now? The daily trend is range-bound, which often precedes a sharp directional break when volatility expands. The 1h price sits at 148.17, right at the entry reference where the setup is armed. The 15m RSI of 46.26 shows neither overbought nor oversold, leaving room for a clean slide toward the first target at 144.66. The 1h ATR of 1.949855 confirms enough hourly volatility to reach the second target at 1
post-image
SPCX+0.71%
Nasdaq, keep crashing! #NAS100
post-image
NAS100-1.13%
I originally wanted to cut my losses and sacrifice to the heavens, but the sacrifice never happened—the meat cooked itself.

When I thought this move was completely over, my short position was still showing an unrealized loss, and I really wanted to close it with one click and go to sleep. But after reviewing it several times: every rebound was pushed back down, and volume never picked up at all, showing that the selling pressure above had truly not dissipated. I gritted my teeth, moved my stop-loss lower, and decided to give it one more night.

When I opened the charts this morning, what a
post-image
DOGE-2.92%
SNDK-4.15%
XRP-3.70%
JUST IN: Jensen Huang calls NVIDIA’s data center/AI infra financing “a very smart strategy” aimed at driving adoption, not circular funding. Could signal strategic capital deployment outside the core product cycle. 🚀
post-image
NVDA-2.25%
Why is everyone suddenly calling NEAR a trap right before a massive move?

$NEAR /USDT - LONG

Trade Plan:
Entry: 2.4749 – 2.5079
SL: 2.3329
TP1: 2.6103
TP2: 2.6896
TP3: 2.8085

Why this setup?
Why now? The daily trend is firmly bullish, setting the stage for a continuation play. The 1h ATR of 0.066061 confirms that volatility is expanding just enough to fuel a decisive push. With the 15m RSI sitting at 45.04, momentum is neutralizing oversold conditions without yet overheating, creating room for a clean entry at the 2.4914 reference. The plan targets TP1 at 2.6103 and extends to TP2 at 2.6
NEAR-0.22%
Most traders are about to get caught shorting SYMBOL at the worst possible moment.

$SKHYNIX /USDT - SHORT

Trade Plan:
Entry: 1335.06 – 1342.98
SL: 1377.08
TP1: 1310.48
TP2: 1291.45
TP3: 1262.90

Why this setup?
Why now? The daily trend is range, but the 1h ATR of 15.857643 signals a breakout is imminent. The 15m RSI at 35.48 confirms oversold exhaustion, while the 1h price sits at 1339.16. The entry zone between 1335.06 and 1342.98 aligns perfectly with the entry reference of 1339.02. If the invalidation level at 1330.59 breaks, the target slides to TP1 at 1310.48 and eventually TP2 at 12
SKHYNIX-4.54%
This market is honestly a bit surreal
The 10-year U.S. Treasury yield surged to 4.943%, oil prices broke straight through $100, and the market even started pricing in Fed tightening expectations again
$BTC fell below 77,000, $ETH 2440, $SOL went straight to 99, while altcoins began collectively performing a freefall
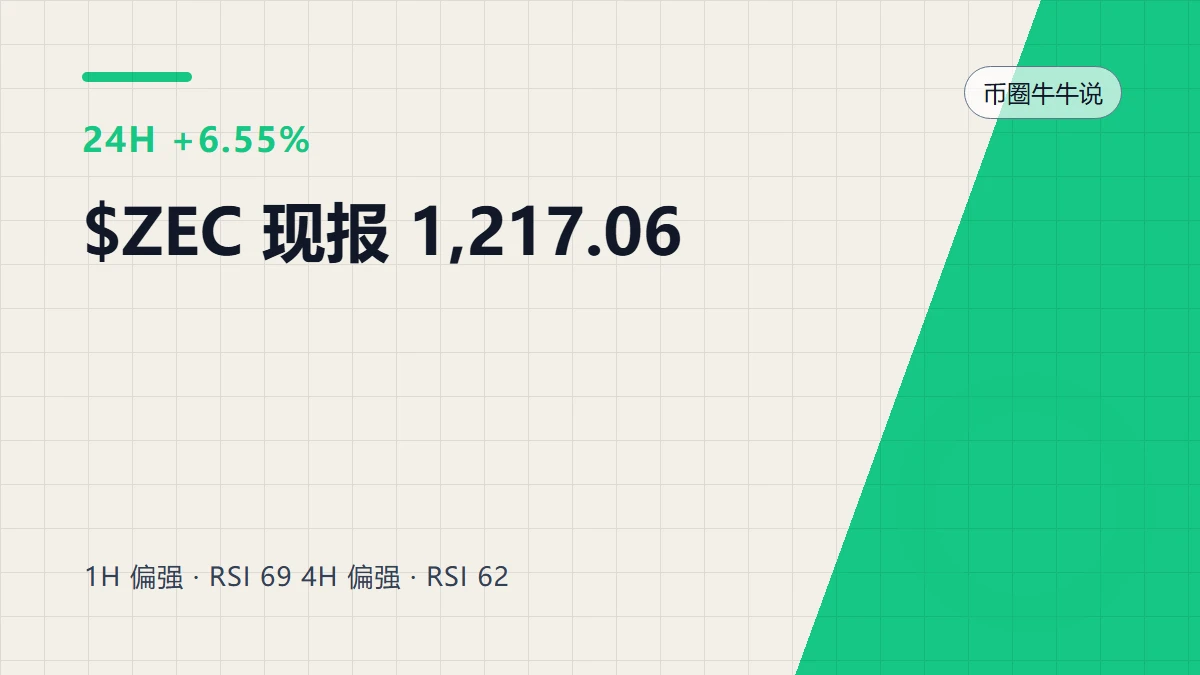
$ZEC -13.6% in 24 hours, solana:35f7eyhtvueDfmV23g9qMVmUzDcSzFi4uUwPTF2dx1de -46%, $RVN -23%, $KAT -20%
But not all coins are falling: $Niu Lai +39%, saga-2:native +27%, solana:4k3Dyjzvzp8eMZWUXbBCjEvwSkkk59S5iCNLY3QrkX6R +16%
All I can say is that the market is no longer a m
Insiders are quietly pressing SHORT on SYMBOL while the range traps longs.

$SKHY /USDT - SHORT

Trade Plan:
Entry: 186.65 – 187.69
SL: 192.17
TP1: 183.42
TP2: 180.92
TP3: 177.18

Why this setup?
Why now? The 1h price sits at 187.17 inside a tight entry zone between 186.65 and 187.69, giving a clean short setup. The 15m RSI at 36.67 shows bearish momentum without being oversold, leaving room to fall. The 1h ATR of 2.08207 confirms enough volatility to reach the first target at 183.42 and the second target at 180.92. The daily trend is range, so mean reversion favors downside from this level
SKHY-4.06%
I wasn't expecting it to survive, but it directly got me back to breakeven—the service was incredibly on point. During the early-morning sell-off, $HEMI was down across the board, but I noticed the volume hadn't followed through, meaning the selling momentum was fading. At this level, going long offered solid risk-reward, so I went long, betting on an oversold rebound.

It delivered: entered at 0.005583, and it has now risen to 0.007114, with +540.34% already realized and credited. The chart gave us the answer. Nailed it.

I took profit on 80% first, and moved the stop-loss on the remaining
post-image
HEMI+9.34%
BTC-1.86%
ADA-2.60%
Load More

Join 40 M users in our growing community

⚡️ Join 40 M users in the crypto craze discussion

💬 Engage with your favorite top creators

👍 See what interests you