
Square
Following
Hot
News
Notifications
Profile
Share your thoughts
placeholder
Article
$ETH price has entered the buyer zone. In my view, this is an excellent opportunity to buy Ethereum, set a stop-loss below the low of the consolidation range, and benefit from solid profit potential. ETH ETHUSDT
post-image
ETH-1.26%
$ERA $ERA Large Long: ERA is approaching a key support zone around $0.0760, where buyers may try to spark a bounce. A successful bounce could trigger a bullish reversal—if buyers drive the next leg up, there could be substantial profits ahead. Long $ERA Entry: 0.0762–0.0770 Stop-loss: 0.0735 Take-profit 1: 0.0790 Take-profit 2: 0.0820 Take-profit 3: 0.0838 Take-profit 4: 0.0890 Trade here $ERA : 👇
post-image
ERA+24.21%
Trenches
mihao
m
bade
b
mihao
4Cxj...pump
Market Cap
$.
Change
.
24h Vol
$.
Holders
.
AGT
A
bade
b
AGT
0x5d...e274
Market Cap
$.
Change
.
24h Vol
$.
Holders
.
FOOD
F
bade
b
FOOD
FTu5...pump
Market Cap
$.
Change
.
24h Vol
$.
Holders
.
IDOL
I
bade
b
IDOL
0x3b...ab07
Market Cap
$.
Change
.
24h Vol
$.
Holders
.
AI
A
bade
b
AI
2T56...pump
Market Cap
$.
Change
.
24h Vol
$.
Holders
.
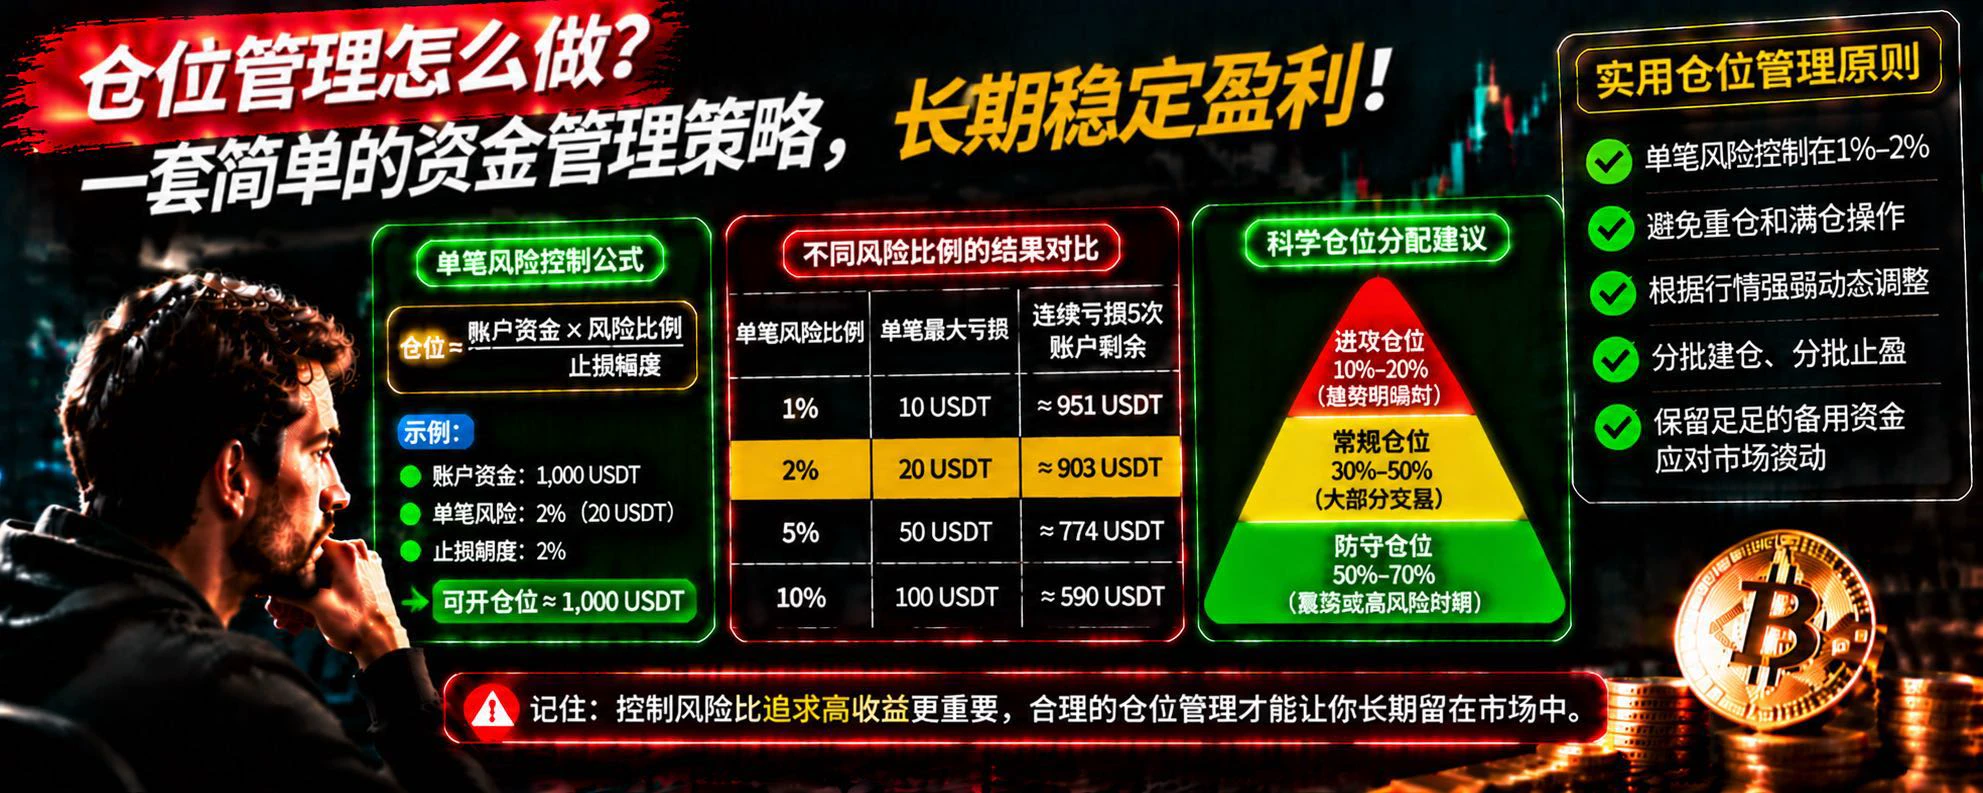
In cryptocurrency trading, many people believe that as long as they can accurately predict whether BTC will rise or fall, they can earn consistent returns. But reality is often the opposite: some traders are right fairly often, yet their accounts never grow steadily. The problem may not be direction, but position sizing.

Why is position sizing so important?

First, oversized positions can magnify losses. With the same 2% drop in BTC, a trader with a small position may experience only normal volatility, while a heavily invested trader using high leverage could suffer severe losses or even face
post-image
BTC-0.65%
It’s midterm exam time.
How many comments are you guys up to?
Anyone slacking off?
post-image
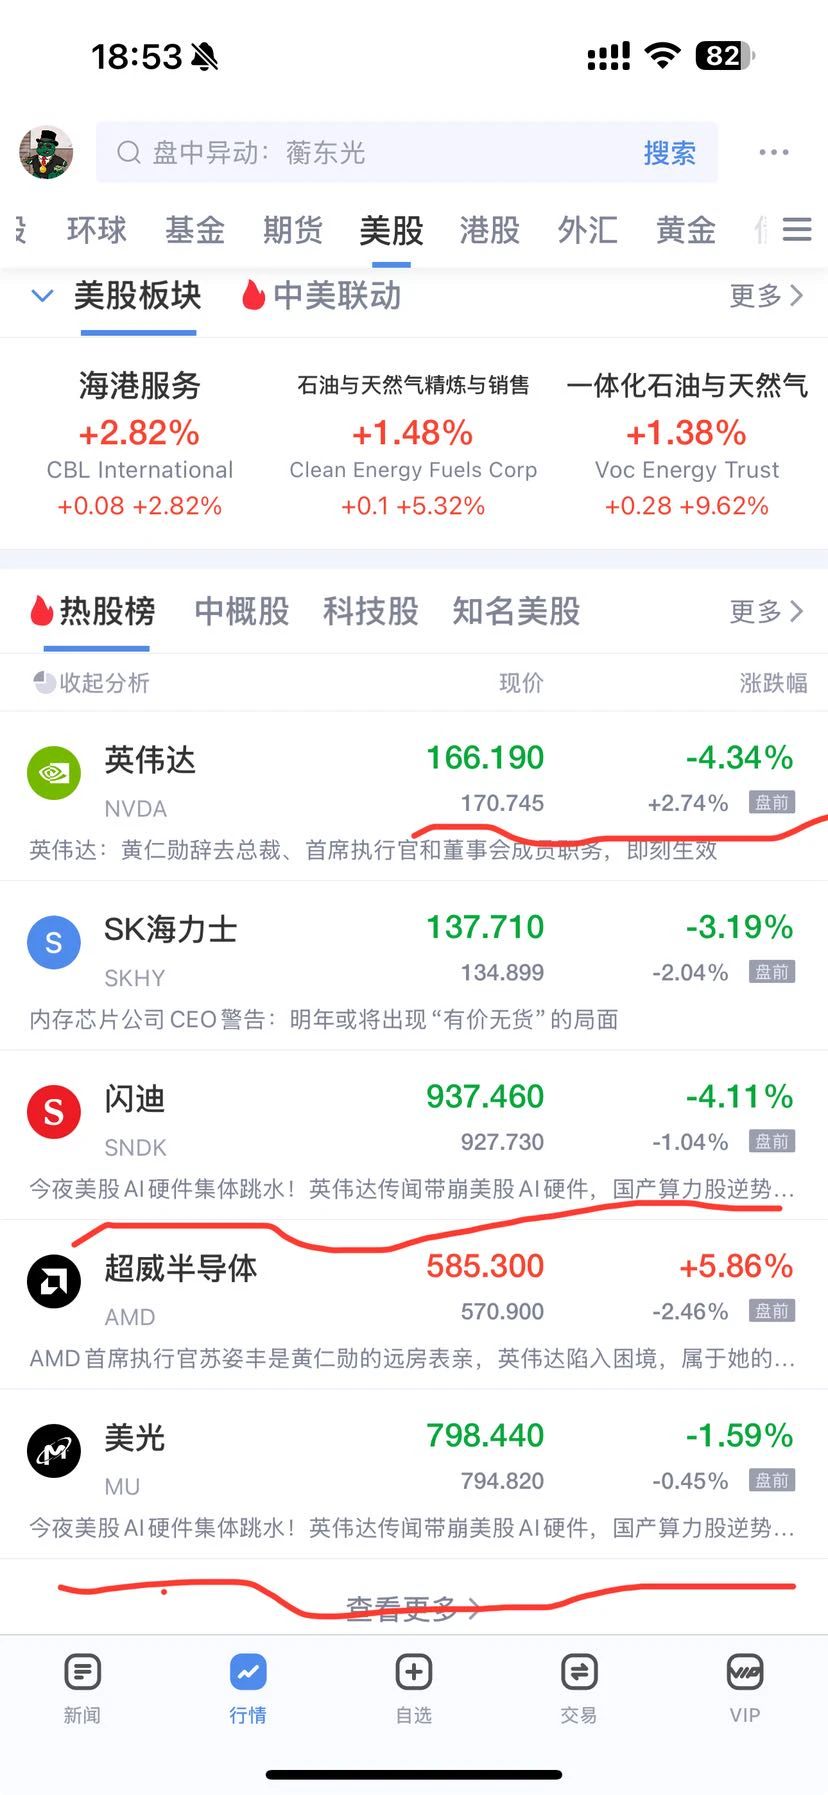
Can Nvidia hold onto its gains at the open? Only if Nvidia stabilizes and US stocks stay in the green can they drive Bitcoin higher in a rebound.

Yesterday, Nvidia dragged the entire AI sector down at the open, and Bitcoin followed. Developments during the opening session triggered concentrated selling. Bulls stayed on the sidelines, and prices quickly broke lower. By the close, the most panic-inducing bearish news had been exhausted; everyone who was going to sell had sold, and dip-buyers stepped in. Nvidia opened lower and closed higher.

AMD, which took in funds flowing out of Nvidia yeste
post-image
NVDA-4.49%
  • 1
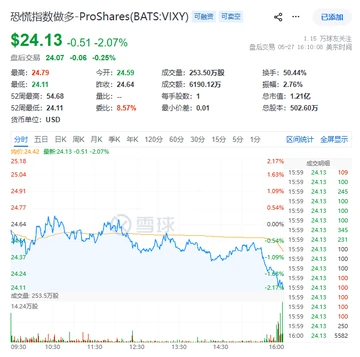
165,000 jobs added? My first reaction was: Can that number really hold up? Fear and greed just keep cycling like this. An $V -type reversal is the most common form of a bull trap, and most people who chase in are just being led by greed. Let’s wait until the weekend to see how it turns out and check back then. If you’re watching this, follow along.
post-image
  • 1
How Can You Read On-Chain Data? How Can Large Transfers Reveal Market Trends?

In the cryptocurrency market, many people watch candlestick charts and trading volume every day, but overlook a very important source of information: on-chain data.

Especially when Bitcoin sees a large transfer, many traders immediately wonder: Is a whale preparing to sell? Are institutions buying in large amounts?

But do large transfers really mean that prices are about to change?

First, distinguish between funds flowing into and out of exchanges. A large amount of BTC transferred to an exchange may mean holders
post-image
BTC-0.67%
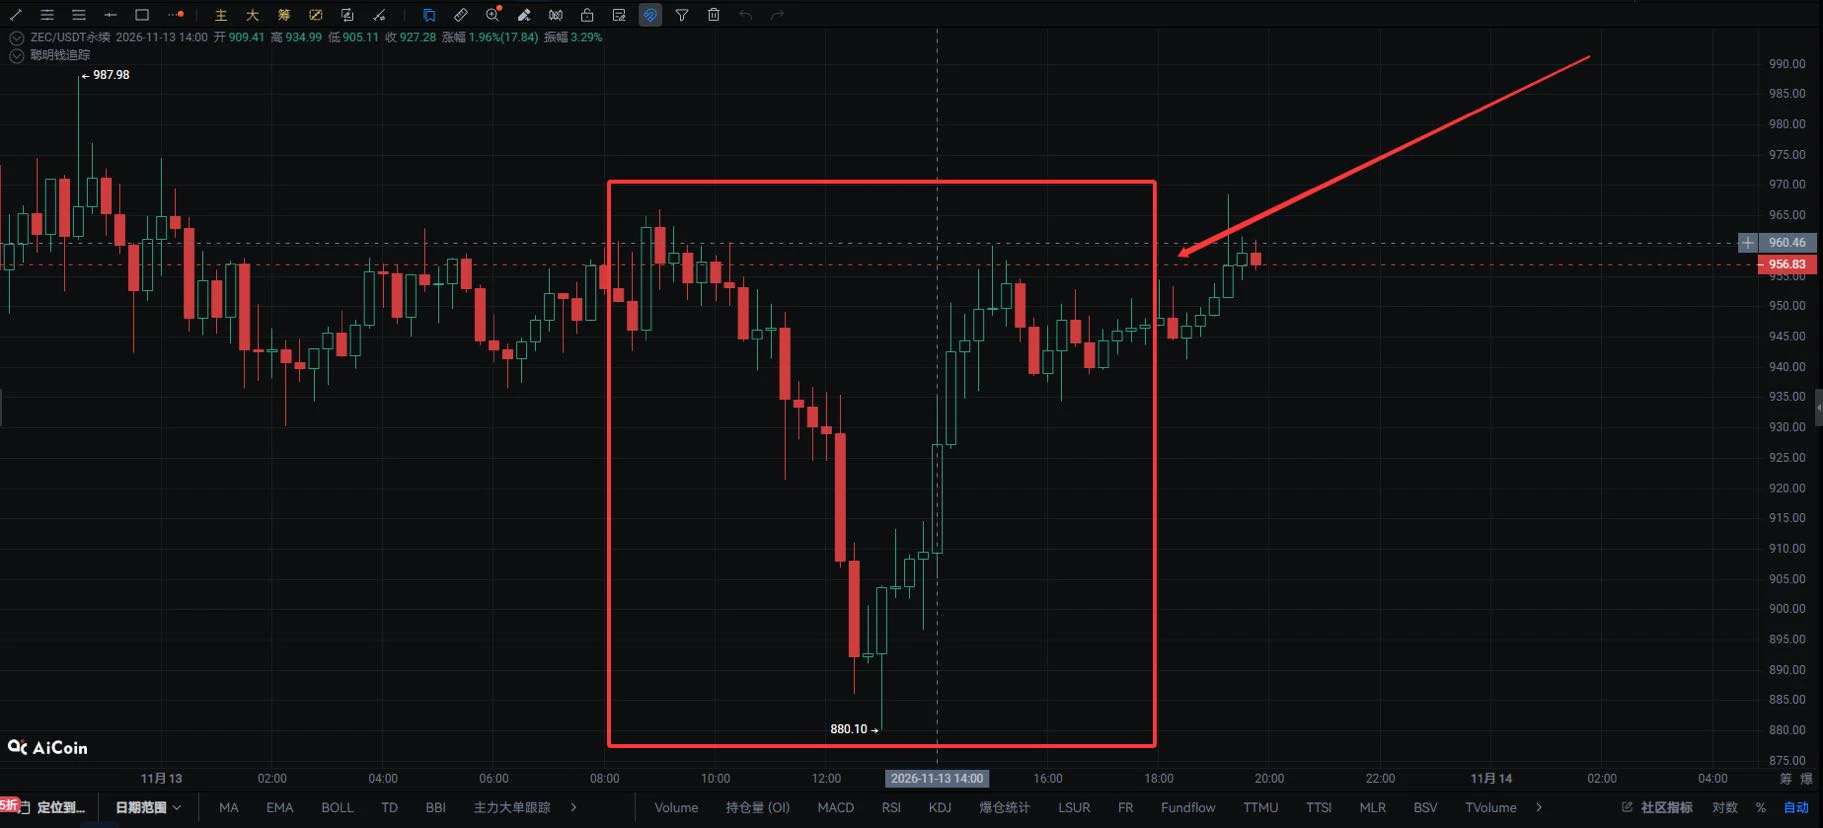
$ZEC Key focus tonight! After the V-shaped reversal, can the bulls keep pushing?

After bottoming out near 880.10, ZEC rebounded quickly and is now back near 946.88, with short-term bullish momentum clearly recovering. But 956.25 is key resistance overhead, and whether price can break through it on strong volume will determine the next move.

The corresponding trading strategy:

📈 Breakout long: If price breaks above 956.25 on strong volume and holds there, consider following the trend with a small position, targeting 968-980.

📉 Rejected at the highs: If price continues to struggle to break
post-image
ZEC+1.29%
BTC market less and less like safe haven?
live-cover
LIVE2,176
Why Is It Harder to Break Even After a Larger Loss? Understanding the True Cost of Account Drawdowns

In cryptocurrency trading, many people focus on how much a trade can earn, but rarely take the time to calculate how much the account needs to gain after a loss to return to its previous level.

This is actually one of the most easily overlooked risks in trading.

Suppose your account originally had 1,000 USDT. After a 10% loss, you have 900 USDT left. To return to 1,000 USDT, it needs to rise by 11.1%, not 10%.

If the loss reaches 20%, you have only 800 USDT left, which needs to rise by 25%
post-image
In-Depth Analysis of Bitcoin On-Chain Data: Unrealized Losses Continue to Widen, with the Zero Line as a Critical Make-or-Break Threshold

I. Key Market Data

Bitcoin dipped to the $68k level and has remained below the short-term holder average cost of $75.43k for 5 consecutive days. The price-to-cost ratio is about 0.9, leaving short-term entrants with overall unrealized losses of around 10%. Pressure from underwater holders continues to build, adding to the selling pressure that could weigh on any short-term rebound.

II. MVRV Z-Score Signals

Over the same period, the MVRV Z-Score fell 0.13
BTC-0.67%
Many traders see BTC trading volume suddenly surge and assume the market is about to reverse. In reality, a spike in trading volume does not necessarily mean a trend reversal. It more often indicates that market participation is increasing, and that disagreement between buyers and sellers may be intensifying.

So, how should we interpret a sudden surge in trading volume?

First, rising volume during an uptrend. If prices continue to rise while trading volume keeps increasing, it indicates high market participation and may mean new capital is entering. But if prices are finding it increasingly
post-image
BTC-0.67%
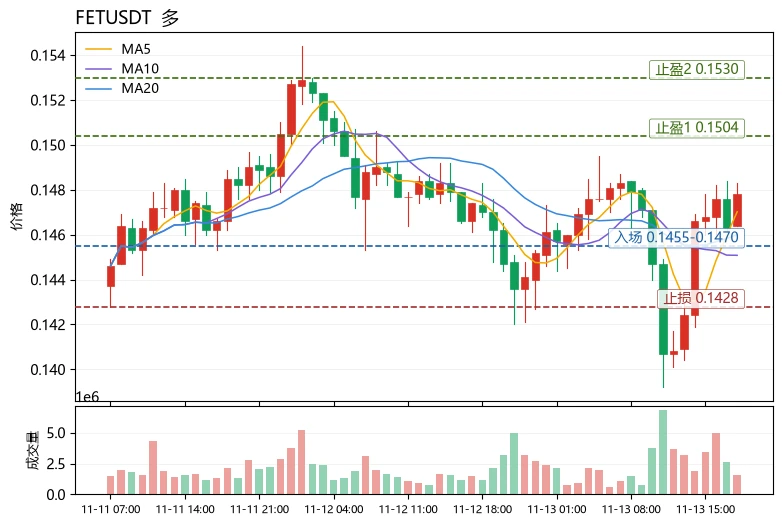
The extreme fear index is only 20, yet FET posted a positive gain and moved above MA5 and MA20. This divergence of “sentiment at rock bottom, structure holding firm” is the most unusual detail in today’s market. Compared with peers in the same sector: POL rose 1.70%, but its MACD histogram has turned bearish and its +0.0036% funding rate signals crowded longs; PEPE rose 2.96% on $82.8M in volume, with an RSI of just 47.6 and an 8.85% range, making it a high-volatility sentiment-driven trade. $FET had the smallest gain (+0.48%), but MA5=0.14702 is above MA20=0.14601, the MACD histogram remains
post-image
FET-1.52%
PEPE+0.97%
Hahaha, is this DINK coin really this bizarre🤣
Sorry, I’m DINK
Looks like it gets beaten in seconds, then burrows underground in seconds
Microsoft 365 has been broken since Thursday evening and it's still not fully back.
-Around 140k Outlook reports from 74 countries at the peak
-Still 43k this morning
-Almost 200k reports across all Microsoft services (Bloomberg)
-NZ paused all visa processing
-UK Parliament and NHS email disrupted
-UK police asking people to call 101
-Euronext told issuers to phone, not email
-Some traders moved to phones and WhatsApp
-Delayed emails now held for up to 48h
If your exchange recovery mail lives on Outlook, move it today.
post-image
MSFT+0.36%
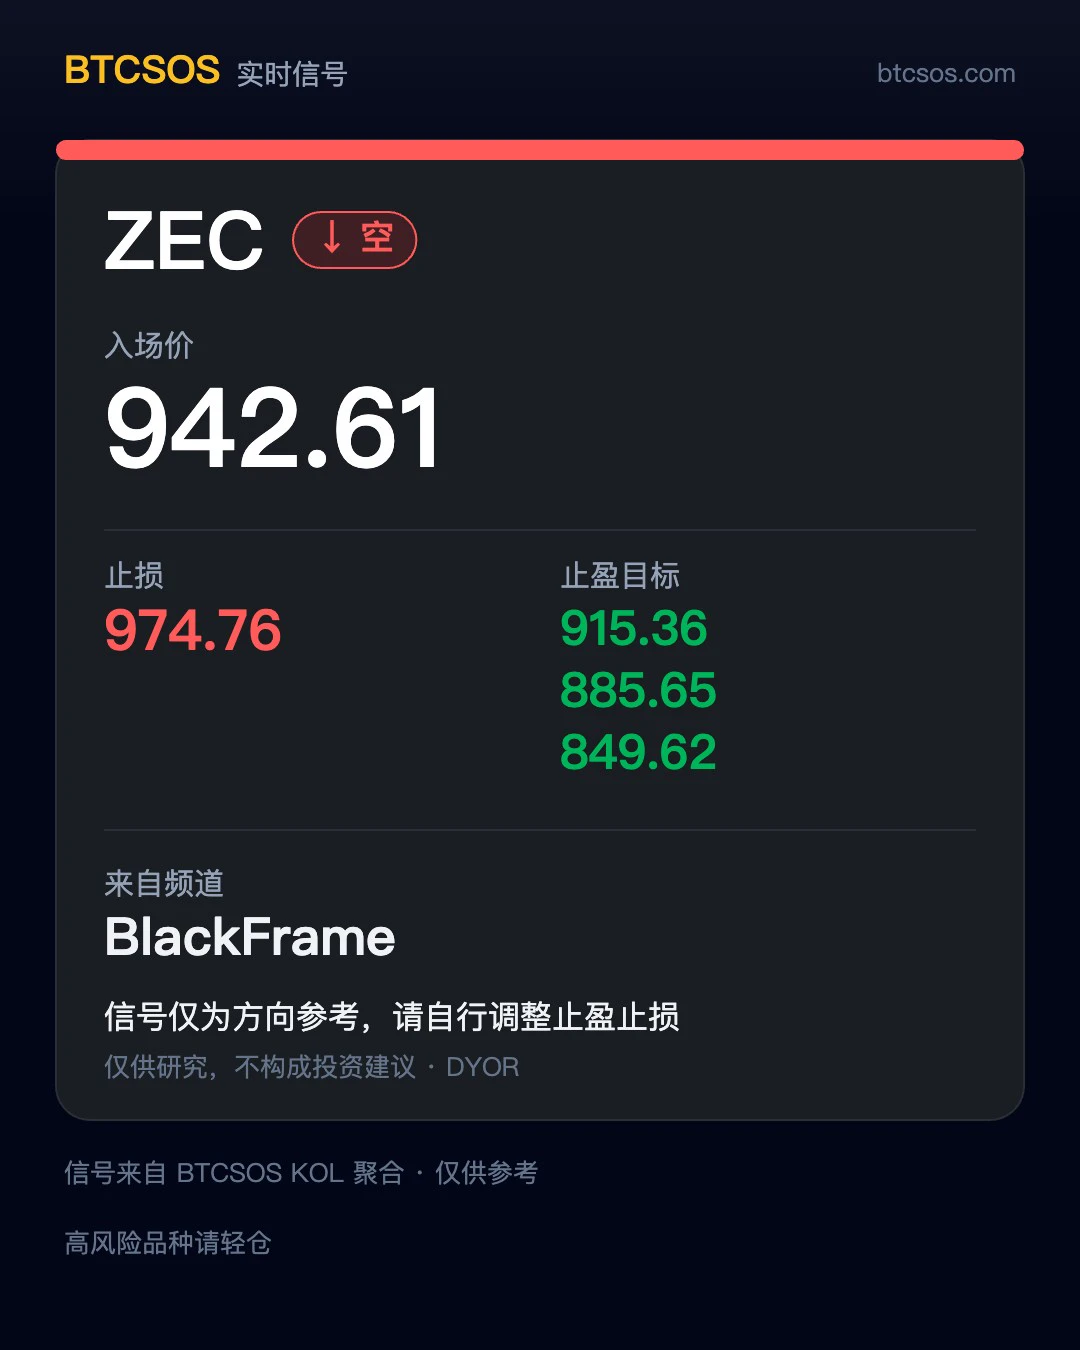
📢 BlackFrame signal repost
Time: 11-13 Target: $ZEC Short entry: 942.61 Stop loss: 974.76 Targets: 915.36 / 885.65 / 849.62
Speaking of which, I reposted his $DOT trade earlier today, and here he is again. This KOL is really diligent 😂
I only repost the information as provided. The signal is someone else’s, but the wallet is yours—whether to follow and how large a position to take is up to you.
Shared for personal record-keeping, not investment advice. #The Fed adjusts its 2027 rate meeting schedule, cutting regular rate decisions to 7.
post-image
ZEC+1.29%
DOT-1.47%
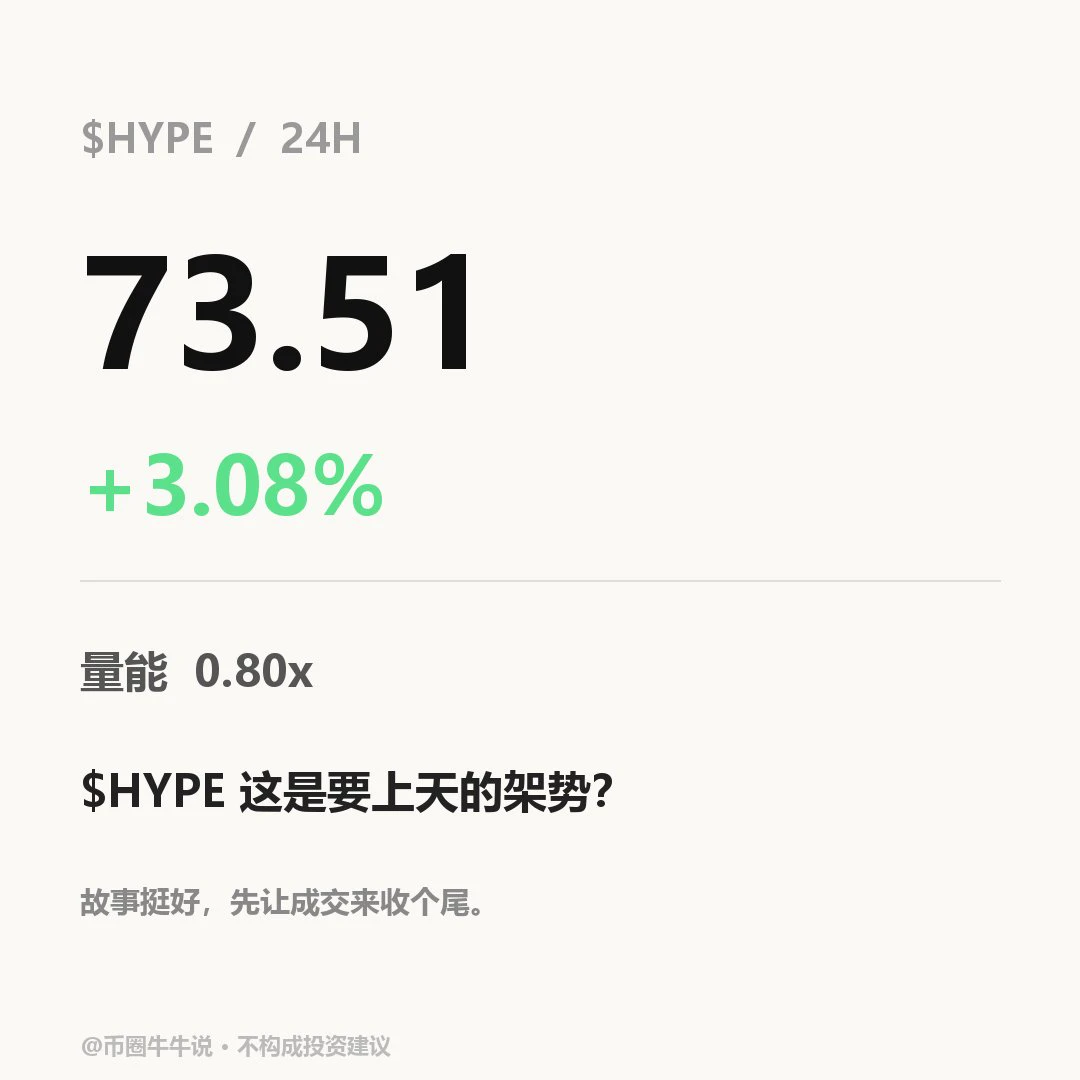
$HYPE Currently at 73.51, up 3.09% over 24H. 1H is leaning bullish: price is above the EMA20 at 72.03, with RSI at 58.5; 4H is also leaning bullish, with EMA20 at 72.70 and RSI at 57.3. The two timeframes are aligned to the upside, and the volume ratio of 0.80 indicates reasonable participation. Watch: Only a sustained hold above the 73.86 resistance level (also the 24H high) would suggest further strength; a break below the 69.55 support level without a recovery would damage the bullish structure. In the next review, focus on whether price can hold above 73.86 and recover after losing 69.55;
post-image
HYPE+0.24%
Longs and shorts are being liquidated at the same time—what exactly is happening in the market?

In crypto futures trading, there is a phenomenon that confuses many people: when the market is clearly rising, why are some traders still getting liquidated? More puzzlingly, sometimes prices surge rapidly and then suddenly fall, resulting in large numbers of both long and short positions being liquidated.

What exactly causes this?

First, liquidations do not happen in just one direction. When prices rise rapidly, highly leveraged shorts may be forcibly closed because of insufficient margin. If pr
post-image
Load More

Join 40 M users in our growing community

⚡️ Join 40 M users in the crypto craze discussion

💬 Engage with your favorite top creators

👍 See what interests you

Trending Topics

JensenHuangResigns

518.2K Views8.2K Discussing

Jensen Huang has resigned as NVIDIA CEO and stepped down from the board. CFO Colette Kress will serve as interim CEO while NVIDIA considers internal and external successors. $NVDA fell more than 10% in premarket trading following the announcement. With one of AI’s most influential leaders stepping aside, markets are now reassessing NVIDIA’s leadership stability, AI strategy, and long-term valuation.

GateIPOAccessAnthropic

281.9K Views2.6K Discussing

Dr.HanOxfordUnionSpeech

144.8K Views473 Discussing

View More