Share your thoughts
placeholder
Article
We recommend that everyone join the group and communicate more. Strategies will be posted in the group every day for everyone’s reference!
post-image
[New Streamer] Market Prediction
live-cover
LIVE610
Insiders are quietly pressing SHORT on $SKHYNIX /USDT before the daily range breaks.

$SKHYNIX /USDT - SHORT

Trade Plan:
Entry: 1344.77 – 1347.17
SL: 1357.45
TP1: 1337.36
TP2: 1331.62
TP3: 1323.01

Why this setup?
Why now? The 4h bias is SHORT with 55% confidence, and the 1h price is pinned at 1345.97, right inside the entry zone of 1344.77 to 1347.17. The 15m RSI is 79.37, signaling short-term exhaustion that supports a downside move, while the 1h ATR of 4.784316 shows enough volatility to reach the first target at 1337.36 and the second target at 1331.62. The daily trend is range, so thi
SKHYNIX-0.55%
#GateTrenchesExclusive0GasTrading
GATE TRENCHES IS REDUCING THE FRICTION OF ON-CHAIN TRADING
Crypto infrastructure is moving toward a more connected model, and Gate Trenches is an interesting example of how that transition is taking shape.
For many users, the biggest challenge with on-chain trading is not finding an asset. It is everything that comes before the trade: choosing the correct network, preparing the required gas token, connecting the right wallet, transferring funds and understanding the transaction costs.
Gate Trenches is designed to simplify that journey.
One of the most notable
ARC-10.48%
$AKE Signal】Go long + negative funding support, place orders on 1H pullback
$AKE 4H RSI 80.15, 1H RSI 68.59, order book bid depth ratio 1.46. The 4H MACD bullish histogram is contracting, while the 1H MACD bearish histogram is expanding, indicating layered short-term momentum. Negative funding rate at -0.0432%, with OI stable and short holding costs relatively high. The 1H Bollinger middle band is 0.0585 and upper band is 0.0741, with price moving along the middle-to-upper band area. Buy the pullback at 0.06375117 - 0.06394300, stop loss at 0.06330357, targets at 0.06490214 / 0.06538172. Ri
post-image
AKE+44.40%
BTC+0.14%
ETH+0.58%
SOL-2.17%
I had already finished complaining to my friends about this week’s market, but now I have to take it all back. A little awkward.

A few days ago, before bed, I looked at $AAOI . Every push higher fell just short, volume didn’t follow, and there was no one to take it higher, so I flagged a short near the top. Held the short from 152.22 to 106.57, with +1444.23% giving the answer directly.

Take 80% off the table first, and leave +1444.20% as a protected cost basis so a rebound doesn’t give the profits back. Panic comes from having no plan; losses come from overthinking.

Better to miss a lim
post-image
AAOI+1.73%
SOL-2.20%
ADA+1.07%
$LSK Short-term bullish, but this is a contrarian rebound play, not trend chasing.
From a funding perspective, LSK’s funding rate is -0.1138%, with shorts continuously paying to hold positions, indicating that short crowding is currently high. The price has fallen 9.37% over 24h, RSI has dropped to 36.4, approaching oversold territory, while the current price of 0.4032 remains above MA5 (0.4016). Short-term moving averages are beginning to flatten, signaling a potential bottom after the sharp decline. The MACD histogram remains negative, so the trend has not reversed; this can only be defined
post-image
LSK-9.17%
BCH-0.34%
PENGU+0.27%
Everyone watching gold long just missed the short setup forming right now.

$XAU /USDT - SHORT

Trade Plan:
Entry: 4380.3 – 4382.3
SL: 4389.2
TP1: 4375.4
TP2: 4371.4
TP3: 4365.5

Why this setup?
Why now? The 4h trend is range-bound, but the 1h RSI at 39.3 signals bearish momentum is building inside that range. The 1h ATR of 3.94 shows enough volatility to push from the entry zone at 4381.3 down toward the first target at 4375.4, with a second target waiting at 4371.4. The daily range structure keeps the move contained, but the invalidation level at 4370.0 is the hard stop that would flush t
XAU-0.12%
Smart money is quietly stacking shorts on $ADA /USDT while retail chases pumps.

$ADA /USDT - SHORT

Trade Plan:
Entry: 0.2264 – 0.2278
SL: 0.2341
TP1: 0.2218
TP2: 0.2183
TP3: 0.2131

Why this setup?
Why now? The 1h price is holding at 0.2271 inside a tight range, and the 15m RSI at 45.43 shows momentum is already fading into the entry zone between 0.2264 and 0.2278. The 1h ATR of 0.002924 tells us volatility is compressed, which often precedes a sharp directional move. With the daily trend stuck in range, a break below invalidates the setup at 0.2138 and exposes TP1 at 0.2218, TP2 at 0.218
ADA+1.07%
Useless | Bearish bias 🔴 | 15m trend pullback/continuation · Confidence: 86/100 Watch: 0.25512 Invalidation: 0.264646 (3.73%) Targets: 0.243212 / 0.236067 / 0.226541 RSI14: 33.2 · ADX14: 42.1 · Volume: 0.66x Invalid if the 15-minute candlestick closes below the invalidation level. For educational purposes only. Not financial advice. Leverage risk is extremely high.$USELES
post-image
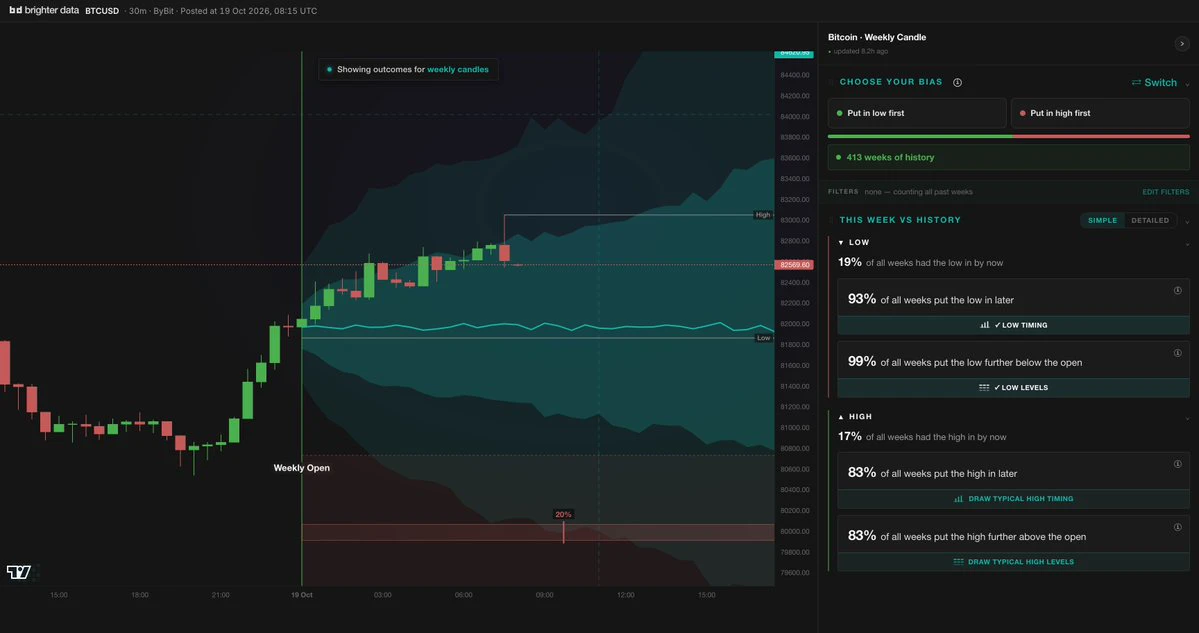
There aren't that many bulls coming; it's all just a mirage. The next move is still to short the rebound: short at 81500-82000, target 79500-80000.$BTC $ETH
BTC+0.14%
ETH+0.58%
Ethereum returned to $2,628, while Ethereum spot funds saw net outflows of $366 million over two days.
Price and capital are moving in opposite directions. This combination usually indicates that the driving force is not on the fund side. Buying is coming from spot markets, while selling pressure is coming from institutions adjusting their asset allocations. The two forces are accounted for separately—when one lets go first, the price tilts in its direction.
The focus is very narrow: once fund outflows stop, is the price still above $2,600? If outflows continue while the price rises, that is a
post-image
ETH+0.58%
Long trade on $FET .
Entry zone: 0.1745 - 0.1759 Take-profit targets: 0.1834 - 0.1900 Stop-loss (SL): 0.1693 RSI “plunged into the abyss” in a cryogenic chamber? It’s time for a dead-cat bounce! Note: If 0.1758, this key structural low, cannot hold, the rebound will be invalidated and trigger further downside continuation. Never go all-in, mate. Use a position size suitable for your own account size. Buying pressure below. Today, keep an eye on 👇👇👇, $ET and $ONE .
post-image
FET-4.43%
Everyone is ignoring this bearish setup on $ENA /USDT

$ENA /USDT - SHORT

Trade Plan:
Entry: 0.20483 – 0.20813
SL: 0.22705
TP1: 0.19105
TP2: 0.18076
TP3: 0.16533

Why this setup?
Why now? The daily trend is bullish but the 1h price is sitting at 0.20645, the 15m RSI is 60.54 and the 1h ATR is 0.006594, which means the asset is resting inside a tight entry zone between 0.20483 and 0.20813 with room to break. The 84% confidence score for a SHORT bias signals that this is a high-conviction setup, not a random short. A move down would first target TP1 at 0.19105 and then extend to TP2 at 0.180
ENA+21.88%
The momentum is building and the heat is real. If you could only board this flight with ONE token, which one are you holding tight to the top? Drop your highest conviction ticker below! 👇🚀 #AltcoinSeason #CryptoCommunity #HODL #Memecoins #Web3
post-image
Live trading - prediction hot crypto market
live-cover
LIVE41
$CELR Can it still be chased after surging 57% in a single day? The answer is: this is not the time to chase longs, but to wait for a pullback and exchange discipline for room to maneuver.
First, look at the risk coordinates. $CELR The current price is 0.003604, already above the Bollinger upper band at 0.00328, with RSI as high as 92.9, indicating extreme overbought conditions; although MA5 at 0.0031 remains above MA20 at 0.00255, maintaining a bullish alignment, the MACD histogram at +0.000118 is still expanding, while the amplitude over 30 candlesticks has reached 37.99%, placing volatility
post-image
CELR+51.53%
INJ+24.48%
If you bought $1,000 of $LAPTOP at launch, you’d have about 10 cents left now.
post-image
LAPTOP+0.10%
Everyone, $BTC has perfectly hit the final target of our long-term trade, with the price reaching $81
,000. The chart now shows rejection of a rebound and downside pressure—short now. Entry: $81,000 – $81,150targets: $80,500 / 79,500 / 78,500Stop-loss: 82,270
post-image
BTC+0.14%
Gold posted a clear decline-then-rebound pattern this week.
  At the beginning of the week, the market priced in expectations of a Federal Reserve rate hike ahead of time, putting gold under continued pressure. Gold fell to around 4279 on Tuesday. After the Fed raised rates by 25 basis points on Wednesday, gold prices dipped further to around 4262, but did not form a sustained breakdown.
  As crude oil prices fell, the dollar weakened, and U.S. Treasury yields declined on Thursday and Friday, gold rebounded rapidly, reaching a high near 4400 before stabilizing around 4378 and ending its previo
post-image
XAU-0.12%
Load More

Join 40 M users in our growing community

⚡️ Join 40 M users in the crypto craze discussion

💬 Engage with your favorite top creators

👍 See what interests you

Trending Topics

JapanRealEstatePowerChipStocksRise

59.79k Views4.55k Discussing

Japan's Nikkei extended gains on Sept 18, with real estate, power, and semiconductor sectors leading. Gate covers over 12,800 global stocks and ETFs, offering one-stop USDT trading across US, HK, Korean, and Japanese markets. [👉 Read more](https://www.odaily.news/en/newsflash/518749)

USAIConceptStocksRally

34.49k Views1.01k Discussing

GateTopsStockPerpetualCoverage

38.88k Views2.61k Discussing

View More