Share your thoughts
placeholder
Article
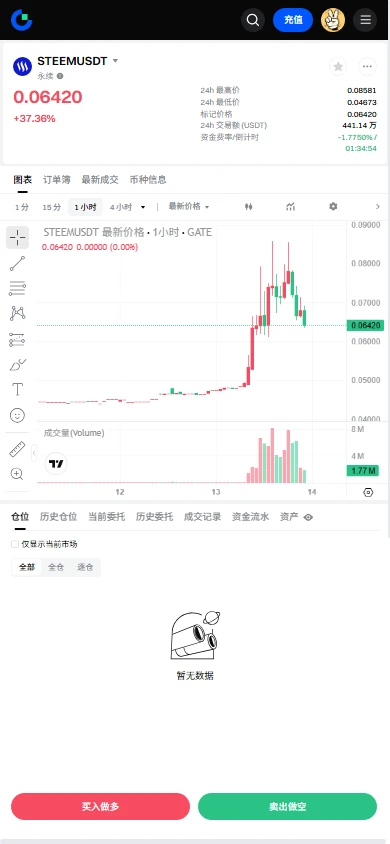
$STEEM Signal】Long + negative funding rate short squeeze
$STEEM 1H retests the EMA20 area, while the 4H bullish structure remains intact. RSI: 78.04 on 4H and 58.63 on 1H. The 4H bullish MACD histogram is shrinking, while the 1H bearish histogram is expanding. The buy/sell depth ratio is 0.52, with relatively heavy sell orders above. The funding rate is -1.1051%, and short costs are rising sharply. OI is stable.
🎯Direction: Long
⚡Entry/Orders: 0.0665597 - 0.0667600
🛑Stop-loss: 0.0634220
🚀Target 1: 0.0717670
🚀Target 2: 0.0742705
🛡️Trade Management:
- Execution strategy: After reaching Tar
post-image
STEEM+28.04%
[New Streamer]MARKET UPDATE ETH/BTC
live-cover
LIVE1,746
#SenateReleasesNewCLARITYAct
A major moment for U.S. crypto regulation is unfolding in Washington.
The U.S. Senate has released a revised version of the CLARITY Act, a major piece of proposed legislation designed to establish a clearer regulatory framework for digital assets in the United States.
The updated text arrives at a critical moment for the crypto industry, with lawmakers preparing for a key procedural vote.
This is not simply another regulatory update.
The CLARITY Act could influence how digital assets, crypto exchanges, decentralized finance, token issuers, market participants, and
  • 2
  • 1
market prices updaes of $MEME COINS
live-cover
LIVE787
The three-plus calls I just posted in the update all worked out.
I called the entry; manage your take-profit yourself.
I’ll continue providing trade signals on Monday.
🎬 Zuo Zuo Evening Session|Weekend trading, two witnesses missing
BTC is still trading, but oil prices and U.S. Treasury futures have not opened yet. A rebound in crypto prices cannot rubber-stamp cross-market risk.
On Monday, I’ll be watching two things: whether oil prices can pull back after a gap up, and whether yields continue to rise. If energy and interest rates apply pressure at the same time, rebounds in U.S. stocks and crypto will be even harder to sustain.
The witnesses aren’t all here yet, so don’t rush to declare the case closed.
post-image
BTC-0.34%
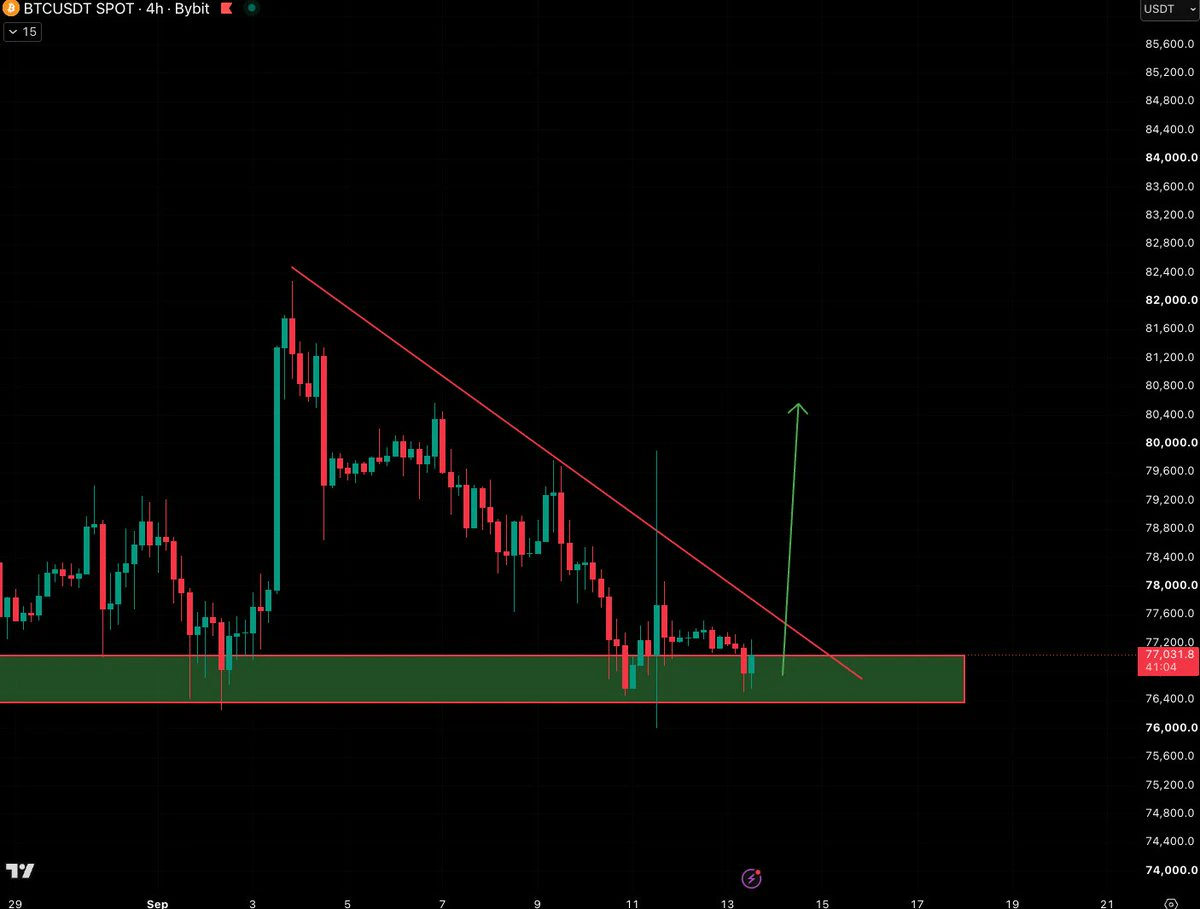
$BTC Bulls need to wake up here
post-image
BTC-0.34%
#ShareWeekly
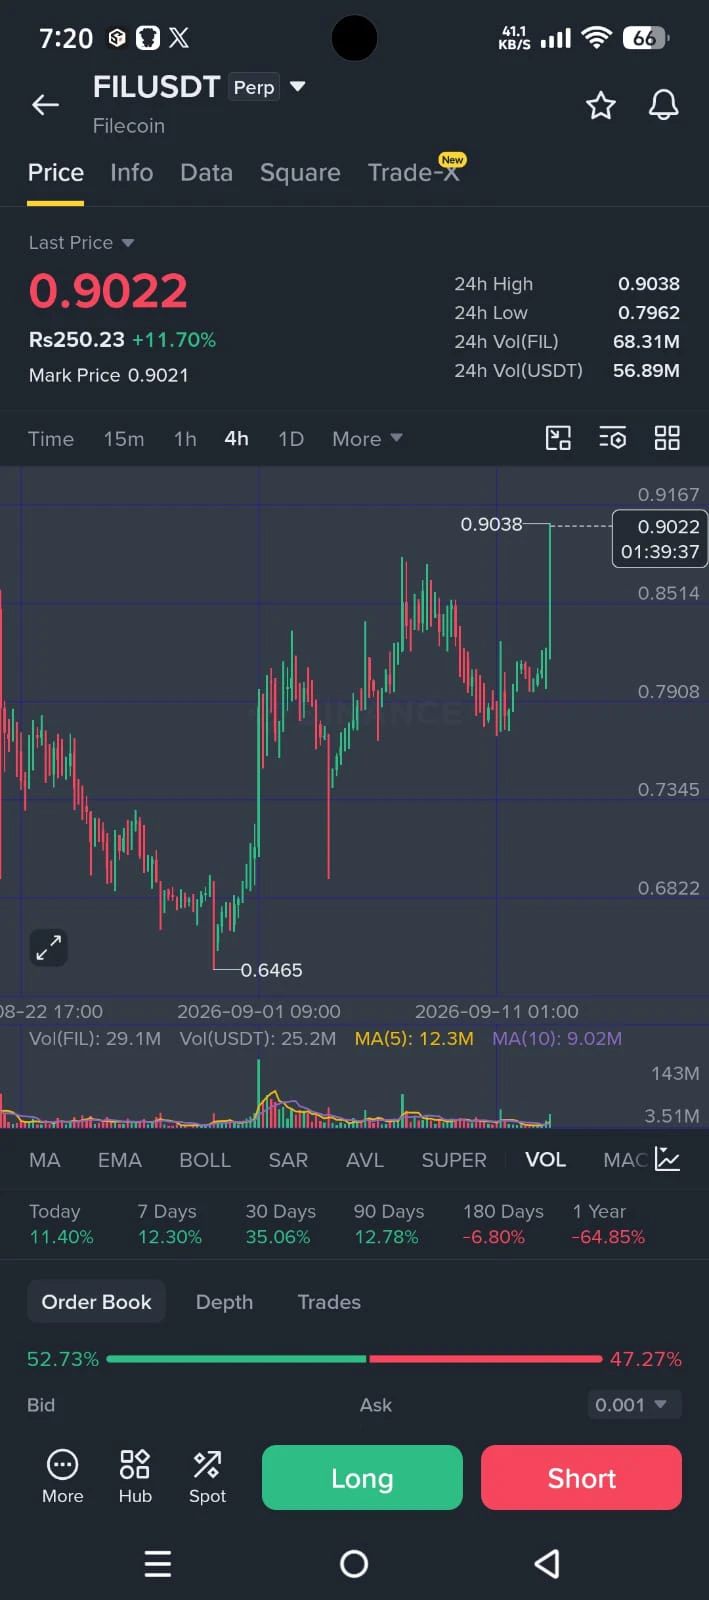
#FIL The move is real, but the next candle is not the trade
Fil coin has suddenly come back onto the radar, and what interests me is how fast the move happened. FIL pushed from the mid-$0.85 area to around $0.91, with a sharp intraday burst taking it to roughly $0.915. This is no longer a quiet recovery — momentum has clearly returned.
The latest data has FIL around $0.911, with roughly +12.7% over 24h and +15.4% over 7 days. 24h trading volume is about $111.85M, while market cap is around $753M. The latest reported 24h range is approximately $0.797–$0.921.
The important thing
post-image
FIL+16.98%
I said this morning that there would be a major pullback. Long positions must have stop-losses. The decline began at 16:05 Beijing time this afternoon. This $ETH pullback should reach at least 2460, with a long lower-wick spike. It looks like we need to wait for a rebound first and then wait for a bearish signal. The market trend is currently upward, so it may consolidate around 2500.
#8月核心CPI超预期
ETH-1.75%
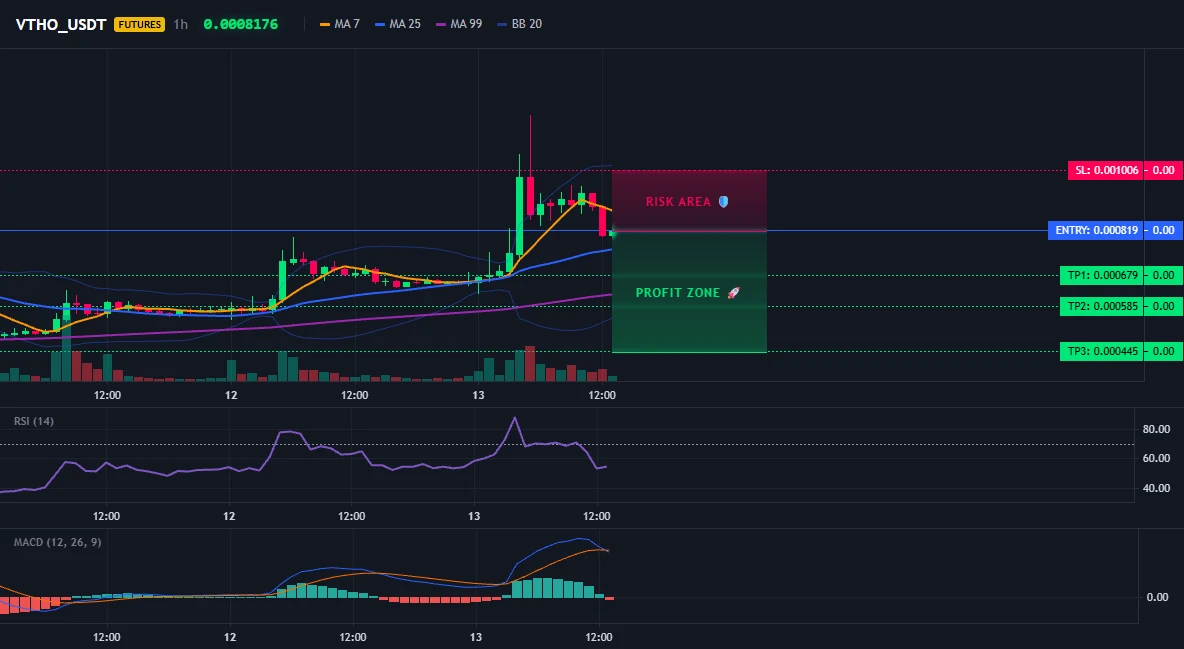
Everyone is missing that VTHO is already flashing bearish signals while they wait for a pullback that may never come.

$VTHO /USDT - SHORT

Trade Plan:
Entry: 0.000799 – 0.000838
SL: 0.001006
TP1: 0.000679
TP2: 0.000585
TP3: 0.000445

Why this setup?
Why now? The 1h price sits at 0.000819 inside the entry zone, the 15m RSI reads 41.4 confirming weakening momentum, and the 1h ATR of 0.000078 shows volatility is compressed enough for a sharp move. The daily trend is range-bound, which often precedes a directional breakdown once sellers exhaust the upper boundary. Target 1 is 0.000679, target
post-image
VTHO+19.11%
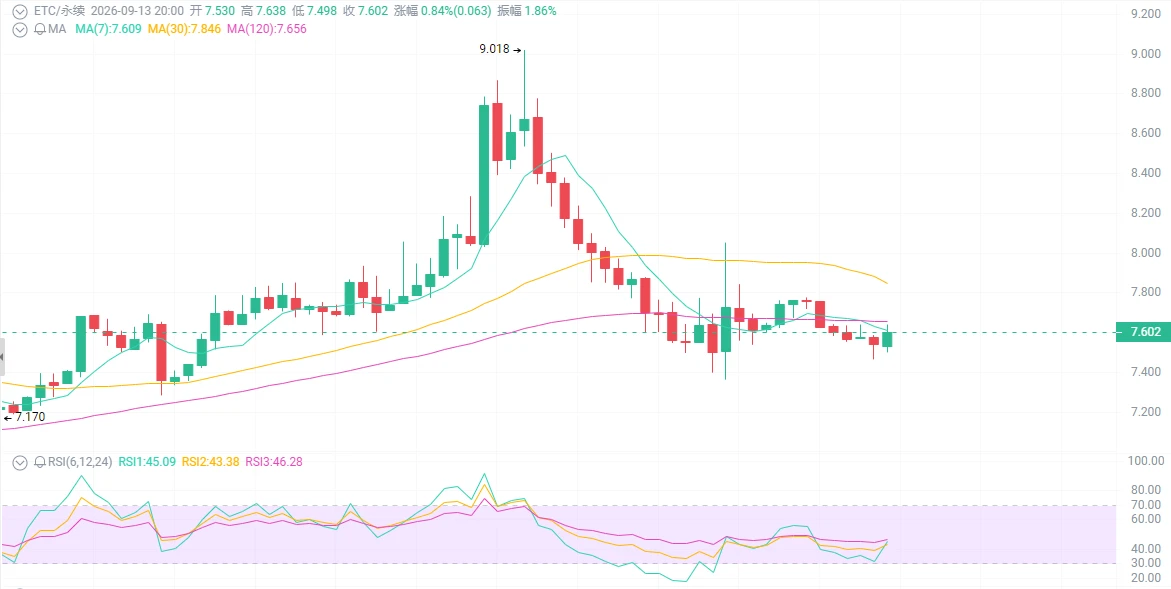
ETC at $7.6, do you want to buy the dip?
Look at the surface first: an old-school PoW rotation, rallying to 8.7-9.1 before retreating to 7.6. Retail traders curse “ETC garbage,” but the candlesticks tell you: the 30-day structure is still intact, and 7.45 has not broken. This is a pullback after failing at the top of the range, not a collapse.
First: when the rotation comes, you are everyone’s sweetheart; when the rotation leaves, you become Madam Niu.
That September 9 rally was essentially not an explosion in ETC fundamentals.
It was capital seeking high-Beta rotation into old-school PoW/L1 a
post-image
ETH-1.79%
BTC-0.34%
ETC-2.41%
$LSK Up 256% in 24 hours, with the current price at 0.9096, but this move—spiking to 2.37 before crashing back to 0.22—is clearly a meat-grinder market. It is now the afternoon of April 17, with less than 8 hours remaining before the daily candle closes, and the time window is closing.
First, let’s look at the chart. The 24-hour trading volume is 3.07 billion, which is dozens of times the usual volume for an old coin with a circulating market cap of only a few hundred million. The range from the low of 0.222 to the high of 2.37 offers a tenfold spread. If you placed an order at 0.22 and got fi
LSK+283.84%
GM
If you woke up this morning
Your winning
post-image
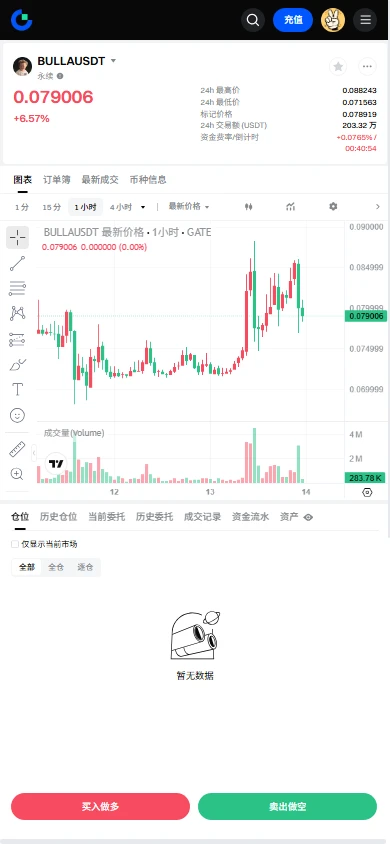
$BULLA Signal】Long + 1H pullback to EMA20 support, 4H momentum continuation
$BULLA A 1H candle spiked down to 0.076751 with a long lower wick, and the current price has recovered to 0.08048. Buyers are actively supporting the 1H EMA20 around 0.0792.
Order book depth imbalance: -4.00%, buy/sell ratio: 0.92. Selling pressure is being quickly absorbed.
The 4H MACD histogram at 0.0005 continues to expand, while the 1H histogram has contracted to 0.0003, indicating slowing short-term momentum. The 4H Bollinger midline at 0.0757 and EMA50 at 0.0695 form a lower support zone. The funding rate is 0.0
post-image
BULLA+6.14%
BTC-0.34%
ETH-1.79%
SOL-1.69%
Which #crypto project will do this?
post-image
I’ve been too busy lately and haven’t had time. I can only dabble in altcoins.
$SNDK /USDT just broke a hidden range that most traders completely missed.

$SNDK /USDT - LONG

Trade Plan:
Entry: 1578.21 – 1584.13
SL: 1544.26
TP1: 1608.85
TP2: 1627.31
TP3: 1654.99

Why this setup?
Why now? The daily trend is range, which means SNDK has been coiling inside a tight band, and the 1h ATR of 11.829651 confirms that the average move per hour is small enough for a sharp breakout to still be fresh. The 15m RSI sitting at 47.05 shows the short-term momentum is neither overbought nor oversold, leaving room for a decisive push without a premature reversal. The entry zone between 1
SNDK-3.68%
NEAR is silently coiling for a massive breakout while everyone watches Bitcoin.

$NEAR /USDT - LONG

Trade Plan:
Entry: 2.3016 – 2.3166
SL: 2.2371
TP1: 2.3631
TP2: 2.3991
TP3: 2.4531

Why this setup?
Why now? The daily trend is firmly bullish, setting the stage for continuation. The 1h price is sitting at 2.3091, right at the entry_ref, which aligns perfectly with the entry zone of 2.3016 to 2.3166. The 15m RSI at 48.1 shows we are not overbought, leaving room to run. The 1h ATR of 0.03001 confirms the volatility needed to push toward the first target at 2.3631. The invalidation level is th
NEAR-4.95%
#每周来晒 #8月CPI数据出炉
AUGUST CPI CHANGES THE FED STORY
The latest U.S. CPI report has put monetary policy back at the center of the market.
August headline CPI increased 0.4% month-over-month and 3.4% year-over-year, while core CPI rose 0.3% monthly and 2.4% annually. The headline and annual figures matched expectations, but the inflation picture remains clearly above the Federal Reserve’s 2% target.
For me, the most important question is no longer simply whether inflation is rising or falling.
The bigger question is whether inflation is cooling quickly enough for the Fed to become less restrictiv
BTC-0.34%
SPX500-0.33%
XAU-0.22%
XAUUSD+0.74%
  • 2
  • 1
#AugustCoreCPIBeatsExpectations
August inflation data is sending an important message to global markets.
The latest August Core CPI reading beat expectations, putting inflation, interest rates, the Federal Reserve, Treasury yields, the U.S. dollar, equities, and crypto markets back in focus.
Core CPI is one of the most closely watched inflation indicators because it excludes food and energy, two categories that can experience significant short-term volatility. That makes the core reading particularly important when markets are trying to understand the underlying inflation trend.
A stronger-th
  • 3
  • 1
Load More

Join 40 M users in our growing community

⚡️ Join 40 M users in the crypto craze discussion

💬 Engage with your favorite top creators

👍 See what interests you