


Square
Following
Hot
News
Profile
Share your thoughts
placeholder
Article
10.16 Gold $XAU Recent Strategy Gold has been moving sideways within this range since falling at the end of September, with 4220 on the upside and 4110 on the downside. We have gradually sold high and bought low several times here.
Here is what we are doing now: 1. Short-term strategy: go long at 4100, exit around 4200, with a hard stop-loss at 4020. 2. After playing a few short-term rounds, switch to a long-term position (you can choose PXAG due to the high weekend fees). The unchanged point for both long-term and short-term trades is going long at 4100 with a stop-loss at 4020; the only dif
post-image
XAU+1.57%
solana:7cSPCV6Sadhcuk8zBa7o7mu2ny4ccmXB8XU6HcqPcSqY Privacy Inu this one is a no brainer at $4,700 mc could bounce 2-3x with minimum 40% pump
7cSPCV6Sadhcuk8zBa7o7mu2ny4ccmXB8XU6HcqPcSqY
#crypto
post-image
SOL+1.42%
$INJ ‌ has flipped the momentum, and buyers are back in control.
After dipping to $7.061, INJ has rallied to $8.56, reclaiming key levels with a strong hourly breakout. The Supertrend has turned bullish at $7.81, adding strength to the setup.
Key levels:
Support: $8.25–$8.30
Stronger support: $7.80–$7.95
Resistance: $8.56–$8.63
Targets: $8.80 → $9.00
A clean break above $8.56 could extend the move, while holding above $8.25 would keep the recovery structure healthy. After this sharp rally, a retest would be constructive.
INJ is looking stronger. Now it needs to turn this breakout into sustai
INJ+10.27%
NVDA-1.92%
  • 2
$XAU /GOLD, I am swing long here.
Price deviated below the March lows through the summer and reclaimed them. The October pullback is now retesting that level from above, with today's wick sweeping into it and closing back above.
It can take some time to play out but the structure is clean.
Targeting the March highs for the full setup. Invalidation is acceptance back below the level.
post-image
XAU+1.57%
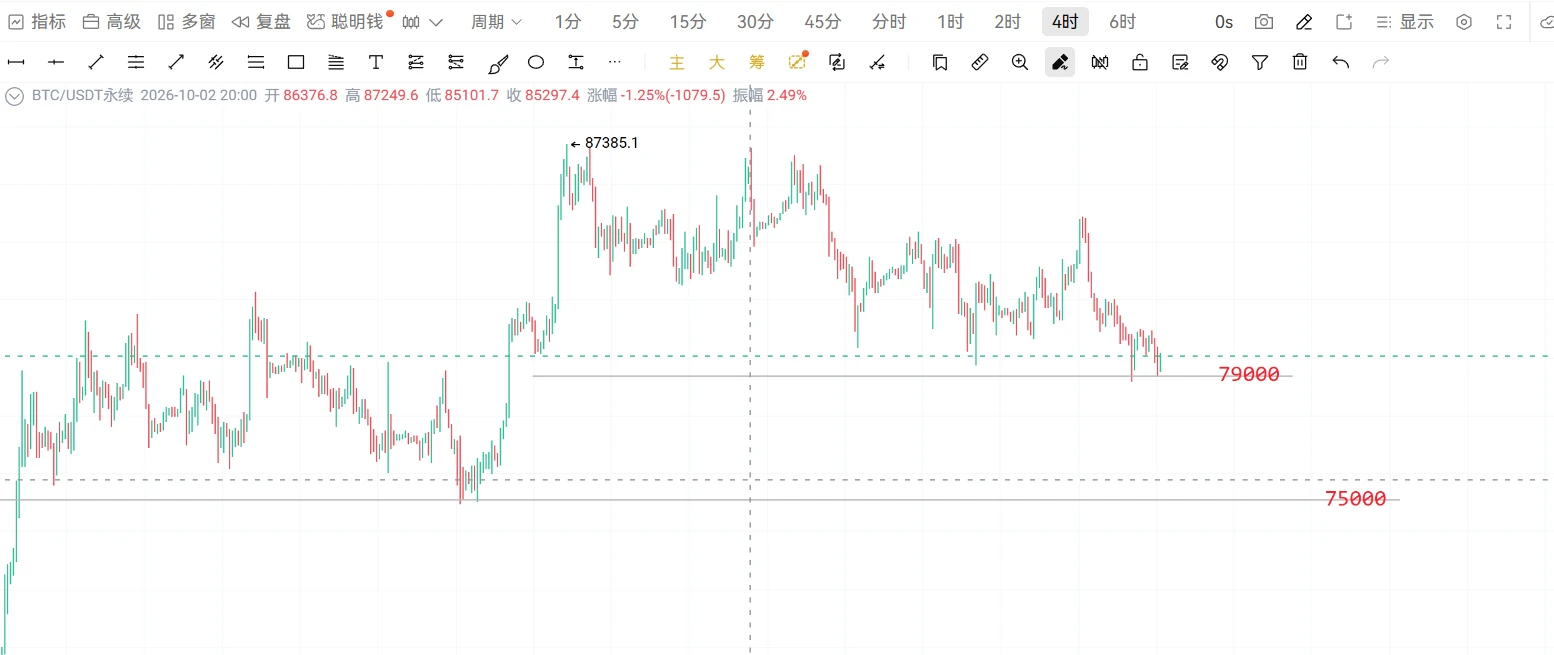
October 16 $BTC Strategy: Based on the current market, BTC's upward movement is being blocked by the 84200 resistance level. We continue to expect a pullback in the near term, but the decline has not been deep.
Do not rush to buy the dip. Open short positions in the 83500-84000 range, with a stop loss at 84500 (the starting point of the decline on October 7). If a solid bearish candle continues to break below 81800, keep the stop loss at breakeven.
Wait for a new low to appear. Reduce short positions in the 79200-78000 range and look for an opportunity to enter long positions.
post-image
BTC+0.35%
Gold has climbed back above 4150, while silver is hovering around 57. The dollar has weakened, and Treasury yields have pulled back a bit too.
But don’t celebrate too soon. Oil prices are still rising, and inflation hasn’t gone anywhere. This rebound looks more like a breather than a turnaround.
What I’m watching is whether gold can hold above 4150 if oil surges again next week.
If you see it differently, tell me why.
post-image
GLDX+1.96%
PAXG+1.41%
🧑‍🍳 I touch crazy to get something done…and we all become friends 🫢
$SKHY
The memory market is straight out of the hog cycle: prices rise, capacity expands; capacity expands, the market crashes; the market crashes, production is cut; production is cut, prices surge again. The entire industry is now pushing hard to ramp up production. If AI demand can’t outrun capacity, beware of the accelerated version of “storage means death” turning into “storage means king.” Those holding positions should wait for the November earnings reports, sell into the rebound, and keep something in reserve. Spend less time scrolling short videos—the sentiment is even more volatile th
post-image
SKHY-0.94%
Excited to share our portfolio snapshot! 🚀 Focused on DeFi, yield farming, and funding arbitrage for optimal gains. 📊 Dive in and explore the insights below! #Crypto #Trading #Portfolio #DeFi
Ready to start your journey?
post-image
are cats gonna end up trading better than pigs?
post-image
Range-bound SKHYNIX is about to break out and most traders are positioned the wrong way.

$SKHYNIX /USDT - SHORT

Trade Plan:
Entry: 971.37 – 978.79
SL: 1010.69
TP1: 948.37
TP2: 930.56
TP3: 903.85

Why this setup?
Why now? The daily trend is range, but the 1h ATR of 14.839521 signals a squeeze is building inside that range. The 15m RSI at 58.85 shows momentum is not yet exhausted, so a short entry near 975.08 is valid as long as we stay below 978.79. TP1 at 948.37 and TP2 at 930.56 define the first two targets on the path down, while the invalidation level of 1156.63 is the hard line that w
SKHYNIX-5.77%
US oil is pumping
And you still believe in the BTC pump?
BTC+0.31%
Many people reflexively buy the dip as soon as they see a 15% drop in 24 hours, while ignoring broader market sentiment and sector correlation—this is the most typical trading misconception. The Fear and Greed Index is 53, neutral but leaning cautious. There has been neither panic selling nor greedy capital stepping in, so looking at a coin’s decline in isolation is meaningless at this point.
$AV Down 15.18% today, with a trading volume of only 6.2M USDT, a typical low-volume sharp drop. However, the technicals have not deteriorated: MA5=0.27448 remains above MA20=0.26686, so the medium-term
post-image
XPL+7.58%
Don’t even think about touching $BAT . It surged 26% in 24 hours, spiked to 0.2172 before crashing back to 0.2115, with $93 million in trading volume—this bizarre price-and-volume surge is a falling knife retail traders can’t catch.
But on-chain data shows that BAT’s active addresses have risen 40% over the past 7 days, while the Brave browser’s monthly active users have surpassed 80 million, so there is indeed substance to its fundamentals. The question is: Is this rally driven by news or purely a pump-and-dump? The order book shows huge sell orders around 0.2172, indicating extremely heavy sh
BAT+26.74%
CPI Comes in Hotter Than Expected
live-cover
LIVE79
$ETH Long Catches a Fresh Flush Partial Bounce, No Momentum Confirmation
Pair: $ETH /USDT
Direction: LONG
Entry Zone: 2364.29
Take Profit:
- TP1: 2423.13 +2.5%
- TP2: 2462.36 +4.1%
- TP3: 2521.20 +6.6%
Stop Loss: 2285.83
Chart Structure:
- ETH declined steadily from ~2480 through MA7, MA25, and MA99, then printed a sharp flush candle down to ~2285-2300 before bouncing to current price
- Price remains well below all three moving averages this is a bounce attempt within an intact downtrend, not a reclaim
- RSI(14) dropped to ~25 at the flush low and has only partially recovered to the high-
ETH+1.52%
  • 2
Why is INJ so strong?? wtf is going on over there, has tech changed??
post-image
INJ+10.27%
🔹Whale Dumps BTC and Loads Up on ETH! After selling 237.8 BTC and buying 7,929 ETH, is big money be
live-cover
LIVE58
BTC is currently around 82400; after the previous pullback, it has staged a short-term corrective rebound, but the upside follow-through is weak. This is a technical recovery after the decline, with no trend reversal signal appearing for now. The broader structure remains range-bound with a bearish bias.

On the 4-hour chart, the price is below the moving averages, and rebound volume is insufficient, indicating a weak consolidative recovery. The overhead resistance zone is substantial. As long as the price fails to firmly hold above resistance, this rebound is more likely to be a continuation
post-image
BTC+0.35%
SANDISK $SNDK REJECTING MOVING AVERAGE RESISTANCE ARE BEARS TARGETING $1,272.23 NEXT?
Trade Parameters

Pair: $SNDK /USDT
Direction: SHORT
Entry Price: 1,347.86
Target Levels (Take Profit)
🎯 TP 1: 1,302.48 3.37%
🎯 TP 2: 1,272.23 5.61%
Stop Loss
SL: 1,408.36
Technical Breakdown
SNDK ($1,348.19) faced strong rejection following an aggressive upward push, printing a topping wick that stalled out right at structural resistance. This price action confirms persistent seller defense and sets up a clean continuation toward lower targets.
Price action tested areas above short-term moving ave
SNDK-1.34%
Load More

Join 40 M users in our growing community

⚡️ Join 40 M users in the crypto craze discussion

💬 Engage with your favorite top creators

👍 See what interests you

Trending Topics

USSeptemberPPIBeatsExpectations

91.35k Views1.88k Discussing

US September PPI came in at 6.3% YoY, well above the 5.3% market expectation, pointing to renewed producer-side inflation pressure. Weekly jobless claims were 199K, broadly in line with forecasts. Could hotter inflation further reduce room for rate cuts, and what does it mean for $BTC, US stocks, and gold?

DrLinHanSpeaksAtOxfordUnion

135.63k Views1.86k Discussing

JapanAndKoreaStocksPlunge

47.27k Views1.76k Discussing

View More