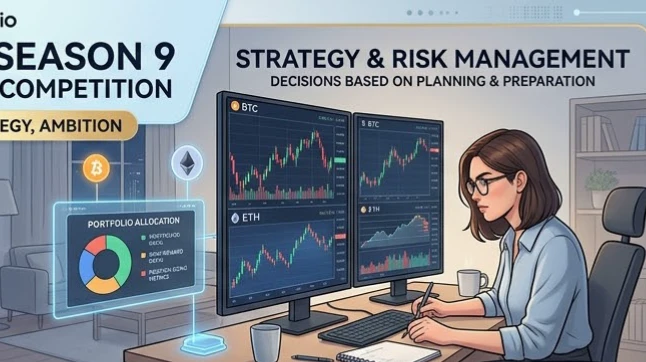

#GateWCTCS9GlobalTradingCompetition Gate WCTC Season 9, A Global Trading Competition That Brings Opportunity, Strategy, and Ambition Together
The global crypto market is entering another exciting chapter as traders continue searching for opportunities to demonstrate their skills, discipline, and market knowledge. Gate WCTC Season 9 Global Trading Competition brings the spotlight to competitive trading, where preparation, patience, and strategic thinking can make a meaningful difference.
For every trader, a competition is more than a race to generate profits. It is an opportunity to test a strategy, understand market behavior, manage risk, and learn how decisions perform under pressure. In a market where prices can change rapidly, the ability to remain disciplined can be just as important as identifying a promising trade.
WCTC Season 9 represents the competitive spirit of the cryptocurrency community. Traders from different backgrounds and regions share a common interest in digital assets, market movements, and the challenge of making informed decisions. A global trading competition creates an environment where participants can measure their performance while gaining a deeper understanding of their own trading habits.
Bitcoin and Ethereum remain important assets to watch as traders evaluate market momentum, liquidity, volatility, and changing investor sentiment. However, successful participation requires more than following popular coins or reacting to sudden price movements. Every decision should begin with a clear plan and an understanding of the risks involved.
One of the most valuable lessons in trading is that opportunity and risk always exist together. A strong market can encourage confidence, but excessive confidence can lead to poor decisions. A sudden reversal can challenge even experienced traders. That is why risk management, position sizing, and emotional control remain essential throughout a competitive trading environment.
Gate WCTC Season 9 also highlights how cryptocurrency trading has evolved into a global activity. Traders now have access to advanced market information, digital trading tools, and communities that discuss strategies across different time zones. Competitions can bring these participants together around a shared passion for understanding the markets and improving their performance.
For beginners, the most important goal should be learning rather than chasing a leaderboard. Studying price action, understanding order types, and recognizing the effects of volatility can build a stronger foundation for future decisions. New traders should avoid risking money they cannot afford to lose and should never assume that a competition guarantees profits or rewards.
Experienced traders can use a competition as an opportunity to evaluate consistency. One successful trade does not necessarily demonstrate a reliable strategy, just as one losing trade does not automatically mean a strategy has failed. What matters is the quality of the decision making process, the ability to control risk, and the willingness to learn from both positive and negative outcomes.
The psychology of trading deserves special attention. Fear can cause traders to exit too early, while greed can encourage them to hold a position beyond their original plan. The pressure of competition may intensify these emotions, making discipline even more important. A carefully planned approach helps traders avoid turning every market movement into an emotional decision.
Before participating in Gate WCTC Season 9, traders should review the official competition rules, eligibility requirements, registration process, competition period, ranking methodology, and any applicable reward conditions. Participants should also verify whether particular trading pairs or account types qualify. The official Gate announcement should be treated as the primary source for confirmed details.
It is equally important to remember that trading volume and profitability are not the same thing. Generating more volume does not automatically mean a trader is making better decisions. Excessive trading can increase fees and expose an account to unnecessary risk. A thoughtful strategy should focus on sustainable decision making instead of taking trades simply to remain active.
The real value of a trading competition lies in the combination of opportunity and experience. Participants can challenge themselves, review their performance, refine their strategies, and develop habits that remain useful beyond the competition itself. Every market cycle offers lessons, but those lessons become valuable only when traders take the time to understand them.
Gate WCTC Season 9 Global Trading Competition places the competitive side of cryptocurrency trading in focus. It reminds the community that trading involves preparation, adaptability, patience, and responsibility. Whether someone is an experienced market participant or a developing trader, a disciplined mindset remains one of the strongest foundations for navigating digital asset markets.
The goal should not simply be to trade more than everyone else. It should be to make better decisions, understand the risks, and improve through experience. In a market that never stands still, knowledge and discipline can help traders approach every opportunity with greater confidence and clarity.
Always verify the latest competition details through Gate's official channels before participating. Rewards, rankings, eligibility, and trading requirements depend on the published rules and applicable conditions.
#GateWCTCS9GlobalTradingCompetition
The global crypto market is entering another exciting chapter as traders continue searching for opportunities to demonstrate their skills, discipline, and market knowledge. Gate WCTC Season 9 Global Trading Competition brings the spotlight to competitive trading, where preparation, patience, and strategic thinking can make a meaningful difference.
For every trader, a competition is more than a race to generate profits. It is an opportunity to test a strategy, understand market behavior, manage risk, and learn how decisions perform under pressure. In a market where prices can change rapidly, the ability to remain disciplined can be just as important as identifying a promising trade.
WCTC Season 9 represents the competitive spirit of the cryptocurrency community. Traders from different backgrounds and regions share a common interest in digital assets, market movements, and the challenge of making informed decisions. A global trading competition creates an environment where participants can measure their performance while gaining a deeper understanding of their own trading habits.
Bitcoin and Ethereum remain important assets to watch as traders evaluate market momentum, liquidity, volatility, and changing investor sentiment. However, successful participation requires more than following popular coins or reacting to sudden price movements. Every decision should begin with a clear plan and an understanding of the risks involved.
One of the most valuable lessons in trading is that opportunity and risk always exist together. A strong market can encourage confidence, but excessive confidence can lead to poor decisions. A sudden reversal can challenge even experienced traders. That is why risk management, position sizing, and emotional control remain essential throughout a competitive trading environment.
Gate WCTC Season 9 also highlights how cryptocurrency trading has evolved into a global activity. Traders now have access to advanced market information, digital trading tools, and communities that discuss strategies across different time zones. Competitions can bring these participants together around a shared passion for understanding the markets and improving their performance.
For beginners, the most important goal should be learning rather than chasing a leaderboard. Studying price action, understanding order types, and recognizing the effects of volatility can build a stronger foundation for future decisions. New traders should avoid risking money they cannot afford to lose and should never assume that a competition guarantees profits or rewards.
Experienced traders can use a competition as an opportunity to evaluate consistency. One successful trade does not necessarily demonstrate a reliable strategy, just as one losing trade does not automatically mean a strategy has failed. What matters is the quality of the decision making process, the ability to control risk, and the willingness to learn from both positive and negative outcomes.
The psychology of trading deserves special attention. Fear can cause traders to exit too early, while greed can encourage them to hold a position beyond their original plan. The pressure of competition may intensify these emotions, making discipline even more important. A carefully planned approach helps traders avoid turning every market movement into an emotional decision.
Before participating in Gate WCTC Season 9, traders should review the official competition rules, eligibility requirements, registration process, competition period, ranking methodology, and any applicable reward conditions. Participants should also verify whether particular trading pairs or account types qualify. The official Gate announcement should be treated as the primary source for confirmed details.
It is equally important to remember that trading volume and profitability are not the same thing. Generating more volume does not automatically mean a trader is making better decisions. Excessive trading can increase fees and expose an account to unnecessary risk. A thoughtful strategy should focus on sustainable decision making instead of taking trades simply to remain active.
The real value of a trading competition lies in the combination of opportunity and experience. Participants can challenge themselves, review their performance, refine their strategies, and develop habits that remain useful beyond the competition itself. Every market cycle offers lessons, but those lessons become valuable only when traders take the time to understand them.
Gate WCTC Season 9 Global Trading Competition places the competitive side of cryptocurrency trading in focus. It reminds the community that trading involves preparation, adaptability, patience, and responsibility. Whether someone is an experienced market participant or a developing trader, a disciplined mindset remains one of the strongest foundations for navigating digital asset markets.
The goal should not simply be to trade more than everyone else. It should be to make better decisions, understand the risks, and improve through experience. In a market that never stands still, knowledge and discipline can help traders approach every opportunity with greater confidence and clarity.
Always verify the latest competition details through Gate's official channels before participating. Rewards, rankings, eligibility, and trading requirements depend on the published rules and applicable conditions.
#GateWCTCS9GlobalTradingCompetition