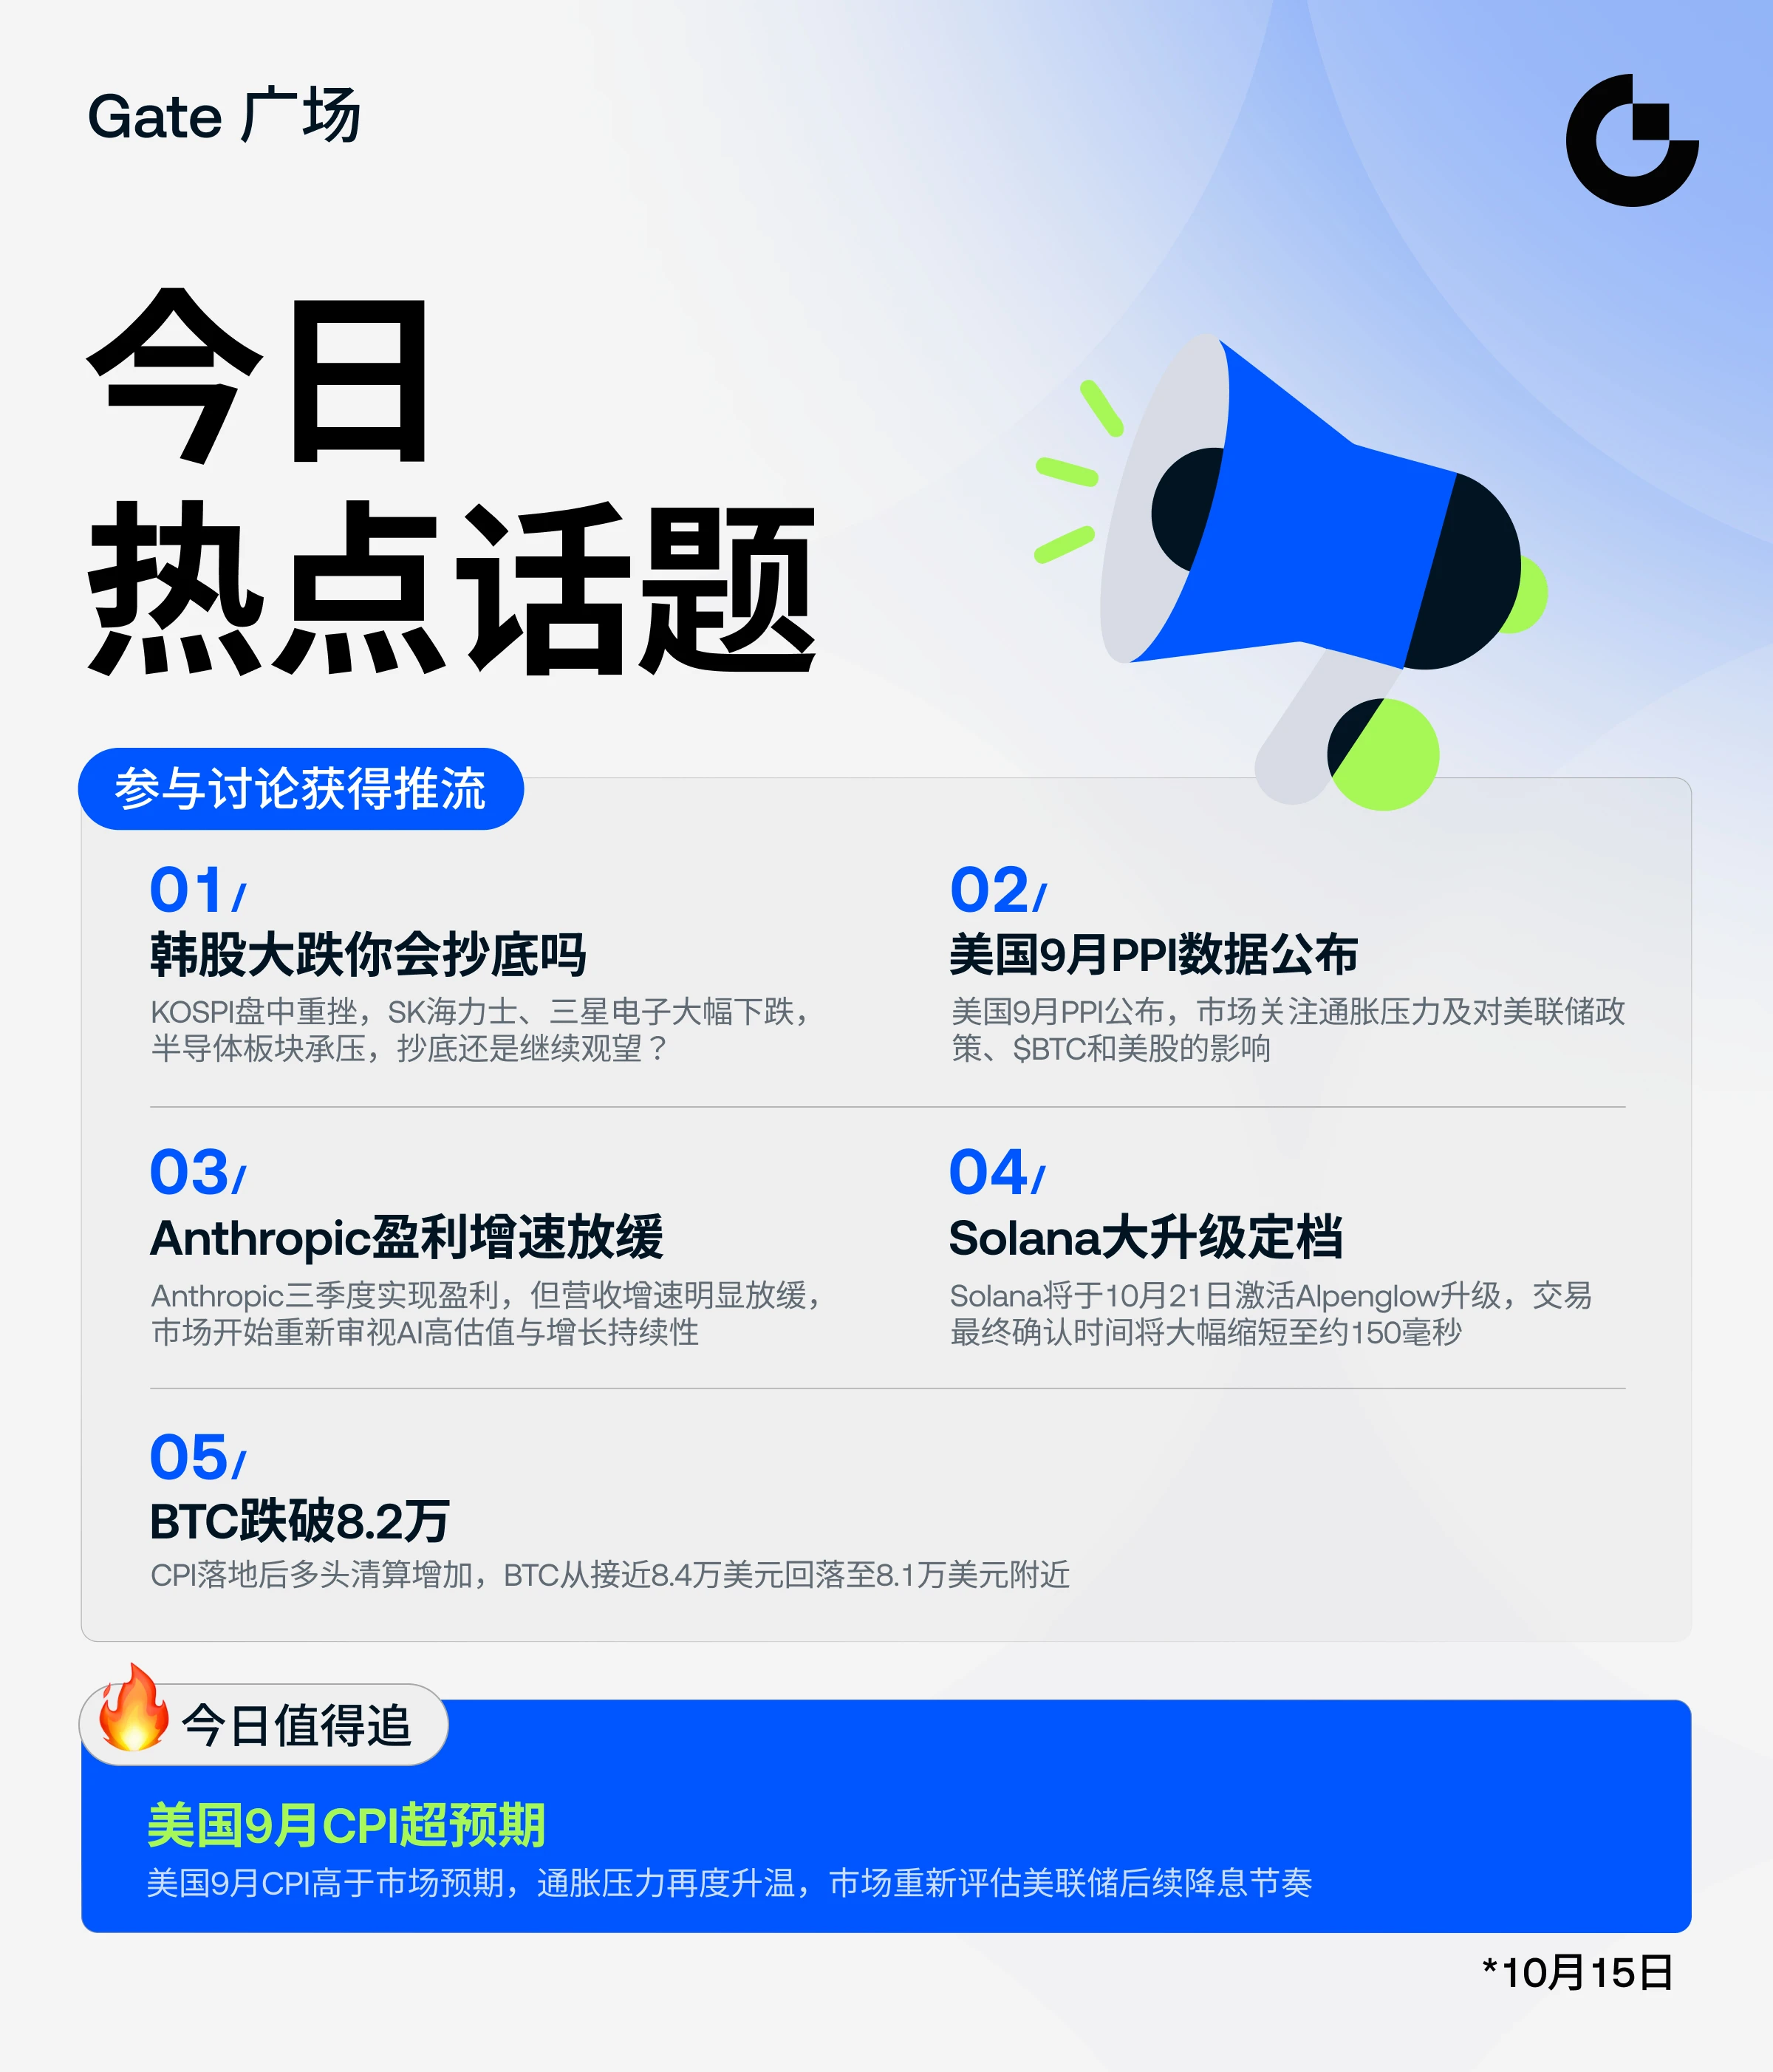
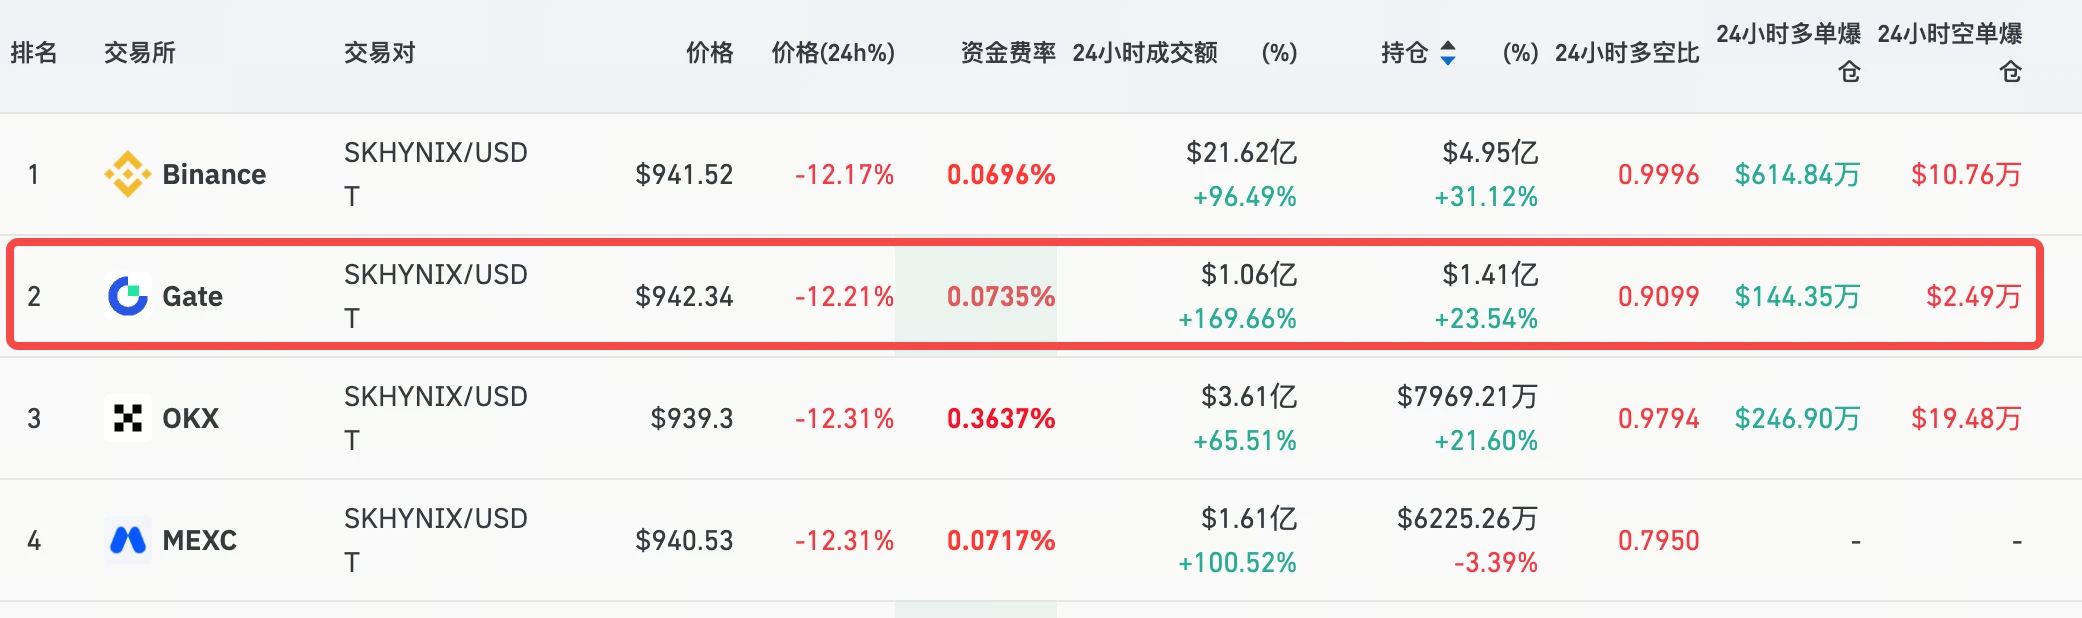
#韩股大跌你会抄底吗 #每周来晒 Korean Stocks Midday Review: Down 8.02%! Circuit Breaker Triggered as Hotter-than-Expected CPI Ignites Global Tech Stock Sell-Off, Semiconductor Sector Plunges Across the Board
The South Korean KOSPI index experienced an extremely brutal one-way decline today, opening sharply lower and then seeing continuous selling pressure. The index fluctuated downward throughout the session, with its maximum intraday decline approaching 8.10%. It fell as low as 5522.39 points and closed the morning session at 5527.12 points, down 481.69 points or 8.02%, as the market saw an extremely panicked wave of selling.
Core Market Data
The KOSPI opened at 5673.01 points today, reached a high of 5751.45 points and a low of 5522.39 points, with an amplitude of 3.81%.
The intraday trend clearly shows that the index saw virtually no meaningful rebound after opening. Bearish forces completely prevailed, share prices continued to move lower along the intraday average price line, and new intraday lows were repeatedly set, with market bulls almost giving up resistance.
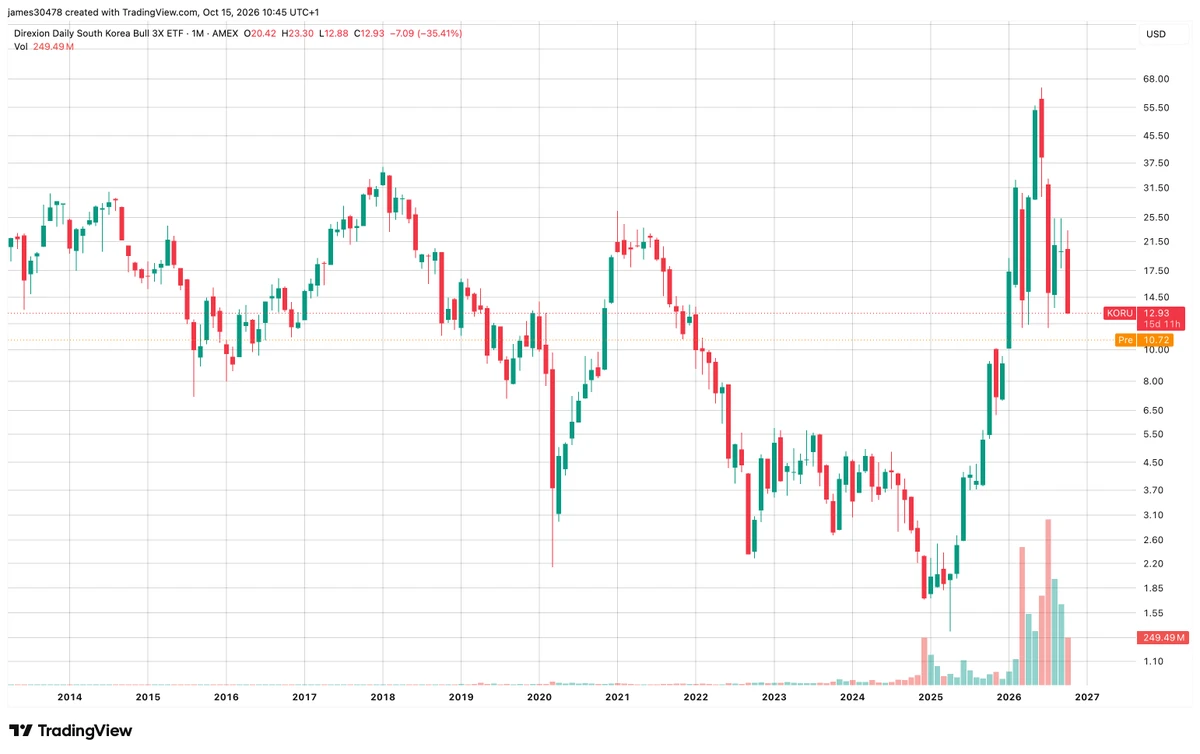
In terms of sectors, the semiconductor sector, a core pillar of the Korean stock market, became the hardest-hit area. The Chinese and South Korean semiconductor ETFs both plunged 5.87%, clearly showing that global funds are fleeing the chip sector en masse.
The Korean stock market itself is a core global semiconductor hub, with Samsung Electronics, SK hynix and other memory chip leaders carrying extremely high weights. The sector-wide plunge in semiconductors directly drove the broader index into a rare and sharp correction.
Trigger for the Plunge: Hotter-than-Expected U.S. CPI
The most direct trigger for the synchronized plunge in Asia-Pacific stocks this round was the U.S. September CPI data released overnight. The data showed that U.S. September CPI rose 3.7% year on year, above the market expectation of 3.6%; core CPI rose 2.6% year on year, also above expectations of 2.5%, with the rebound in inflation exceeding market forecasts. After the data was released, the market immediately repriced the Federal Reserve's monetary policy. Expectations that the Fed would maintain high interest rates or even raise rates again quickly intensified, sending U.S. Treasury yields and the U.S. dollar index higher. High-valuation technology growth stocks are extremely sensitive to interest-rate changes. Once the market expects rates to be difficult to lower, or even possibly rise further, funds will choose to realize gains on technology stock valuations en masse. This triggered the current wave of global tech stock selling.
Why Did Korean Stocks Fall So Sharply?
First, the market structure is highly dependent on semiconductors, amplifying volatility. The South Korean KOSPI is one of the major global indexes with the highest semiconductor weighting. Chip giants such as Samsung Electronics and SK hynix account for extremely large proportions of the index. Once global funds begin selling tech hardware, the Korean market's sensitivity is amplified, and its decline becomes significantly greater than that of other markets. Foreign investors account for a high proportion of the Korean stock market, and once they begin withdrawing in large numbers, a stampede-like decline can easily follow. Second, global AI chip valuations are undergoing a concentrated correction. AI and memory chips had previously experienced a major rally, leaving the sector with substantial gains and an inherent need for profit-taking. The CPI negative catalyst provided funds with an opportunity to exit, prompting them to question whether the earnings and valuations of high-valuation chip stocks are justified in a high-interest-rate environment and triggering a chain reaction of selling.
Third, leveraged trading has intensified intraday volatility. Retail participation in the Korean market is high, and many investors use margin leverage and ETF derivatives. When the index falls rapidly, a large number of stop-loss orders are triggered, further pushing the index lower and creating a negative feedback loop of selling into declines, ultimately producing today's extreme one-way drop.
Outlook
In the short term, market sentiment has entered a state of extreme panic. After the intense sell-off during the first half of the day, bearish forces have been released in concentrated fashion in the near term, so a brief technical rebound in the afternoon cannot be ruled out. However, until expectations of Fed rate hikes cool significantly, the pressure on global technology growth stocks is unlikely to disappear immediately. The market will continue waiting for more U.S. data to confirm the inflation trend.
For global equity markets, the most important variable going forward remains expectations for Fed policy. If subsequent inflation data continues to exceed expectations, the correction cycle in the technology sector could be extended further; if inflation declines, market panic may gradually subside.
$META