Share your thoughts
placeholder
Article
Juts chilling stacking my BTC $pleb
post-image
BTC+0.61%
$STONK is all fake data! They do not even bother pretending—bots place orders on both sides.
post-image
STONK+26.46%
#pi Latest news: Ahead of the full Senate vote next week, a revised CLARITY Act has been released, containing new requirements for DeFi (decentralized finance) and amendments addressing issues related to credit unions.
This is extremely favorable for Pi.
Failure to pass it would be a nightmare.
If it passes, fortunes will turn.
The more expectations, the greater the disappointment.
Wishing you good luck today; I’m going to work too.
PI-1.07%
solana:JUPyiwrYJFskUPiHa7hkeR8VUtAeFoSYbKedZNsDvCN
Will have this open while go to sleep
GN
post-image
SOL+2.84%
Crypto Market update
live-cover
LIVE575
#OracleQ1EarningsBeatStockUpOver5% Oracle Q1 Earnings Beat: Stock Surges Over 5% as Cloud and AI Momentum Accelerates
Oracle has once again proven that it is not just a legacy database company. The enterprise software giant reported first-quarter earnings that beat Wall Street expectations, sending its stock up more than 5% in the aftermath. The results were driven by strong demand for cloud infrastructure, accelerating AI workloads, and a resilient software business. For investors, the report was a clear signal that Oracle's multi-year transition to the cloud is not only working—it is gaining
post-image
This isn’t a rebound—it’s a feeding tube inserted into an account that was about to snap.

I opened the charts this morning: $SOL pulled back and held, while funds quietly entered the market. I judged this move wasn’t going to be a one-day wonder. I only gave one reminder at the time: you can follow with a long position, but protection is a must.

From 75.33 to 102.09, floating profit +3305.76%. Nailed it. It was truly sluggish at first, but the outcome was truly sweet.

Bank the bulk of it first, take 80% profit, and protect the remaining 20% at the entry price. The prerequisite for compo
post-image
SOL+2.81%
XRP+1.25%
LAB+69.60%
This trend is so obvious I don’t even need to think—the account is dancing on its own🕺.
A few nights ago, TRUMP was the last thing I checked before bed. The rebound was fierce enough, but volume failed to follow, and no one was taking it higher. I thought I might as well take advantage of this bull trap, so I shorted one position of $TRUMP at 2.369. When I checked the market again after lunch, the current price had already reached 1.984, with floating profit at +1156.13%—there’s your answer, guys👌.
Close 80% first and put the bulk of the profit in your pocket. Move the stop loss on the remai
post-image
TRUMP+0.71%
ZEC+5.67%
XRP+1.25%
#SenateReleasesNewCLARITYAct The U.S. Senate has released new legislative text for the CLARITY Act, bringing crypto market structure and regulatory clarity back into the spotlight.
This is an important development for the digital asset industry because the United States continues to work toward a clearer framework for how cryptocurrencies, digital asset platforms, market participants, and regulators should operate.
For years, one of the biggest challenges facing the crypto industry has been uncertainty around regulatory responsibilities. Different interpretations and overlapping authority can
BTC+0.61%
ETH+2.44%
Insiders are quietly leaning short on $CL /USDT right now.

$CL /USDT - SHORT

Trade Plan:
Entry: 95.99 – 96.39
SL: 98.07
TP1: 94.78
TP2: 93.84
TP3: 92.43

Why this setup?
Why now? The daily trend is a range, and the 1h ATR of 0.784189 shows enough volatility to justify a short entry at the 96.19 reference level. The 15m RSI at 42.91 confirms mild bearish momentum without being overextended, while the entry zone between 95.99 and 96.39 offers a tight, high-probability setup. Targets are stacked at 94.78 and 93.84, giving the trade room to breathe. The line in the sand is 94.65, where the en
CL-3.21%
[Price Trend Analysis]
1. Candlestick Patterns:
- On the 4-hour chart, the candlestick at 20:00 on September 11 was a small-bodied bullish candle, with the closing price near the high, indicating that upward momentum is continuing, although the gains have narrowed.
- On the 1-day chart, the candlestick for September 11 was a huge-volume bullish candle that almost entirely erased the losses from the previous few days, reaching a high of 2666, showing extremely optimistic market sentiment, while the long upper shadow also indicates resistance above.
2. Technical Indicators:
- MACD: On the 4-hour
BTC+0.61%
ETH+2.44%
  • 7
$ETH Signal】Go long + enter long on a pullback within the 4H bullish structure
$ETH Funding rate -0.0002%, 1H MACD histogram -5.0011 expanding downward, with price consolidating around 2515. 4H RSI 56.35, 4H MACD histogram 7.1391 showing contracting bullish momentum; 1H RSI 51.51, 1H EMA20 at 2516.5043 suppressing the current price. The order book buy/sell depth ratio is 0.76, with sell-side depth prevailing, while OI is stable. 4H EMA20 at 2487.9336 and EMA50 at 2479.9966 provide support below, while the 4H Bollinger upper band at 2545.1978 is the first resistance. Target 1 at 2553.5472 requ
ETH+2.44%
JUST IN: DeepSeek is testing a voice dialogue feature with four timbres, visible via a speaker button and a "Reading Voice Timbre" option in settings. This could lift user interaction with AI assistants in crypto tooling. $DEEP (ticker if relevant)
post-image
DEEPSEEK-0.49%
DEEP+2.96%
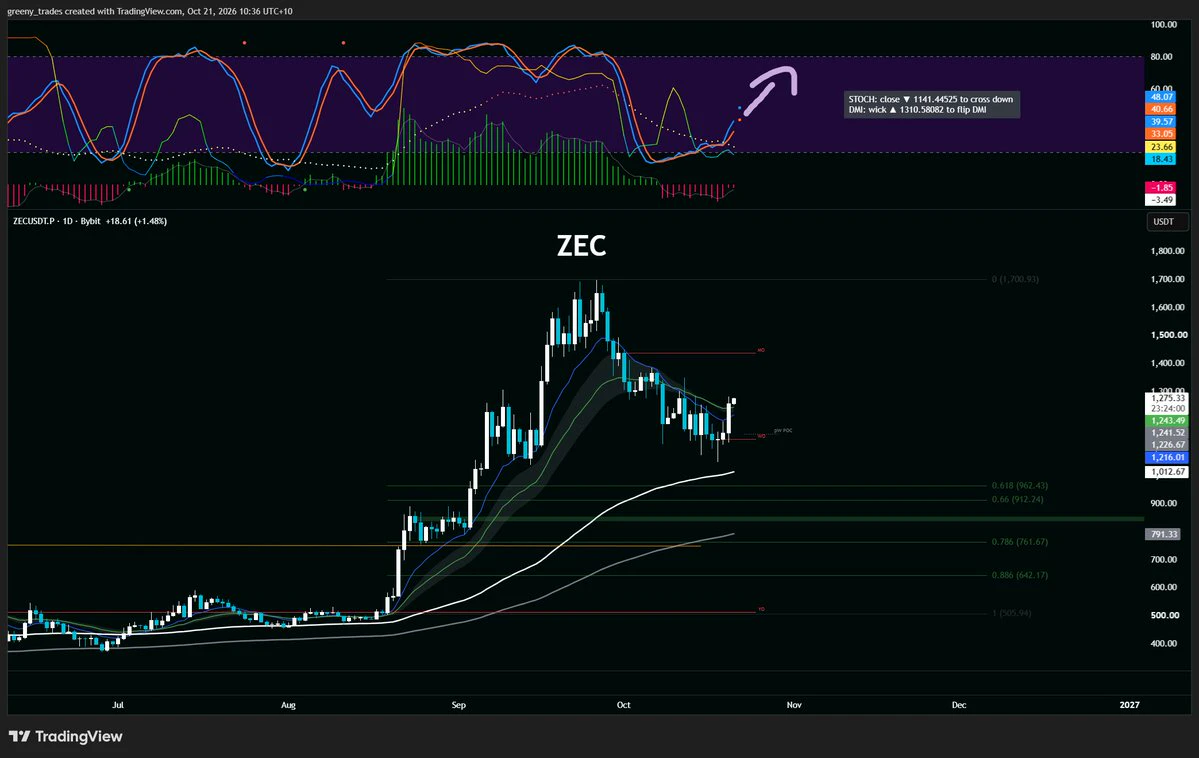
ZEC/USDT
ZEC is showing a strong recovery on the 15-minute chart after bouncing from the $1,054.57 low. Price is currently around $1,153, with a sharp bullish candle pushing above the short-term moving averages.
The key point here is the volume-backed breakout. MA5 is around $1,113.59, while MA10 and MA30 are near $1,105.63–$1,105.73, giving the current move a stronger bullish structure as long as ZEC holds above this zone.
Key levels I’m watching:
• Current price: $1,153
• Immediate resistance: $1,177–$1,183
• Major resistance / 24H high: $1,216.52
• Support: $1,113–$1,105
• Stronger support
post-image
ZEC+5.71%
A few days ago, I was still calculating whether I had enough money for instant noodles this month; this morning, I was already wondering whether to add a sausage. This $ERA short trade went from 0.06560 to 0.0588, yielding +254.56%. All I can say is, nailing the timing feels amazing.

A few days ago in the early morning, before the market had fully taken off, I noticed that every upward push was falling just short, with clearly insufficient buying support. While everyone else was waiting for a breakout, I saw that it simply could not break through and decisively called the short.

When the s
post-image
ERA+4.35%
SNDK-2.89%
LAB+69.60%
Most traders will miss $ETH /USDT's explosive move because they're watching the wrong signal

$ETH /USDT - LONG

Trade Plan:
Entry: 2503.86 – 2519.62
SL: 2436.13
TP1: 2568.45
TP2: 2606.25
TP3: 2662.96

Why this setup?
Why now? The daily trend is firmly bullish, giving us the macro tailwind that matters most. The 15m RSI sits at 36.22, meaning momentum has cooled enough to avoid chasing an overheated market. Meanwhile the 1h ATR of 31.50 tells us real volatility is alive, so position sizing around the entry zone near 2503.86 to 2519.62 becomes critical rather than optional. If price respects
ETH+2.44%
I was just about to go curse it out, but then I looked at the account and thought, forget it—let it pump however it wants, I’ll keep quiet. While everyone was still watching from the sidelines, $ETH ’s ETH bottomed out and moved sideways, with buying pressure strengthening. I said to wait for a pullback as long as the key level held. Opened a long at 1883.20, now at 2513.31, +5817.47%—those who got in should be grinning in their sleep. Nailed this move.

Panic comes from having no plan; losses come from overthinking. Hold as long as the trend remains intact, run when the level breaks, and don
post-image
ETH+2.44%
BNB+2.17%
SNDK-2.89%
JUST IN: Grok 4.7 launch delayed again as Musk cites over-penalized response length during training, leading to premature task completion and weak verification. xAI says root cause under review. $GROK
post-image
9. 9.12 Strategy: Mixed Signals, Longs and Shorts Blown Out, “Immortal Pointing the Way,” Grid-Buying at Lower Levels
Yesterday’s CPI data was “a mixed bag,” resulting in a sharp shakeout that blew out both longs and shorts. The market first plunged from 2460 to 2433, then climbed steadily to a new daily high of 2666, before falling wave by wave in the overnight session to 2504. The price range was enormous—truly remarkable. One thing is certain: both longs and shorts were blown out. Market price action will return to “logic.”
Big Wind believes that the market’s logic has now changed: if rates
ETH+2.44%
BTC+0.61%
  • 1
market prices updaes of $MEME COINS
live-cover
LIVE24
Load More

Join 40 M users in our growing community

⚡️ Join 40 M users in the crypto craze discussion

💬 Engage with your favorite top creators

👍 See what interests you

View More