Share your thoughts
placeholder
Article
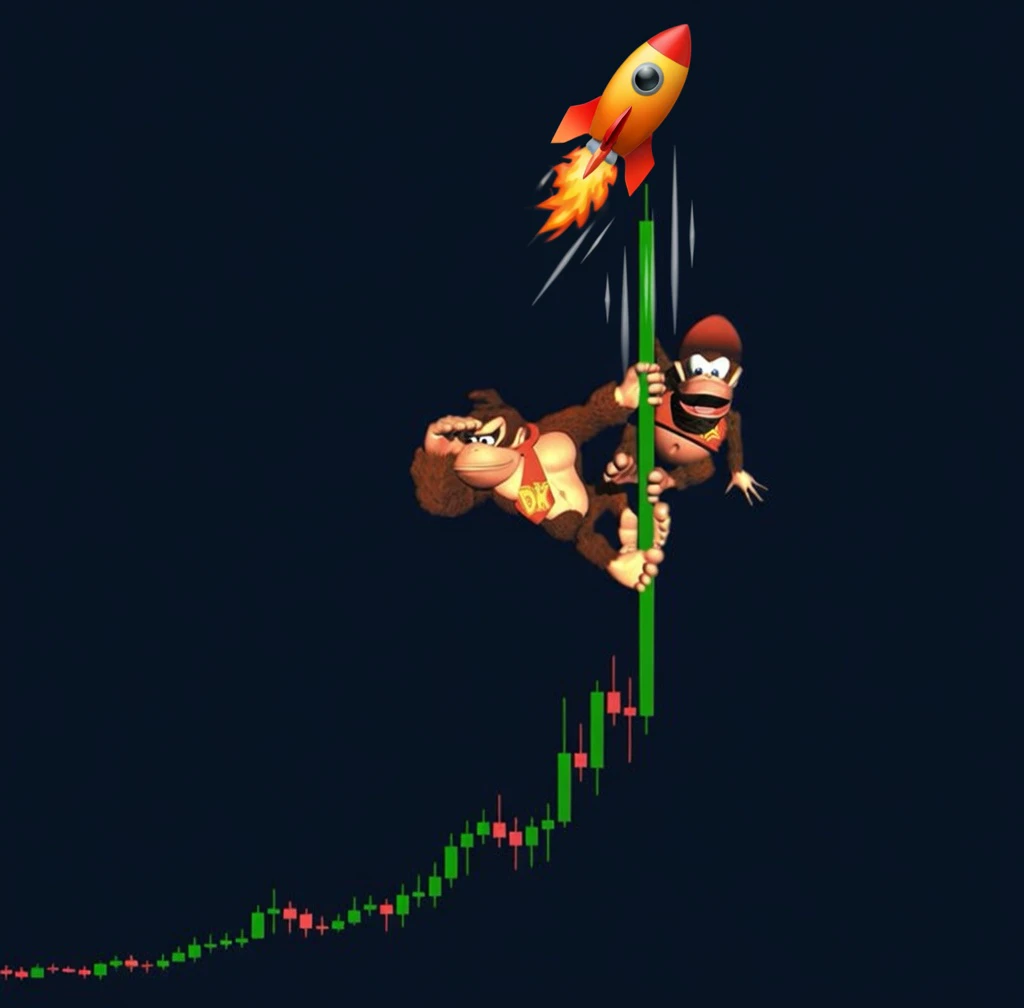
$DOT continues to display a powerful bullish structure with buyers firmly in control. Momentum is building, and the oracle narrative is beginning to heat up, creating an increasingly attractive environment for continuation.
This is one to keep firmly on the radar, with $API3 also worth watching as the broader narrative moves through the sector.
post-image
DOT+8.35%
API3+4.24%
Get ready for the ICE announcement..
LOCK IN 🫡
post-image
Will we see Bitcoin at $40,000 again?
post-image
BTC+1.05%
$ASTER remains strong after a powerful rally and recovery from the pullback. Holding $0.825 keeps the bullish setup alive.
📈 Direction: UP — LONG
🔥 EP: $0.825–$0.835
🎯 TP: $0.866 / $0.900 / $0.940
🛑 SL: $0.805
$ASTER — LET’S GO 🚀$AAPL $USDJPY
post-image
ASTER+13.29%
AAPL-2.51%
USDJPY+0.28%
Evening Market Updates
live-cover
LIVE1,992
Most traders will fade this NEAR pullback — that’s exactly why it works.

$NEAR /USDT - LONG

Trade Plan:
Entry: 2.1853 – 2.2115
SL: 2.0727
TP1: 2.2927
TP2: 2.3555
TP3: 2.4498

Why this setup?
- 1D trend is bullish; 4h setup is a high-probability LONG with 95% confidence.
- RSI on 15m is at 40 — room to run, not overbought.
- Entry zone 2.185–2.2115 sits right above a key level; stop at 2.0727 is tight vs. TP1 at 2.2927 (4.3% R:R on first target).
- Why now? Price is coiling below resistance while the daily trend pushes — this is the calm before the expansion.

Debate:
If NEAR breaks
NEAR+14.81%
I’m the universe’s unbeatable blockchain trading genius.
On day two, I have 8,000 U. Over the coming September and October, I’ll turn it into 500,000 U. I firmly believe it.
post-image
BTC+1.05%
GT+9.29%
ETH+0.69%
SOL+2.16%
XRP+1.89%
  • 3
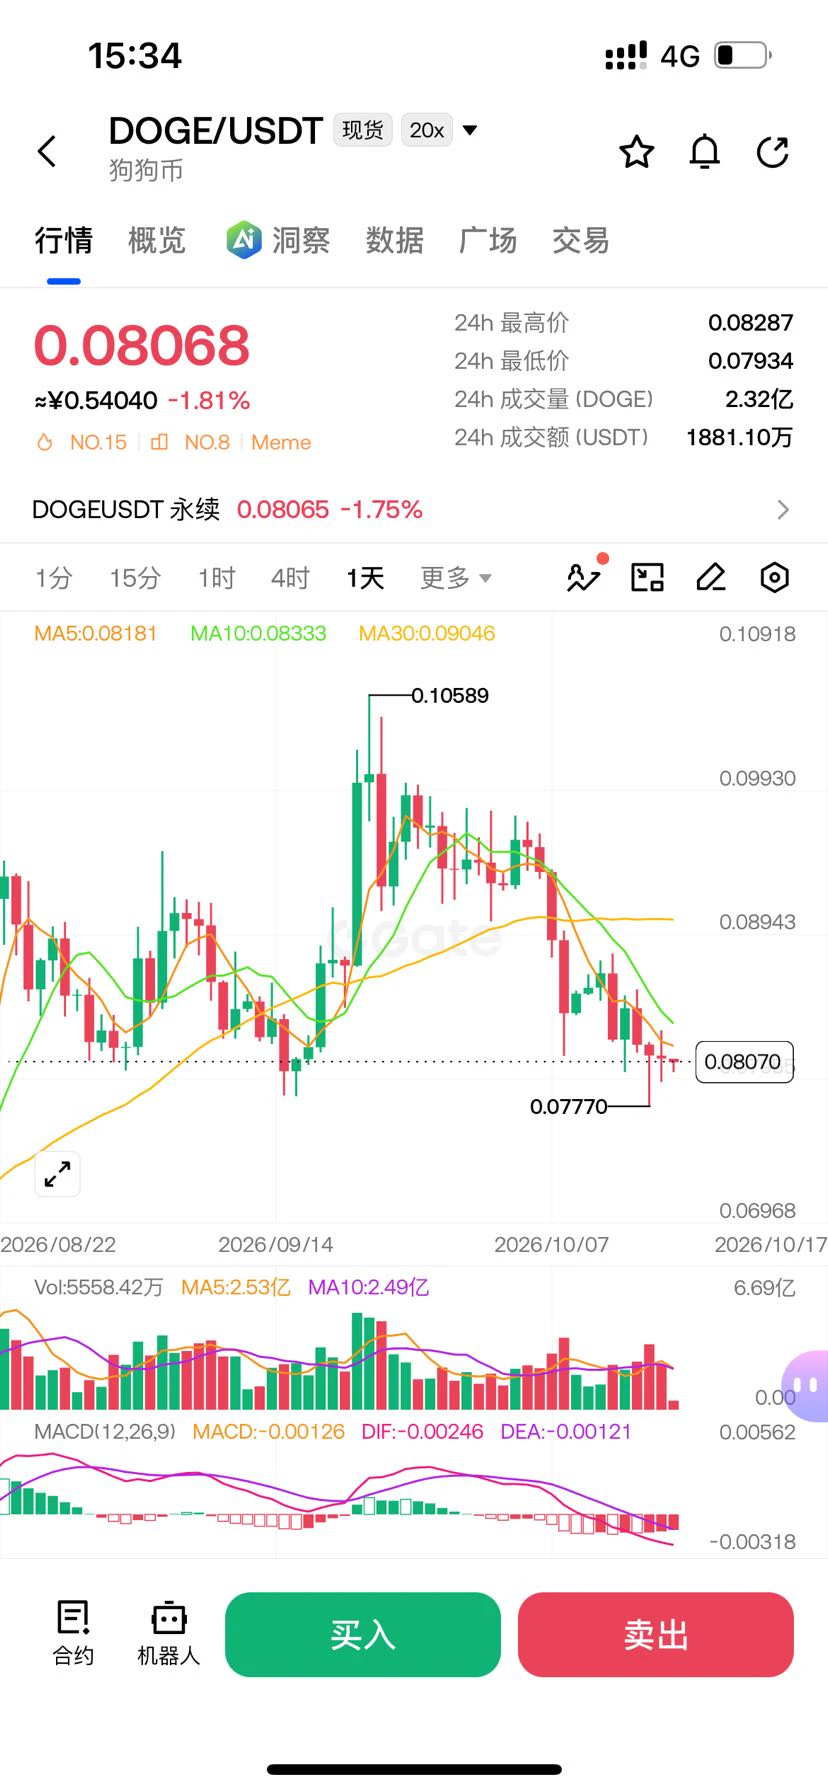
#交易機器人 I'm using Gate's DOGEUSDT futures grid bot—come copy-trade with me.
post-image
🚨 THE NEXT 100X IS LOADING… 👀
Early calls. Alpha. Insider plays. 🐋
Join the channel before everyone finds out. 🔥
👇
post-image
[New Streamer] Whales Move in SYnc!
live-cover
LIVE2,050
loracle.hl(@loraclexyz), who lost $70M on $HYPE , keeps adding to his $PONS short.
He is now short 17.79M $PONS($16.31M), with an unrealized loss of $6.57M.
HYPE+1.32%
PONS+26.76%
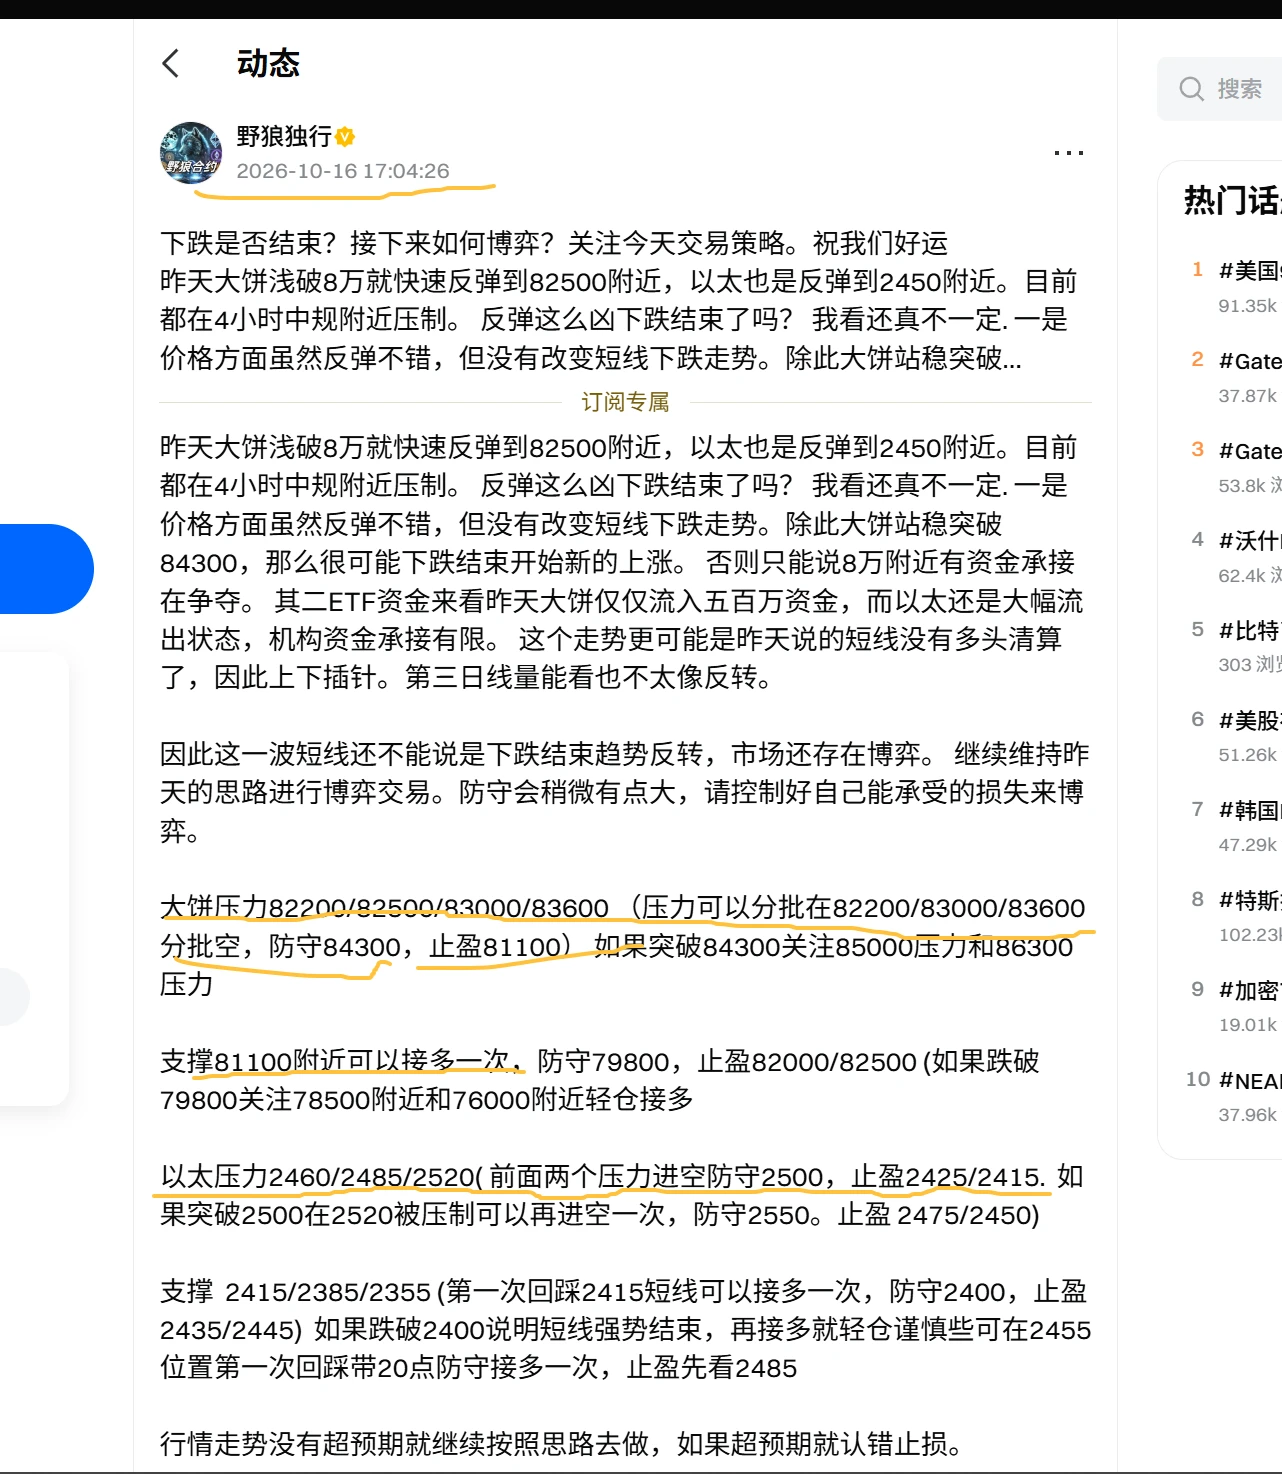
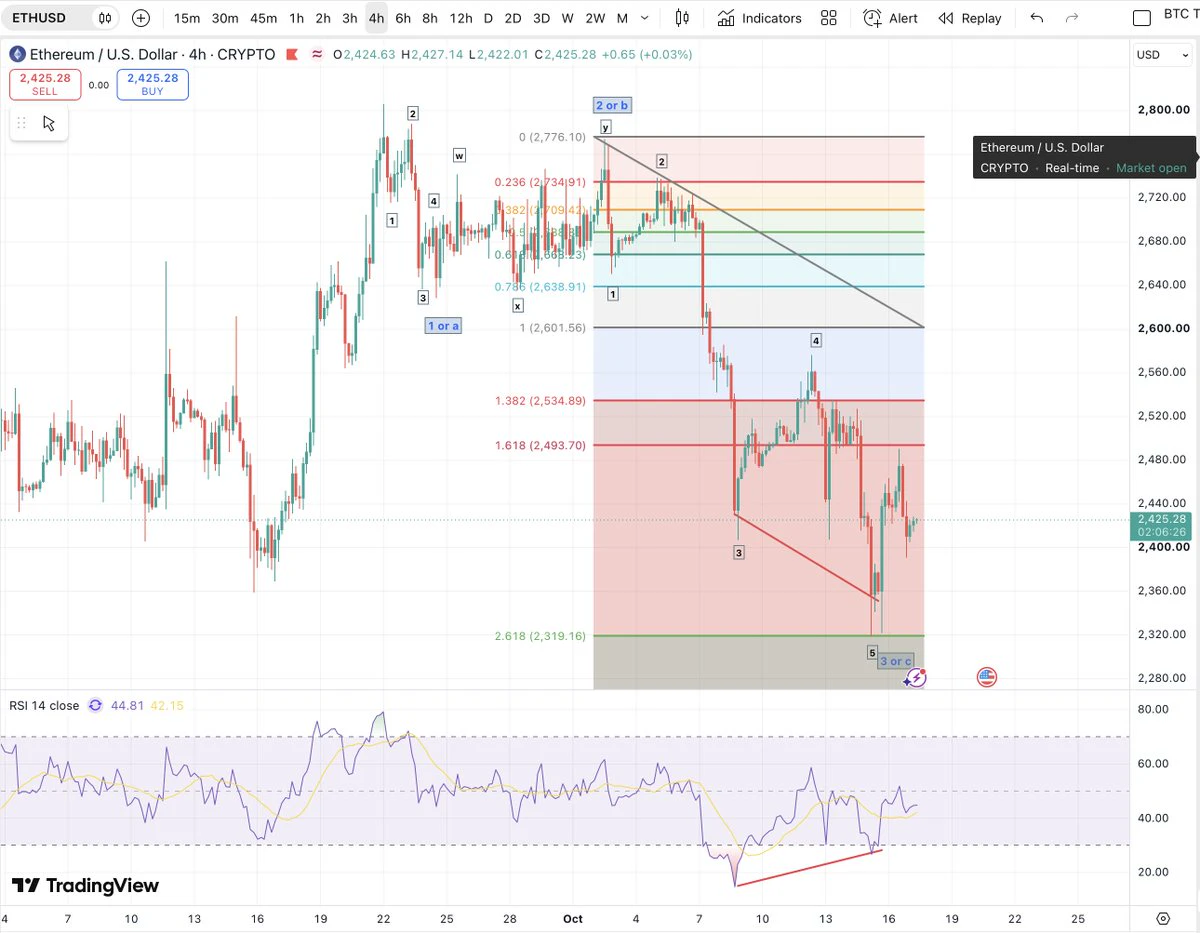
ETH pulled back after hitting $2,550 yesterday, and $2,550 remains a very clear short-term resistance level.
At the same time, August nonfarm payrolls were significantly stronger than expected, reinforcing the risk of a hawkish Fed, which is weighing on the short-term crypto market; however, ETH ETF fund flows are still maintaining relatively strong net inflows. Therefore, the market now looks more like “high-level consolidation + waiting for a directional choice” rather than a direct shift into a major bear market.
ETH’s latest short-term strategy
① First priority: Short the $2,500–2,550 zone
ETH+0.69%
BTC+1.05%
Everyone's staring at XLM's 4h chart, but the real signal is hiding in a range that's about to break.

$XLM /USDT - SHORT

Trade Plan:
Entry: 0.18328 – 0.18402
SL: 0.18719
TP1: 0.18100
TP2: 0.17923
TP3: 0.17657

Why this setup?
The 1D trend is *range*, not trend—so this isn't a momentum play. RSI 15m at 54.15 shows zero urgency, while ATR 1h (0.001474) is thin. Why now? Price is pinned at 0.18365, with a SHORT bias at 55% confidence. The invalidation line at 0.18175 is the trapdoor—if we lose that, the short thesis dies. But if we hold, TP1 (0.18100) is just 1.4% away, and TP3 (0.17657) off
XLM+3.33%
Tokenized stocks are a $2.3B market now. Ondo owns 34% of it.
The buyers are offshore, trading US equities at 3am with no broker and no market hours.
Wall Street kept the bell. Somebody else took the tape.
post-image
ONDO+4.91%
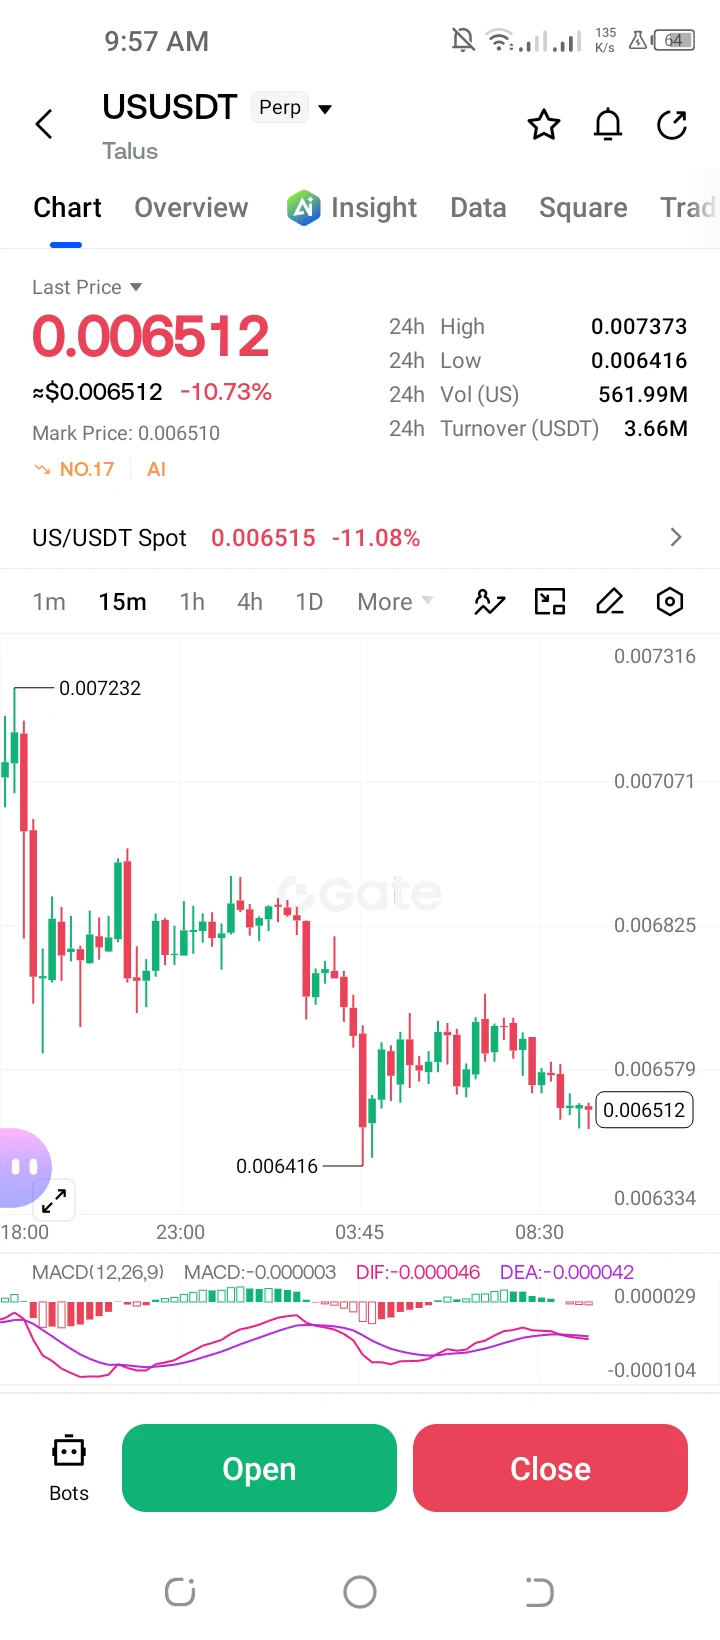
$FONE short closed by stop-loss tonight, but move doesn't look strong .
Structure slightly bullish now, but liquidity is still low and L/S ratio extremely bearish.
I believe it's just a slight pullback and another drop soon.
Building my short now around 0.0119
SL 0.0136
#FONE
post-image
FONE+22.55%
Wasn't I fucking subscribed to Premium+?
Why is it telling me I don't have it anymore, out of nowhere?
What does that mean?
post-image
By the first afternoon after GPT 6 Astra was released, I had already used up an entire week’s worth of usage—$200 worth of tokens a month really isn’t enough…
After using it for a few hours, my biggest takeaway is that now that Astra has powerful computer-control capabilities, everyone should stop whatever they’re doing and let AI directly step into their workflows to see what it can achieve.
Things that previous-generation AI models couldn’t do or couldn’t complete well, this generation’s Astra can handle with ease.
The time spent reshaping your workflow now will absolutely be worth it in the
post-image
Why is everyone staring at 0.7961 while the real SUI trade is hiding in plain sight?

$SUI /USDT - SHORT

Trade Plan:
Entry: 0.7936 – 0.7986
SL: 0.8201
TP1: 0.7781
TP2: 0.7662
TP3: 0.7482

Why this setup?
The 4h chart screams chop, but the math whispers opportunity.
- RSI 15m at 59.22 shows a dead-cat bounce losing steam.
- ATR 1h at 0.00998 means volatility is compressing—breakouts get violent.
- Entry zone 0.7936–0.7986 is a magnet; TP1 at 0.7781 is only 2.2% away, but TP2 at 0.7662 offers 3.7% if the range cracks.
Why now? The range is aging, and the bias is short with 55% confid
SUI+7.62%
Why is everyone long SNDK while the 4H chart screams otherwise?

$SNDK /USDT - SHORT

Trade Plan:
Entry: 1757.09 – 1764.45
SL: 1806.64
TP1: 1726.37
TP2: 1703.43
TP3: 1669.02

Why this setup?
The 1D trend is range, not bull. My SHORT bias sits at 77.4% confidence. Price is hovering at 1760.77—just below a key rejection zone. RSI on the 15m is neutral at 50.36, giving room to drop. ATR (1H: 14.7) shows enough volatility for a quick 2% slide. Targets: TP1 1726, TP2 1703. Stop at 1806 keeps risk tight.

Debate:
Are you fading this 4H rejection or buying the dip to 1703?

⚠️ Personal market an
SNDK+4.86%
Load More

Join 40 M users in our growing community

⚡️ Join 40 M users in the crypto craze discussion

💬 Engage with your favorite top creators

👍 See what interests you

View More