


Share your thoughts
placeholder
Article
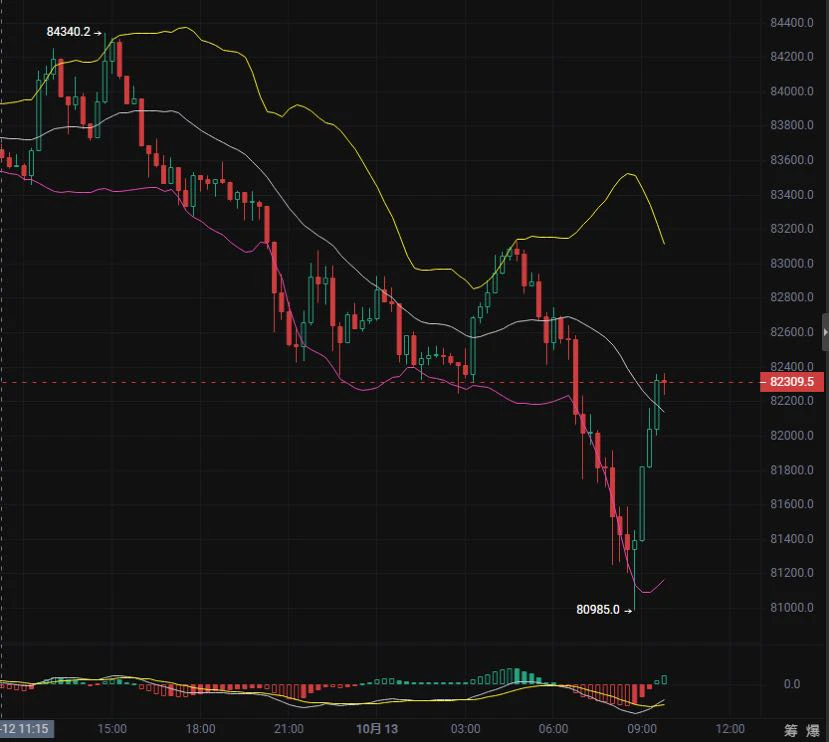
With the strength $BTC has been trading with lately, I don’t think it goes as low as we all conclude. Might not make it as low as 70k… honestly speaking 😆
post-image
BTC-1.32%
9.8 Gold Morning Strategy
On the hourly chart, gold prices are generally fluctuating at low levels after the decline, trading below the middle Bollinger Band under pressure. The upper Bollinger Band continues to exert downward pressure, and multiple rebounds have failed to break through effectively. Bears have the upper hand in the short term, while the pace of the decline has slowed somewhat. Do not blindly bottom-fish in the morning; focus on opportunities to short when rebounds encounter resistance.
Key Levels
Resistance: 4420, 4440
Support: 4405, 4385
Strategy:
Short on resistance in the 4
post-image
XAUT-0.44%
Still catching falling knives in the early hours? $ARB Did you miss out on this high-altitude profit opportunity again?
Signal: The market remained under pressure overnight, and the bearish trend is unchanged. Action: Open a 60x short in the direction of the trend, with current returns at 751%.
Don’t chase shorts as volatility intensifies at low levels. Take profits in batches to lock in gains, move the stop higher for the remaining position, secure profits, and wait for a rebound before deciding whether to stay in or exit. $AKE #BTC跌破8万美元
post-image
ARB-10.71%
AKE+21.03%
$XAUT /USDT is range bound, but something is about to break it lower.

$XAUT /USDT - SHORT

Trade Plan:
Entry: 4409.9 – 4414.5
SL: 4434.1
TP1: 4395.8
TP2: 4384.8
TP3: 4368.3

Why this setup?
Why now? The daily trend is range, which means the market is coiled and waiting for a directional catalyst. The 1h ATR of 9.135926 shows enough volatility to fuel a sharp move once price decides. The 15m RSI at 68.58 is not overbought enough to trap shorts, suggesting room for further downside. The entry zone sits at 4412.2, with TP1 at 4395.8 and TP2 at 4384.8, offering a clear risk to reward setup for
XAUT-0.45%
This short entry was not early, but it was fairly comfortable to hold. After the sideways consolidation broke down, I only looked for an entry during the pullback confirmation. I entered with a protective level in place, setting the stop-loss near the previous high rather than trying to catch the bottom.
As the move continued, the profit was once quite decent. A quick rebound midway caused the account to give back a small portion. I did not panic because scaling out at 0.014417/20 had already locked in most of the profit; for the remainder, I simply gave it room as long as the protective level
post-image
XRP-2.11%
BNB-1.77%
Stockmemecoin => Gold
I occasionally take profits. Whatever I withdraw is profit. I've made good gains in recent weeks.
post-image
[New Streamer] Market Prediction
live-cover
LIVE71
#HyperliquidTeamWithdraws38.14MInHYPE Hyperliquid Team Withdraws $38.1M — Details
The reported $38.1 million withdrawal linked to the Hyperliquid team has drawn attention across the crypto market because large on-chain movements can influence investor sentiment and short-term trading behavior. Hyperliquid is a major decentralized derivatives platform, and transactions involving wallets associated with its ecosystem are closely monitored by traders.
A withdrawal of this size does not automatically mean the team is selling HYPE tokens. Funds can be moved for treasury management, operational expe
HYPE-2.67%
Insiders are fading the rally as SYMBOL stalls at a key level.

$ADA /USDT - SHORT

Trade Plan:
Entry: 0.220 – 0.222
SL: 0.229
TP1: 0.215
TP2: 0.212
TP3: 0.206

Why this setup?
Why now? The daily trend is range-bound, suggesting the market lacks directional conviction and favors short setups. The 1h ATR of 0.003136 indicates the average candle size, meaning any move beyond that is a genuine impulse. With the 15m RSI at 55.82, there is just enough bearish momentum to push price from the entry zone near 0.221 toward the first target at 0.215. The second target sits at 0.212, where the invalid
ADA-1.36%
Crypto Market and Trading Insights
live-cover
LIVE1,466
A pin-bar pullback was triggered in the morning. After that lower wick appeared, I noticed an opportunity to go long. The price then gradually stabilized, which served as a validation of my judgment. After entry, there was no particularly rapid trend; the price mainly moved upward in steps. This rhythm is actually more reliable than a sharp rally, because each upward move has key levels where positions change hands.

My buy order was completed within the long-entry range. Afterward, I observed that the positions in the market had not loosened significantly, so I was able to hold the trade wit
post-image
SOL-2.21%
ZEC-7.65%
Nobody is talking about this bullish setup yet.

$AKE /USDT - LONG

Trade Plan:
Entry: 0.01671 – 0.01733
SL: 0.01408
TP1: 0.01923
TP2: 0.02070
TP3: 0.02291

Why this setup?
Why now? The 1h price just touched the entry zone of 0.01702, which sits inside a confirmed daily bullish trend, setting the stage for a calculated long. The 15m RSI reading of 51.86 shows the asset is neither overbought nor oversold, meaning there is room to run before exhaustion. The 1h ATR of 0.001227 defines the volatility envelope, so the first target of 0.01923 represents a move of roughly one and a half ATRs, a re
AKE+21.03%
$GBPUSD
Daily x H4
Could be a good meal.
GBPUSD+0.33%
Missing the move and not chasing it is the point I most want to review today. The rapid early-session surge in $BTW was indeed tempting, but by then it had already moved away from a reasonable entry point, and chasing it could have left me in a passive position if a pullback occurred. The market ultimately maintained strong volatility, and I did not feel frustrated about missing it. This is the approach I have come to appreciate more recently.

There is an older position in my portfolio. I initially identified it as a breakout pattern, but there was no major movement after entry. After holdin
post-image
BTW+0.45%
DOGE-0.21%
ZEC-7.65%
This trend is so obvious I don’t even need to think—the account is partying on its own. While the screen was glowing green, $BTC was lying still around 77967.8. Others were cutting losses, but I saw a pullback holding firm, with funds stepping in every time it dipped. That signal is clear enough, right?
As expected, when I checked the charts after lunch, it shot straight up to 79196.9 in a single move. The +274.13% profit was safely tucked into my pocket—smooth and satisfying. This move was purely the market being in a good mood, casually scattering some gold coins that happened to land right
post-image
BTC-1.31%
SNDK-0.21%
LAB-2.71%
I had just switched the software to the background, and it shot right back up—is it playing hide-and-seek with me? I kept watching during the repeated intraday swings; it held sideways at the bottom without breaking down, and buying pressure clearly strengthened, so it directly signaled opening a long position. From 1586.74 to 1787.26, a +897.72% rate of return—there’s the answer, brothers. Take profit on 80% first, and move the stop-loss on the remaining 20% to the entry price for protection, letting the profits continue to run. The market is waited out, and profits are held onto. This is not
post-image
ZEC-7.65%
ADA-1.36%
Everyone watching BNB for a breakout, but the setup says short here.

$BNB /USDT - SHORT

Trade Plan:
Entry: 735.37 – 737.33
SL: 745.77
TP1: 729.28
TP2: 724.57
TP3: 717.51

Why this setup?
Why now? The daily trend is range bound, and the 1h price is sitting at 736.35, which is also the entry reference. The 15m RSI is at 32.64, showing the market is still leaning bearish enough for a short move. The 1h ATR of 3.926007 means a single hour can easily cover the distance to TP1 at 729.28. If the daily range holds, a sweep to TP2 at 724.57 is the logical target, but the invalidation level at 729.
BNB-1.77%
privacy gud
cat in the bag
post-image
This is crazy. How many more times can bears defend this level on $ETH ?
post-image
ETH-1.00%
This was purely the market being in a good mood and casually scattering a few gold coins, which happened to land right on my head.

Right after lunch, when I checked the chart, $SUI was still alarmingly red, but something felt off in the order book: the sell orders were getting thinner the more they were absorbed, while the buy orders were lined up neatly. Repeated choppiness is when it’s easiest to scare people out, but I refused to leave and went straight with a long idea, telling the brothers following along not to panic. The longer this kind of buildup lasts, the cleaner the move up will
post-image
SUI+0.82%
SNDK-0.21%
LAB-2.71%
Load More

Join 40 M users in our growing community

⚡️ Join 40 M users in the crypto craze discussion

💬 Engage with your favorite top creators

👍 See what interests you

View More