Share your thoughts
placeholder
Article
These gains have me feeling apprehensive and uneasy, worried that the market will come to its senses tomorrow and blacklist me.
A few days ago, before bed, I was still reviewing the chart. $ESPORTS was clearly losing momentum after rebounding to a high, with each volume bar getting shorter than the last. This kind of low-volume false breakout is a bull trap. I said then that it could be shorted, and placed the entry directly around 0.04289. The direction was established first; after that, I just let the market put on a show.
Looking at the chart now, the price has already slid to 0.01375, and
post-image
ESPORTS-6.63%
BNB+1.45%
ETH-0.08%
I originally wanted to cut my losses and offer them to the heavens, but the sacrifice never happened—the meat roasted itself. When I opened the chart this morning, $UNI opened lower as usual, with green all over the screen. Honestly, I wavered too. But looking closely, it had been moving sideways at the bottom for a long time without breaking down. Buying pressure was gradually strengthening, and funds were quietly entering. If you don't dare reach out at a time like this, what's the point of trading futures? So I went long at 5.766, starting with a small position. The price has now climbed to
post-image
UNI-2.87%
BNB+1.45%
ZEC-0.90%
Trapped in long positions? There is no need to repeatedly agonize between “cutting losses in pain” and “stubbornly averaging down.” The key to getting out of a losing position has never been to forcibly dilute costs through additional buying, but to restructure your trading rhythm and clarify your position logic. Master these three core ideas to quickly break through the predicament:

1. Recognize the reality and take back the initiative
Being trapped in a position does not mean the loss is final—it simply means your entry timing was off. First identify key support levels on the chart, then o
post-image
Insiders are quietly stacking shorts on SYMBOL while the range holds.

$BNB /USDT - SHORT

Trade Plan:
Entry: 748.7 – 751.5
SL: 763.5
TP1: 740.1
TP2: 733.4
TP3: 723.3

Why this setup?
Why now? The 1h price is pinned at 750.0 inside a tight 1h ATR of 5.58, which means a break from 751.5 will likely accelerate fast. The 15m RSI sits at 48.91, showing just enough bearish lean to confirm momentum is not flipping bullish. The daily trend is range, so this short is a fade against the upper edge of the range at 751.5, targeting TP1 at 740.1 and TP2 at 733.4. The invalidation level at 734.8 is the
BNB+1.45%
𝗘𝘁𝗵𝗲𝗿𝗲𝘂𝗺 𝗦𝗲𝘁𝘀 𝗗𝗲𝗰𝗲𝗺𝗯𝗲𝗿 𝟮𝟬𝟮𝟵 𝗤𝘂𝗮𝗻𝘁𝘂𝗺 𝗦𝗲𝗰𝘂𝗿𝗶𝘁𝘆 𝗗𝗲𝗮𝗱𝗹𝗶𝗻𝗲
LATEST: The Ethereum Foundation has reportedly set December 2029 as a target for making the Ethereum network quantum-resistant, while preparing for the possibility of cryptography-breaking quantum computers emerging as early as 2030.
The move highlights a long-term security challenge for blockchain networks. Quantum-resistant cryptography could become increasingly important as computing power advances.
For $ETH , this is less about an immediate market catalyst and more about protecting the netwo
post-image
ETH-0.08%
  • 9
  • 3
XRP is trapped in a range, but the 1h setup hints at a sharp move down.

$XRP /USDT - SHORT

Trade Plan:
Entry: 1.4173 – 1.4245
SL: 1.4555
TP1: 1.3949
TP2: 1.3776
TP3: 1.3516

Why this setup?
Why now? The 1h price sits at 1.4209, right inside a narrow entry zone between 1.4173 and 1.4245, which keeps risk tight. The 15m RSI reading of 53.61 shows no overbought exhaustion, so the short bias lacks a natural reversal trigger yet. The 1h ATR of 0.014428 quantifies the current volatility, meaning a break below 1.4124 would likely unleash a move toward the first target at 1.3949. If that 1.3949 l
XRP+1.43%

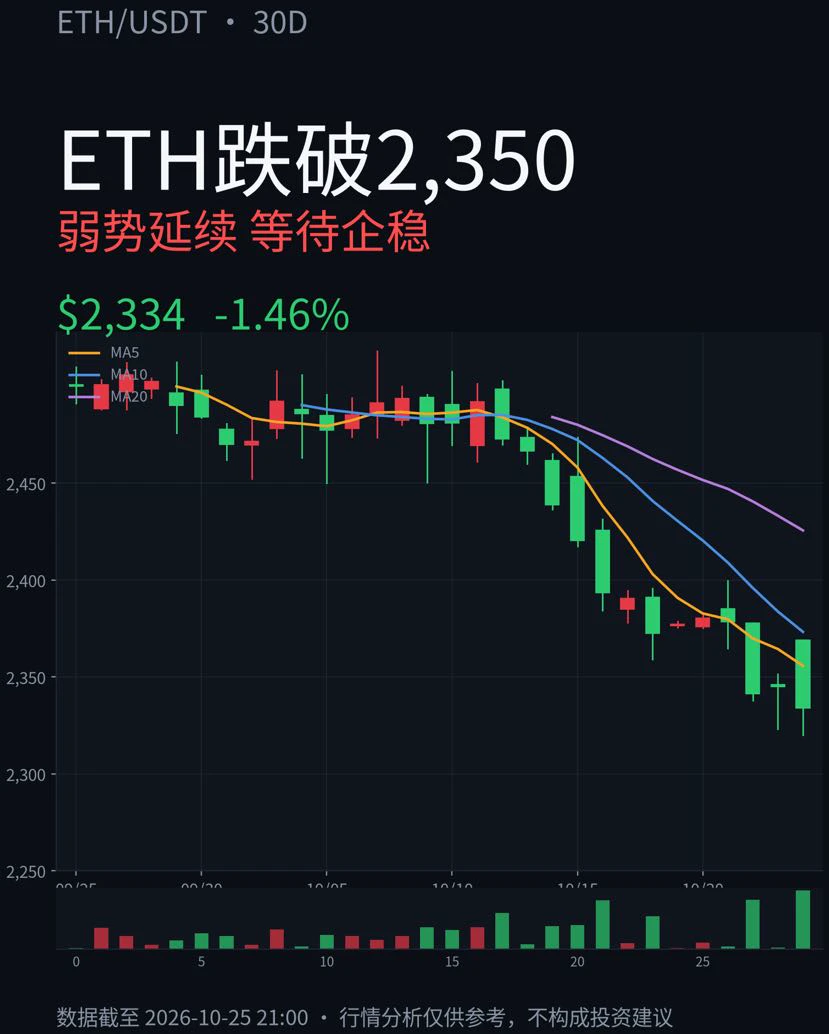
Guy's $ETH is holding around $2,485 after a period of sideways consolidation.
The structure is building pressure between $2,385 support and $2,565 resistance.
A clean break and close above $2,520–$2,565 could trigger the next leg toward $2,600+.
If ETH loses $2,430, the range could open toward $2,385.
For now, ETH looks like it’s preparing for a breakout.
BUY NOW 2,485
S.L :- 2,430
TP 1 :- 2,545
TP 2 :- 2,600
Full TP :- 2,650
Trade $ETH
post-image
ETH-0.08%
if only x would use zkpassport I would be incentivized to write more shitposts without doxing myself forever
post-image
Nobody is shorting SYMBOL right now, and the 1h ATR says that is a mistake.

$SLX /USDT - SHORT

Trade Plan:
Entry: 0.0685 – 0.0689
SL: 0.0708
TP1: 0.0671
TP2: 0.0660
TP3: 0.0644

Why this setup?
Why now? The 1h price is holding at 0.0687 inside a tight range, but the 15m RSI at 43.93 shows sellers are finally losing patience and a reversal is overdue. The 1h ATR of 0.000892 proves volatility is compressing, which means a explosive move is likely once the range breaks. The entry zone between 0.0685 and 0.0689 offers a precise setup to catch that move with a tight stop. The daily trend being
SLX-0.94%
This return makes me anxious, afraid the market will catch on tomorrow and blacklist me.
While everyone else was running, $TAC rebounded to the upper edge at 0.003206, but failed to break through after grinding against it for two candles. The resistance above was obvious. At a level like this, I would have been letting the chart down if I didn’t take a short. After opening the short, it even gave plenty of room to breathe. Sadly, it couldn’t be bothered to fake a bullish trap and drifted all the way down to 0.002048, delivering a direct return of +559.83%.
I’ve taken 80% off the table and move
post-image
TAC-13.98%
SNDK-2.39%
ZEC-0.90%
Why is everyone ignoring the bullish setup forming right under their nose?

$NEAR /USDT - LONG

Trade Plan:
Entry: 2.3333 – 2.3583
SL: 2.2258
TP1: 2.4358
TP2: 2.4958
TP3: 2.5858

Why this setup?
Why now? The daily trend is bullish, which sets the macro tone for a sustained move. The 1h ATR is 0.049998, showing enough momentum to drive the price toward the targets. The 15m RSI sits at 47.67, meaning there is room to run before hitting overbought territory. The entry zone around 2.3458 aligns with the 1h price, giving a precise trigger. The plan targets TP1 at 2.4358 and TP2 at 2.4958, with t
NEAR+0.39%
live trade on gate io join now 🙂
live-cover
LIVE338
If you’re not convinced, take the trade; once the setup is clear, go long directly at the current BTC price of 78300–78000, add at 77500, defend at 76800, with a short-term target of 79500 and a mid-term target of 80300–81300 if the breakout continues$BTC $ETH #Gate全球首发股票事件合约
post-image
BTC-0.86%
ETH-0.05%
  • 2
Lacking a big-picture perspective, unable to hold on—the profit on this move was as thin as paper, but I absolutely loved it.
A few days ago, it was the last thing I checked before bed: $AVAX was still grinding along the bottom, frustrating as hell, with several key resistance levels overhead. Anyone looking at it would have thought there was barely any upside. But after reviewing it repeatedly, it was clear that funds were quietly entering. You can’t fake a strengthening buy-side order flow.
So I placed a long position around 7.512, and when I checked today, it had already reached 7.995. Sett
post-image
AVAX-0.76%
ETH-0.08%
BNB+1.45%
Longing $FONE was a bad idea.
I expected it to bounce back at least a bit from 0.009-0.01 area but nope.
This thing got no bottom, futures are low liquidity with everyone shorting it. Main move happens on spot market where token being sold out 24/7.
Anyways, at least I woke up early and had time to buy short too so already recovered around $10k and it's still dropping.
#FONE
post-image
FONE-41.84%
Why does a 77% confidence SHORT signal look obvious only after the 1h price touched 1.241?

$DOT /USDT - SHORT

Trade Plan:
Entry: 1.233 – 1.249
SL: 1.341
TP1: 1.166
TP2: 1.116
TP3: 1.040

Why this setup?
Why now? The daily trend is range, so the market has been coiling and the 15m RSI reading 72.64 shows the recent push is nearing overbought exhaustion. The 1h ATR of 0.032159 tells us the hourly volatility is compressed enough that a break from the 1.241 entry zone could move fast toward the first target at 1.166. If that level holds, the second target sits at 1.116, with the third at 1.04
DOT+21.09%
Insiders are quietly fading the range on $CL /USDT right now.

$CL /USDT - SHORT

Trade Plan:
Entry: 92.26 – 92.62
SL: 94.13
TP1: 91.18
TP2: 90.33
TP3: 89.07

Why this setup?
Why now? The daily trend is range-bound, but the 1h ATR of 0.702406 shows enough volatility to justify a defined move. The 15m RSI at 59.35 is not overbought, which means momentum is still leaning bearish without exhaustion. The entry zone sits at 92.44, with the 1h price holding there as a reference point for the short bias. TP1 is 91.18 and TP2 is 90.33, targeting a measured decline from the range center. The invalid
CL+0.58%
Load More

Join 40 M users in our growing community

⚡️ Join 40 M users in the crypto craze discussion

💬 Engage with your favorite top creators

👍 See what interests you