Square
Following
Hot
News
Profile
Share your thoughts
placeholder
Article
$SIVE 🇸🇪
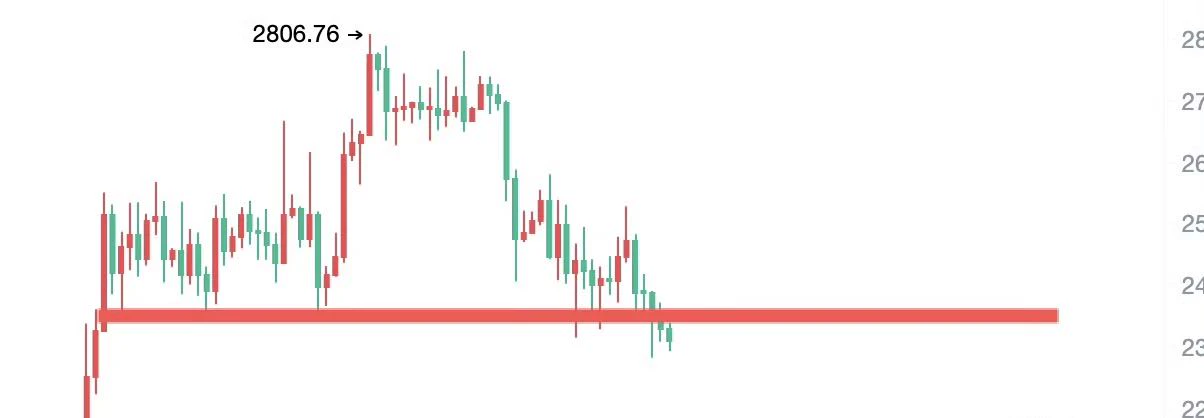
It’s breaching the neckline (red zone). It broke below the accumulation triangle, though the week hasn’t closed yet
post-image
$BNB BNBUSDT: +3.4% bounce off $709 — $735 resistance decides next
BNB was the outlier in today's ~$1B liquidation cascade — while ETH fell 5%+ and BTC broke $81K, BNB finished the day green (+0.5%), bouncing 3.4% off its $709 cascade low to $733, a hair under its $735.3 24h high. The tension: genuine relative strength, or just a slower bleed in a market still digesting hot US inflation data?
Trend per timeframe
- Daily: Slid from the $745–747 zone (Oct 14) to a $709 cascade wick (Oct 15 02:00 UTC), then ground back to $733.2 — still ~1.6% below where the selloff began. The recovery reads corr
post-image
BNB+0.33%
Who is truly leading the gains in the same sector? The answer points to $INJ
.
A horizontal comparison makes it clear: $INJ rose 10.92% over 24h, with a trading volume of 24.0M USDT, while $JTO fell 3.94% and $DOGE barely moved (-0.28%) over the same period. All three have an MA5 crossing above MA20, but only $INJ ’s RSI surged to 71.2, with the MACD histogram expanding significantly to +0.136. Its price of 8.379 is already approaching the Bollinger upper band at 8.618, and its 30-candle amplitude of 17.89% shows far greater volatility elasticity than the other two. The funding rate of +0.0
post-image
INJ+11.34%
JTO-2.75%
DOGE-0.24%
Continue adding to long positions on $DASH here. 💪Entry range: 49.57 - 49.82Target profit 1: 52.10Target profit 2: 54.02Invalidation level: 48.08DASH is showing strong recovery momentum and has reclaimed the 1-hour MA99 resistance at 50.01. The 15-minute chart remains clearly bullish above the MA7 and MA25, so the current setup favors an attempted breakout, targeting the 50.50 liquidity zone. Trade 👇👇👇 hereHot coins: $SIREN : Current price 0.03206 - 24-hour gain: +44.09%$SOL : Current price 105.91 - 24-hour gain: +1.07%
post-image
DASH+1.92%
SIREN+7.18%
SOL+1.25%
This woman is very wealthy, but she’s genuinely low-key.
$FET took me through a trade like this: the hardest part is knowing when to exit.
This feels like a good spot. Close the position right here. Watching these two today: $SO and $BAT .
post-image
FET+4.54%
BAT+28.99%
Bitcoin’s Long Term Cycle Chart Points to a Bigger Question: Are We in Another Accumulation Zone? 🙄
Bitcoin’s historical price cycles show a recurring pattern: major rallies, deep corrections, and long recovery periods.
The chart highlights previous peaks near $19,700 in 2017, $69,000 in 2021, and $126,000 in 2025, alongside earlier areas that some traders viewed as accumulation zones.
Now, the key question is whether the current price structure represents another opportunity to accumulate or whether the cycle is changing.
I think that the Historical patterns can offer useful context, but the
post-image
BTC+0.94%
Pepe have magikal skillz of riding things down to $0 & then back up again with gainz 🚀🌙
solana:EEpng77ZPn9FT4xsRjwuxNCcMBYq3HTwEscyTpump MFs get in 🚀🚀 we riding this to the moon 🌖
EEpng77ZPn9FT4xsRjwuxNCcMBYq3HTwEscyTpump
#crypto
post-image
PEPE+1.96%
SOL+1.25%
The answer is always hidden in the process that time brings. I’ve already made it extremely clear—the hints have been laid out plainly. Since June, it has felt exactly like hitting whatever I aim at and winning every battle; there’s only one word for it: “awesome”!
$BTC #美国9月CPI超预期
BTC+0.96%
How to Manage Your Positions After a Crash? Let Me Share My Hands-On Experience Using Gate
We’ve talked about a lot of analysis and judgments before, so in this final article, let’s discuss something practical—how to manage your positions on Gate after a crash?
Step one: First, assess your position exposure. If you hold spot or futures positions related to SK hynix, SanDisk, Samsung, and others, the first thing you need to do is understand the size of your risk exposure. On Gate, the open interest in SK hynix and SanDisk futures accounts for 15.8% and 18.15% of the entire market, respectively,
SK Hynix-11.06%
SKHY-0.14%
SKHYNIX-4.15%
SNDK+0.35%
SNDKG+0.35%
🇨🇳😎🚀🚀🚀🐳🐳🐳
Welcome to join the team. Team members can gain backdoor access to the subscriber livestream to copy trades—let’s make some serious profits!!!
#WCTCS9战队赛 , click the link to join my team and share the 3,200,000 USDT total prize pool with me. Fight for honor! https://www.gate.com/zh/competition/wctc-s9?page=teamCompetition&teamId=69556&ref_type=165&utm_cmp=tgv0wayw&ref=UQNBUFxZ
JUST IN: MSCI to remove Michael Saylor's Strategy $MSTR from its indexes.
MSCI+2.49%
MSTR+5.58%
$WULF had an intraday recovery of +20% which is pretty significant. It was down -65% from its high of $29 at some point today which still isn't as bad as the pullback in April 2025 where it saw -75% drawdown, but I'd say the sentiment in the space was just as bad
It almost seems irresponsible to show this chart. But it's currently forming a handle in this cup & handle pattern.
I don't make the fibs either, price currently found support around the 0.707 fib and if we get back above 0.786 and 0.887 fib then the upside targets could get wild. I don't see them happening anytime soon. For no I'd e
post-image
WULF+9.27%
UniCredit, the European bank with €932.091B in assets, is advising Hypercube on a European water credit sandbox for credits recorded on Algorand. Each credit is one verified cubic metre of water.
@Algorand
ALGO+1.77%
Gm everyone ☀️
post-image
CPI Comes in Hotter Than Expected
live-cover
LIVE89
$MARSCOIN is currently in a high-volatility, weak-trend phase. Conclusion first: short-term bias is bearish; chasing longs is not recommended. If it rebounds to around 0.0782, a small short position may be cautiously attempted, but a hard stop-loss must be used.
The reasoning is as follows. MARSCOIN is currently at 0.0772, down 5.04% over 24h, with the amplitude over 30 candles reaching as high as 15.93%. Its volatility is significantly higher than BTC's 3.44%, making it a typical high-risk asset. In terms of moving averages, MA5=0.07824 remains above MA20=0.07621, so the apparent bullish ali
post-image
MARSCOIN-6.36%
BAT+28.99%
BTC+0.94%
SK Hynix Plunges 11%, but Gate’s Open Interest Accounts for 15.8% of the Total Market, Ranking Second—What Are Traders Thinking?

SK Hynix closed down 11.06% yesterday, hitting a new low since April this year and retreating 57% from its June high. Interestingly, the more volatile the market, the higher the trading attention related assets are receiving.

According to Odaily, CoinGlass data shows that open interest in SK Hynix contracts on Gate reached 147,300, accounting for 15.8% of the market and ranking second across the entire market. What does this mean? It means that amid the sharp dec
SNDK-0.56%
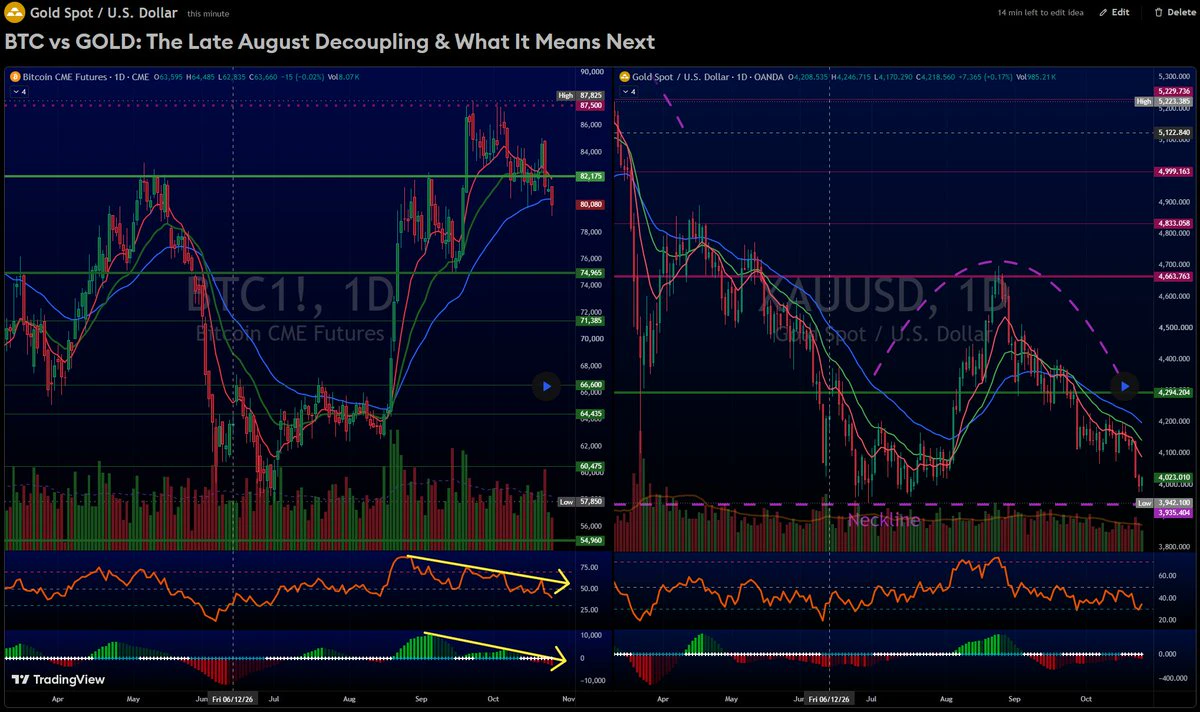
$XAU Initial indicators point to an upcoming rise in gold after the liquidity withdrawn yesterday entered, with a strong timeframe breakout above $4,180.
post-image
Load More

Join 40 M users in our growing community

⚡️ Join 40 M users in the crypto craze discussion

💬 Engage with your favorite top creators

👍 See what interests you

Trending Topics

USSeptemberPPIBeatsExpectations

91.35k Views1.88k Discussing

US September PPI came in at 6.3% YoY, well above the 5.3% market expectation, pointing to renewed producer-side inflation pressure. Weekly jobless claims were 199K, broadly in line with forecasts. Could hotter inflation further reduce room for rate cuts, and what does it mean for $BTC, US stocks, and gold?

DrLinHanSpeaksAtOxfordUnion

135.63k Views1.86k Discussing

JapanAndKoreaStocksPlunge

47.27k Views1.76k Discussing

View More