Square
Following
Hot
News
Profile
Share your thoughts
placeholder
Article
$USDJPY ‌
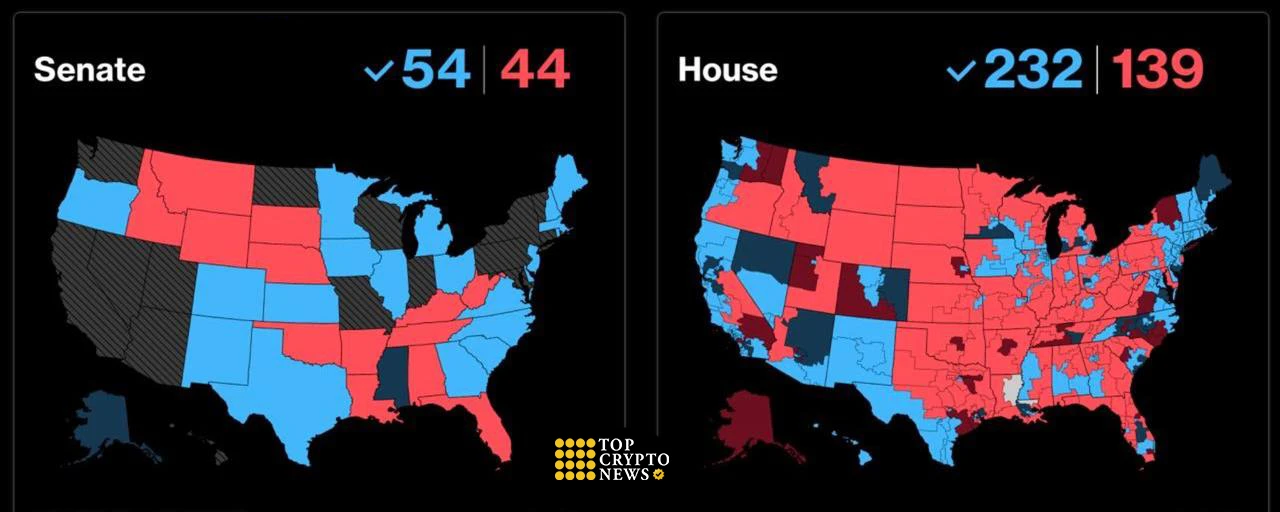
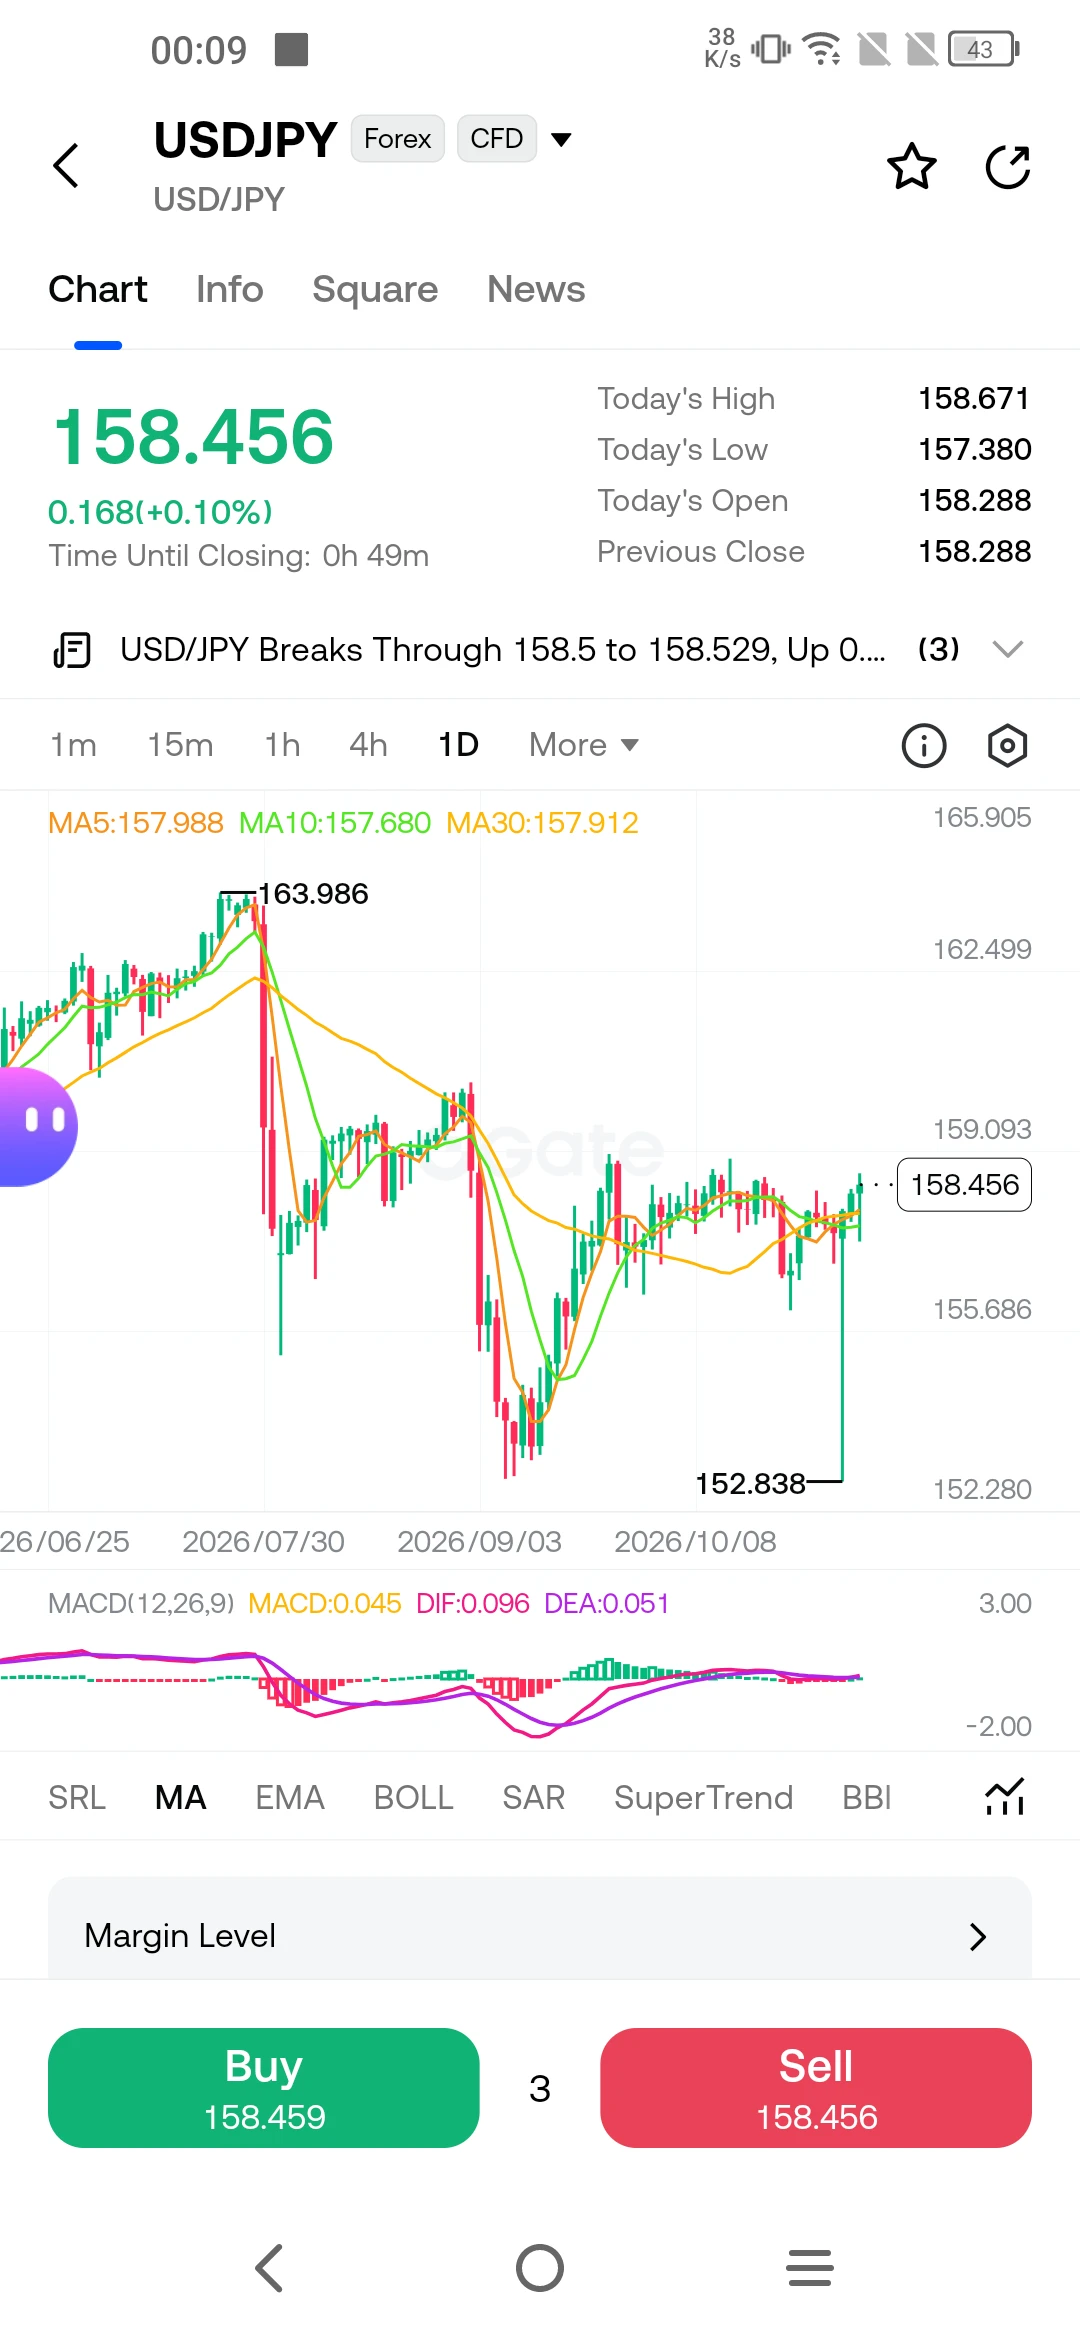
The decline of the dollar following the midterm elections in the United States was short-lived. As the Democrats secured majorities in both the House of Representatives and the Senate, the market initially priced in fiscal constraints and slower public spending; the dollar index fell by as much as 0.59% to 101.25, while the dollar slipped toward the 158 level against the yen. However, this movement did not prove lasting.
The focus quickly shifted back to the Federal Reserve’s policy path and the resilience of the U.S. economy. While political uncertainty caused short-term price vola
post-image
USDJPY-0.07%
  • 10
  • 2
Why are prices falling even as crude oil inventories have been shrinking for five weeks?
Official energy data released on November 4 showed that commercial crude oil inventories fell by 865,000 barrels for the week ending October 30, dropping to 409.8 million barrels—the fifth consecutive weekly decline. Analysts had expected a draw of 1.7 million barrels, so the actual figure was smaller than anticipated.
Typically, when supply tightens, prices find support. This time, the opposite occurred: while physical barrels dwindled, the price of "paper" (financial/futures) barrels fell.
Is the physica
User_any
$XBRUSD ‌
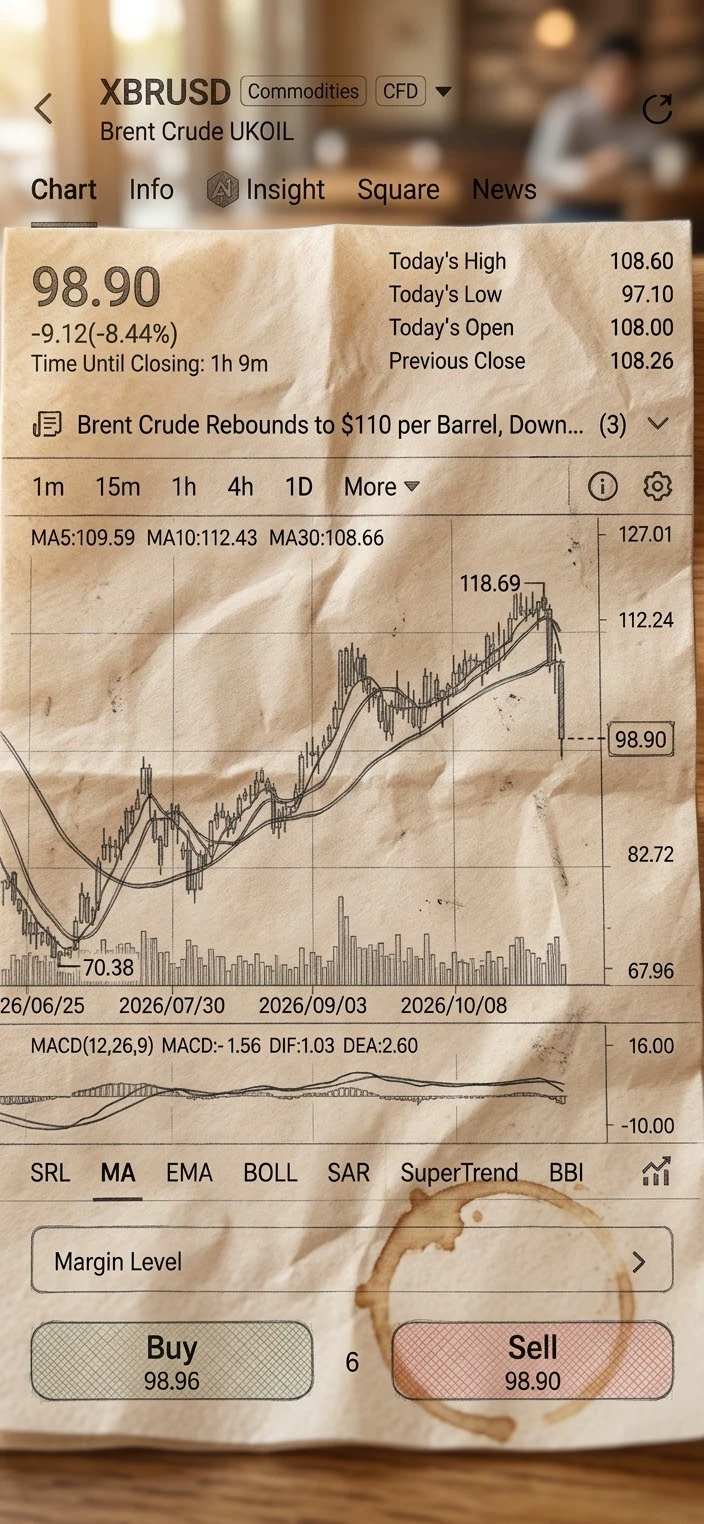
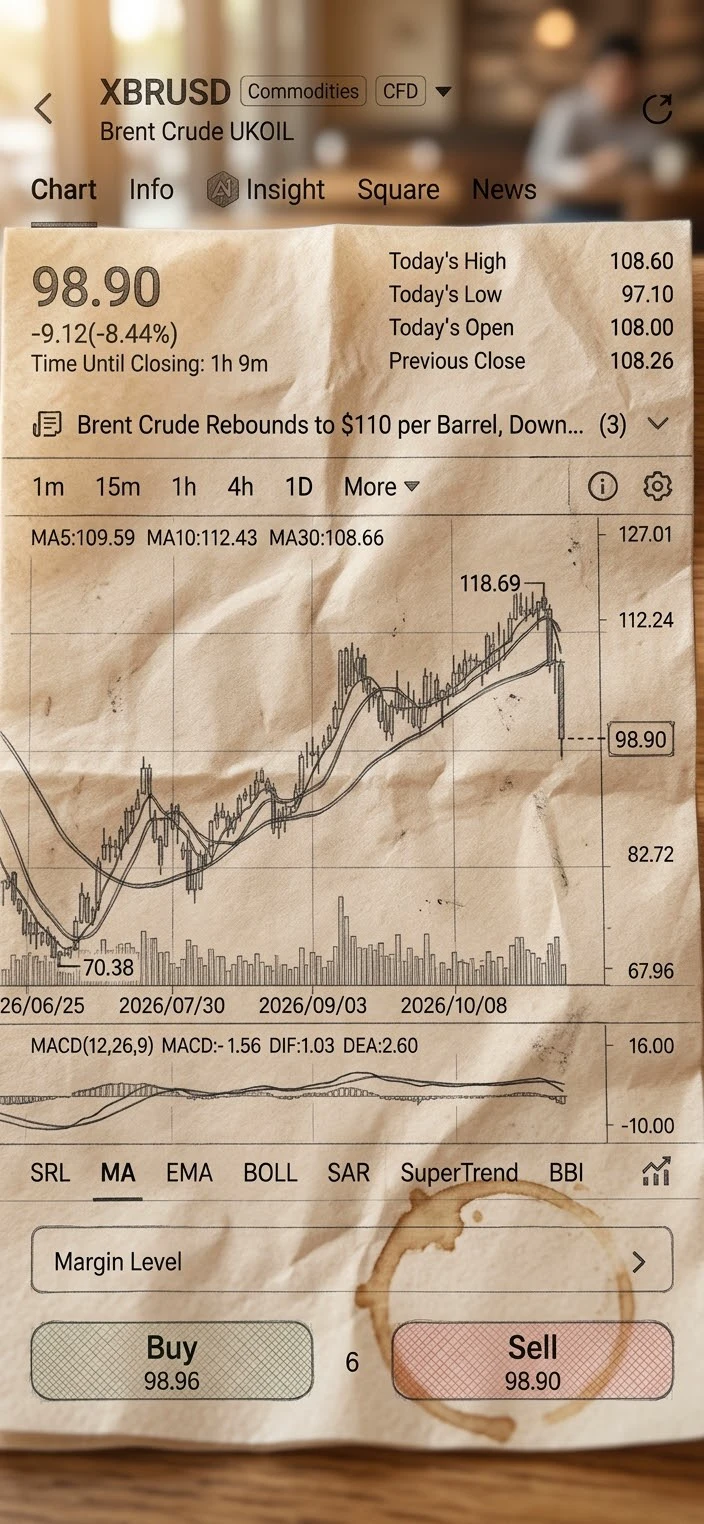
Why did Brent fall below $100?
Brent fell more than 4% in January contracts, dropping to around $98.76 on November 4th. This is the first time it has fallen below $100 since early October. The three-session decline indicates a rapid repricing of the geopolitical risk premium embedded in oil prices.
This isn't just a technical level; it's a combination of structural shifts in supply expectations and post-election market reassessment.
What's returning to normal on the supply side?
The US energy statistics agency forecasts that Middle East crude oil production will increase in the coming months as transit through the Strait of Hormuz recovers and alternative routes are utilized. Previously closed capacity is expected to be brought back online.
According to an independent energy study, flow through the Strait of Hormuz is currently around 12 million barrels per day, lower than the approximately 18 million barrels per day before the conflict. So there is a recovery, but it is fragile and partial; a full return to pre-war levels is not on the table.
Why is the pipeline story important?
In September, drone attacks on the East-West pipeline, which bypasses the Strait of Hormuz, temporarily halted a critical route. The pipeline was repaired and restarted on September 22, and shipments from Yanbu port soon resumed. This was one of the steps taken to alleviate the immediate supply constraint.
Alternative routes also came into play. Increased shipments via Fujairah and Oman partially compensated for the reduced flow through the strait. The logistics landscape is not fully back to normal, but the worst is behind us.
What has changed on the demand side?
The September short-term energy outlook revised the global liquid fuel consumption forecast downwards. The expectation for 2026 was lowered to 102.59 million barrels per day, approximately 1.69 million barrels below the 2025 level, and both OECD and non-OECD demand were revised more subdued.
In short, high prices and slowing growth are suppressing consumption. This is pulling the price anchor for crude oil down. Refinery operations, product consumption, and growth data from major economies will show whether this softening is permanent.
How should we interpret this decline?
Looking at it from a long-term and dialectical perspective, two forces are working together. On the one hand, the gradual restoration of physical supply routes, and on the other hand, the downward revision of global demand expectations. The risk premium, which increased with the pipeline attacks in September, has subsided along with the overall pullback in oil prices.
But the structural picture is still nuanced. Although the Strait of Hormuz has recovered from its September lows, it remains well below pre-war levels, and the recovery is described as fragile. The geopolitical background is not resolved, and if there is another disruption on the main routes, upward pressure on prices may return.
What should you watch?
There are two questions here. Will the speed of supply normalization or the trajectory of demand revisions be more decisive?
On the supply side, the daily level of the Strait of Hormuz flow, loadings at Yanbu and alternative ports, and the turnaround rate of closed capacity. On the demand side, global growth data, refinery utilization rates, and product consumption.
Below $100 is a threshold, but it's not the sole indicator. What will be lasting is the balance between how much logistics return to normal and how much demand slows down.
This content is for informational purposes only and is not investment advice.
#GateSquareTradingChallenge #WCTCS9 #ShareWeekly #𝐎𝐈𝐋
repost-content-media
XTIUSD-8.94%
XBRUSD-9.19%
  • 8
  • 2
Trenches
ZIG
Z
bade
b
ZIG
0x8c...1145
Market Cap
$.
Change
.
24h Vol
$.
Holders
.
BTC
B
bade
b
BTC
C5xp...pump
Market Cap
$.
Change
.
24h Vol
$.
Holders
.
AMD
A
bade
b
AMD
DDmG...pump
Market Cap
$.
Change
.
24h Vol
$.
Holders
.
STONK
S
bade
b
STONK
6GmA...UNgx
Market Cap
$.
Change
.
24h Vol
$.
Holders
.
HIGH
H
bade
b
HIGH
7ymF...high
Market Cap
$.
Change
.
24h Vol
$.
Holders
.
#GateLaunchesTaiwanStockTrading #ShareWeekly
Taiwan’s AI Supply Chain Is Opening New Opportunities: 19 Stocks Now Available on Gate
The artificial intelligence revolution is no longer limited to software companies, GPU designers, or major technology platforms. Behind every powerful AI model is an extensive industrial ecosystem involving semiconductor manufacturing, advanced packaging, high-performance servers, networking equipment, and specialized computing components.
This is exactly why Taiwan has become one of the most important markets to watch in the global technology industry.
Gate's la
  • 3
I use AI daily, but there are 5 things I never trust it with blindly.
1. Financial decisions: AI can offer insights, but my money choices are mine.
2. Private information: Convenience isn't a reason to share sensitive data.
3. Fact-checking: AI can be wrong, so verify important claims.
4. Personal relationships: AI doesn't know the whole story. I make my own decisions.
5. Medical advice: AI can explain, but serious health concerns need a qualified doctor.
Use AI as a tool, not as your final authority. Question the answers, verify the facts, and think for yourself.
post-image
XRP Technical Outlook: XRP Consolidates Near $1.30 as Bulls Attempt to Defend Support
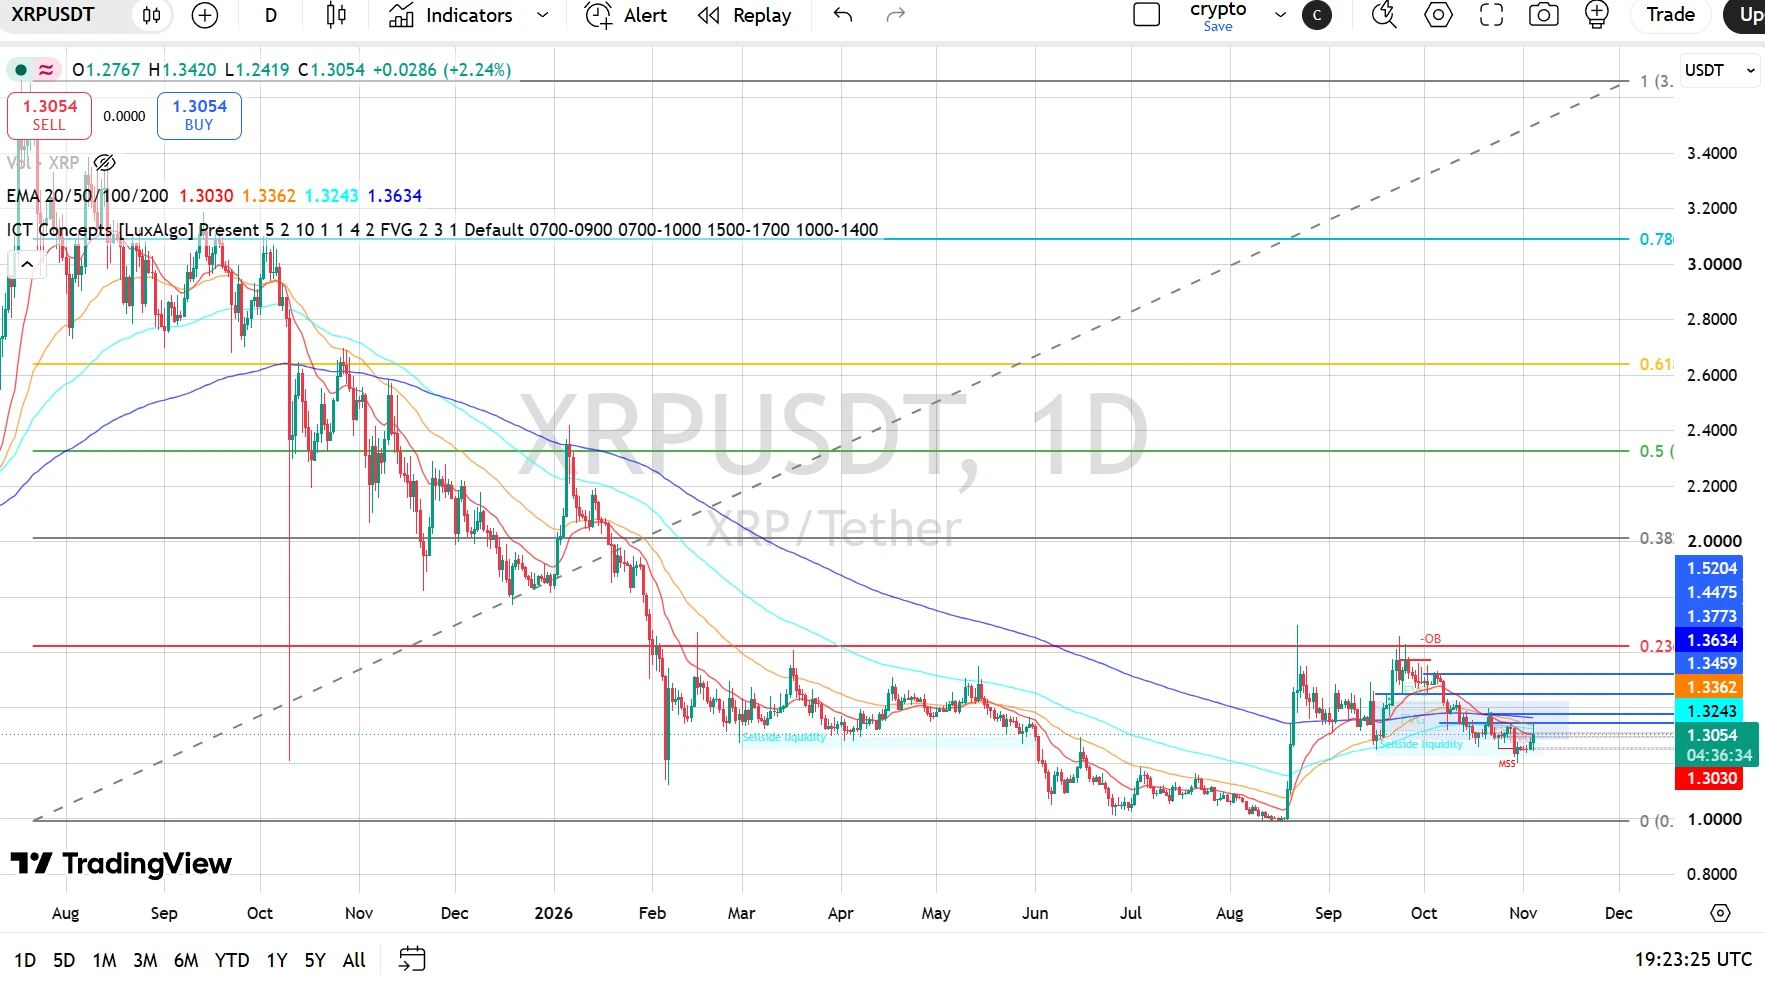
XRP is currently trading around $1.3049–$1.3051, consolidating after its recovery from the $1.00 region. The recent rally pushed price toward the $1.37 area, but XRP faced rejection and has since moved into a corrective phase.
The broader recovery has lost some momentum, with price trading below the 50, 100, and 200 EMAs. However, XRP is holding near the 20 EMA and attempting to stabilize around $1.30.
The immediate focus is whether buyers can defend the $1.30 area and reclaim the $1.3243–$1.3362 resistance z
post-image
asiftahsin
XRP Technical Outlook: XRP Consolidates Near $1.30 as Bulls Attempt to Defend Support
XRP is currently trading around $1.3049–$1.3051, consolidating after its recovery from the $1.00 region. The recent rally pushed price toward the $1.37 area, but XRP faced rejection and has since moved into a corrective phase.
The broader recovery has lost some momentum, with price trading below the 50, 100, and 200 EMAs. However, XRP is holding near the 20 EMA and attempting to stabilize around $1.30.
The immediate focus is whether buyers can defend the $1.30 area and reclaim the $1.3243–$1.3362 resistance zone. A sustained move above this zone would improve the recovery outlook, while a breakdown below support could expose XRP to further downside.
EMA Structure
* 20 EMA: $1.3030
* 50 EMA: $1.3362
* 100 EMA: $1.3243
* 200 EMA: $1.3634
XRP is trading slightly above the 20 EMA but remains below the 50, 100, and 200 EMAs. This indicates that short-term price action is attempting to stabilize, while the broader trend still faces significant overhead resistance.
The $1.3243–$1.3362 region is the first important resistance zone. Reclaiming the 50 EMA at $1.3362 would strengthen the short-term recovery, while the 200 EMA near $1.3634 remains a major barrier.
Fibonacci Levels
Based on the visible chart levels:
* 0.236: Around $1.3459
* 0.382: Around $2.00
* 0.5: Around $2.32
* 0.618: Around $2.64
* 0.786: Around $3.08
XRP is trading below the visible 0.236 Fibonacci resistance area. A sustained recovery above $1.3459 would be an early sign of improving momentum. The higher Fibonacci levels represent broader recovery objectives rather than immediate targets.
Bullish Scenario
If XRP holds the $1.30 support area and buyers manage to reclaim the nearby EMA resistance zone, the price could attempt a recovery toward:
* $1.3243
* $1.3362
* $1.3459
* $1.3634
* $1.3773
* $1.4475
* $1.5204
A decisive move above $1.3459 would improve the bullish outlook. Reclaiming $1.3634–$1.3773 could open the way toward the $1.4475 resistance area.
Pullback Scenario
If XRP fails to hold above $1.30 and selling pressure increases, the following support areas deserve attention:
* $1.3030 — 20 EMA
* $1.30 — Immediate psychological support
* $1.27–$1.25 — Potential lower support area
* $1.00 — Major historical support region
A sustained breakdown below $1.30 would weaken the current consolidation structure and increase the possibility of a deeper correction. The $1.00 region remains an important broader support reference on the chart.
RSI Momentum
* RSI: 47.82
* RSI Signal Average: 40.26
RSI is below the neutral 50 level, showing that bullish momentum remains limited. However, the RSI is above its signal average, suggesting a modest improvement in short-term momentum.
A move above 50–55 would provide stronger confirmation of a recovery attempt. If RSI turns lower and falls below 40, downside pressure could increase.
Market Structure & Liquidity
XRP has experienced a prolonged decline from its previous highs before finding support around the $1.00 region. The subsequent recovery pushed price toward the $1.37 area, but buyers have struggled to maintain that upward momentum.
The latest price action shows lower highs and consolidation around $1.30–$1.34. The market is currently testing whether the $1.30 region can hold as support.
The broader structure remains under pressure while XRP trades below the 50, 100, and 200 EMAs. A confirmed reclaim of the $1.3459–$1.3773 zone would be needed to establish a stronger bullish recovery.
Key Levels
Resistance
* $1.3243
* $1.3362
* $1.3459
* $1.3634
* $1.3773
* $1.4475
* $1.5204
Support
* $1.3030
* $1.30
* $1.27–$1.25
* $1.00
Final Outlook
XRP remains neutral-to-bearish while trading below the $1.3362–$1.3634 resistance zone. The price is attempting to stabilize around $1.30, but the broader recovery still needs confirmation.
A sustained breakout above $1.3459 could open the path toward $1.3773, followed by $1.4475. On the downside, losing $1.30 would increase the risk of a deeper correction.
Bias: Neutral-to-bearish below $1.3459 | Breakout above $1.3773 could strengthen recovery toward $1.4475–$1.5204.
Analysis based on the provided XRP/USDT 1D chart dated November 4, 2026. These levels represent technical scenarios, not guaranteed outcomes.
$XRP ‌
repost-content-media
XRP-1.12%
  • 10
  • 1
#BTCBreaksPastMidtermBearishPattern
Bitcoin Just Broke Its 12-Year Midterm Bearish Pattern: This Time Is Different
For 12 years, Bitcoin followed the same midterm script. Fall before the vote, crash in Q4, then rally a year later.
This time, Bitcoin broke the pattern.
Verified Historical Pattern:
Bitcoin fell in the fourth quarter of each of the last three U.S. midterm election years, yet traded higher one year after every vote, according to an analysis by Joe Consorti.
Bitcoin's fourth-quarter losses were 17.3% in 2014, 43.5% in 2018 and 14.8% in 2022.
Over the longer historical comparis
post-image
BTC-0.67%
  • 2
Come on, Como,
you're in someone's home, ooo....
post-image
Someone close to Jensen Huang is alleged to have ties to Chinese intelligence. U.S. intelligence reportedly briefed Trump about it a year ago, but nothing was done because Nvidia was too important. The absurdity is that the CEO of a chip company has become a buffer in geopolitical power plays. Maybe I’ve got it wrong. I’ll wait to be proven wrong.
post-image
NVDA-3.03%
  • 10
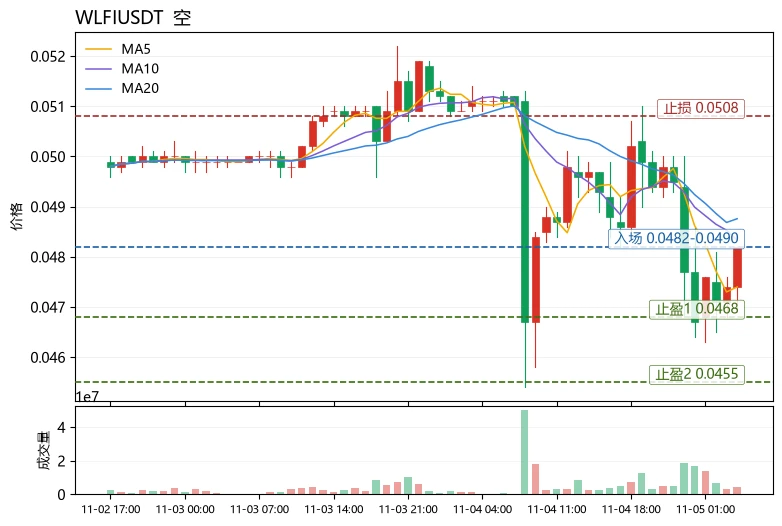
Many people directly treat “price near the moving average” as support or resistance when trying to buy the dip or sell the top. This is a classic static-thinking fallacy. Moving averages themselves do not provide support; the information comes from their alignment and the price’s position relative to them.
Using $WLFI as an example, here is a reusable method: To assess whether the trend is healthy, first check the alignment of MA5 and MA20. Currently, MA5=0.0474 is below MA20=0.04876, with the short-term moving average below the long-term one, indicating a bearish alignment and a trend that h
post-image
WLFI-0.16%
UNI+3.05%
ZEC+1.16%
Aster has now burned 212,693,406.39 ASTER across all its programs.
In the two weeks to November 2, 99% of its platform fees bought back 2,604,529.88 ASTER for stakers, and a matching amount was burned from the team allocation.
@Aster_DEX
ASTER-0.07%
⛽ Colombia-Venezuela Gas Pipeline: The Energy News That Is NOT Moving Your USDT Today
Ecopetrol wants to restart the Antonio Ricaurte Binational Gas Pipeline after more than a decade out of service. The Colombian government has included it in its Projects of National and Strategic Interest (PINES), with the goal of bringing Venezuelan gas into Colombia’s system for domestic distribution. Colombia is facing a gas deficit and looking for alternatives as its own fields mature and production declines.
The question already circulating in P2P groups: Will this bring down the parallel exchange rate?
post-image
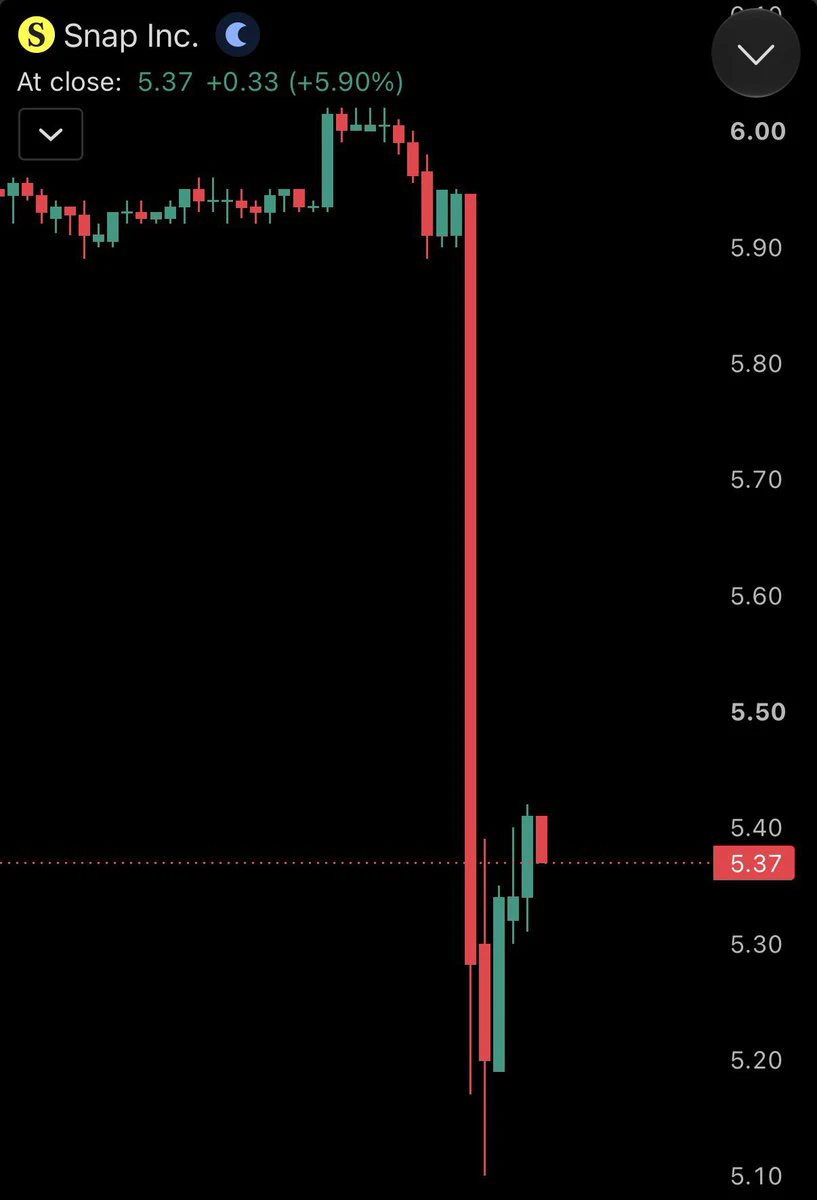
BREAKING: Snapchat introduces new feature, the disappearing share price.
post-image
AI Trading, Keep Going Unyieldingly
live-cover
LIVE65
$XBRUSD ‌
Why did Brent fall below $100?
Brent fell more than 4% in January contracts, dropping to around $98.76 on November 4th. This is the first time it has fallen below $100 since early October. The three-session decline indicates a rapid repricing of the geopolitical risk premium embedded in oil prices.
This isn't just a technical level; it's a combination of structural shifts in supply expectations and post-election market reassessment.
What's returning to normal on the supply side?
The US energy statistics agency forecasts that Middle East crude oil production will increase in the comi
post-image
XBRUSD-9.19%
  • 14
  • 1
🔹Markets Sell Off Ahead of Election Results! BTC Falls Below $77,000 and ZEC Drops Nearly 10. Are I
live-cover
LIVE39
Your circle shapes your perspective; choices matter more than effort.
Growing your account never comes from simply toughing it out,
following the right people and getting the timing right is what matters.
The market can change in an instant,
hesitate for a second, and you’ll miss the entire wave of gains.
What truly sets people apart
is knowledge—and, even more, decisiveness.
#美股财报季
When you lose the midterms, the House, the Senate, Texas and a state that has been Republican since 1932
post-image
The trenches have their best soldier back
It's time to run it up big time
post-image
🤔 Is the Clarity Act in jeopardy?
With the Democrats' victory in the US elections, hopes for the swift passage of the Clarity Act are fading.
Democrats are demanding stricter protection for investors and limitations on cryptocurrency-related activities for government officials, which will require additional amendments to the bill.
The current Congress has time until January 2027.
post-image
improved my setup and selfies.
post-image
Load More

Join 40 M users in our growing community

⚡️ Join 40 M users in the crypto craze discussion

💬 Engage with your favorite top creators

👍 See what interests you

Trending Topics

GateLaunchesTaiwanStockTrading

11.08k Views233 Discussing

Gate has launched Taiwan stock trading with 19 stocks available for direct $USDT trading, including TSMC (2330) and MediaTek (2454). From U.S. and Hong Kong stocks to Japan, Korea and now Taiwan, Gate is connecting users with more global traditional assets. Which Taiwan stock would you most want to access with $USDT — TSMC, MediaTek, or another AI supply-chain name?

DemocratsWinBothChambers

10.3k Views374 Discussing

ChipStocksRebound

13.9k Views3.02k Discussing

View More