#夏日创作营 Bitcoin’s sluggish decline shows no sign of stopping—why has the extreme washout holding volume increased under the dominance of the bears?
I. Macro and market backdrop: capital outflow vs. contradictory headlines
The core reason lies in a volatile macro environment and the exhaustion of incremental capital:
Geopolitical headlines sending mixed signals: taking US political developments as an example, Congress releases inconsistent signals in a bill regarding powers for military action against Iran, and in addition, the situation-ending ceasefire agreement was rejected. The macro layer is filled with extreme uncertainty, causing both bulls and bears to hesitate.
Incremental capital being withdrawn: the overall capital base in the crypto market is currently relatively weak, with a large amount of liquidity being pulled into the US stock market. Without continuous inflows of OTC funds, it’s unrealistic to blindly expect a major upside one-way rebound.
Market sentiment hits a freezing point: due to prolonged narrow-range up-and-down wash trading, retail investors feel extremely uncomfortable. The Fear and Greed index across the whole network has officially fallen into an “extreme fear” phase around 20.
II. Price-volume analysis: the “undercurrent” behind the increase in open positions
On the chart, there’s a critically important contradiction—while the price keeps probing lower, the total open positions clearly rise during rebounds.
There is indeed bid support at the lows: when the price broke down and touched the 64,600 low, the market didn’t collapse quickly. Instead, alongside the synchronized increase in open positions, there was a rebound, indicating that some capital actively bought and absorbed at the low level.
Bulls are extremely passive: the most unfavorable detail for bulls is that although new positions appeared at the low and were retained, the trades didn’t transform into strong upward momentum. The high failed to effectively break through the prior selloff breakout zone. This means the newly added chips lack sustained upward attack power, and the market structure is still dominated by the bears.
III. Multi-timeframe technicals
Judging from moving averages, the Bollinger Bands, and momentum indicators, each timeframe shows different suppression and support characteristics:
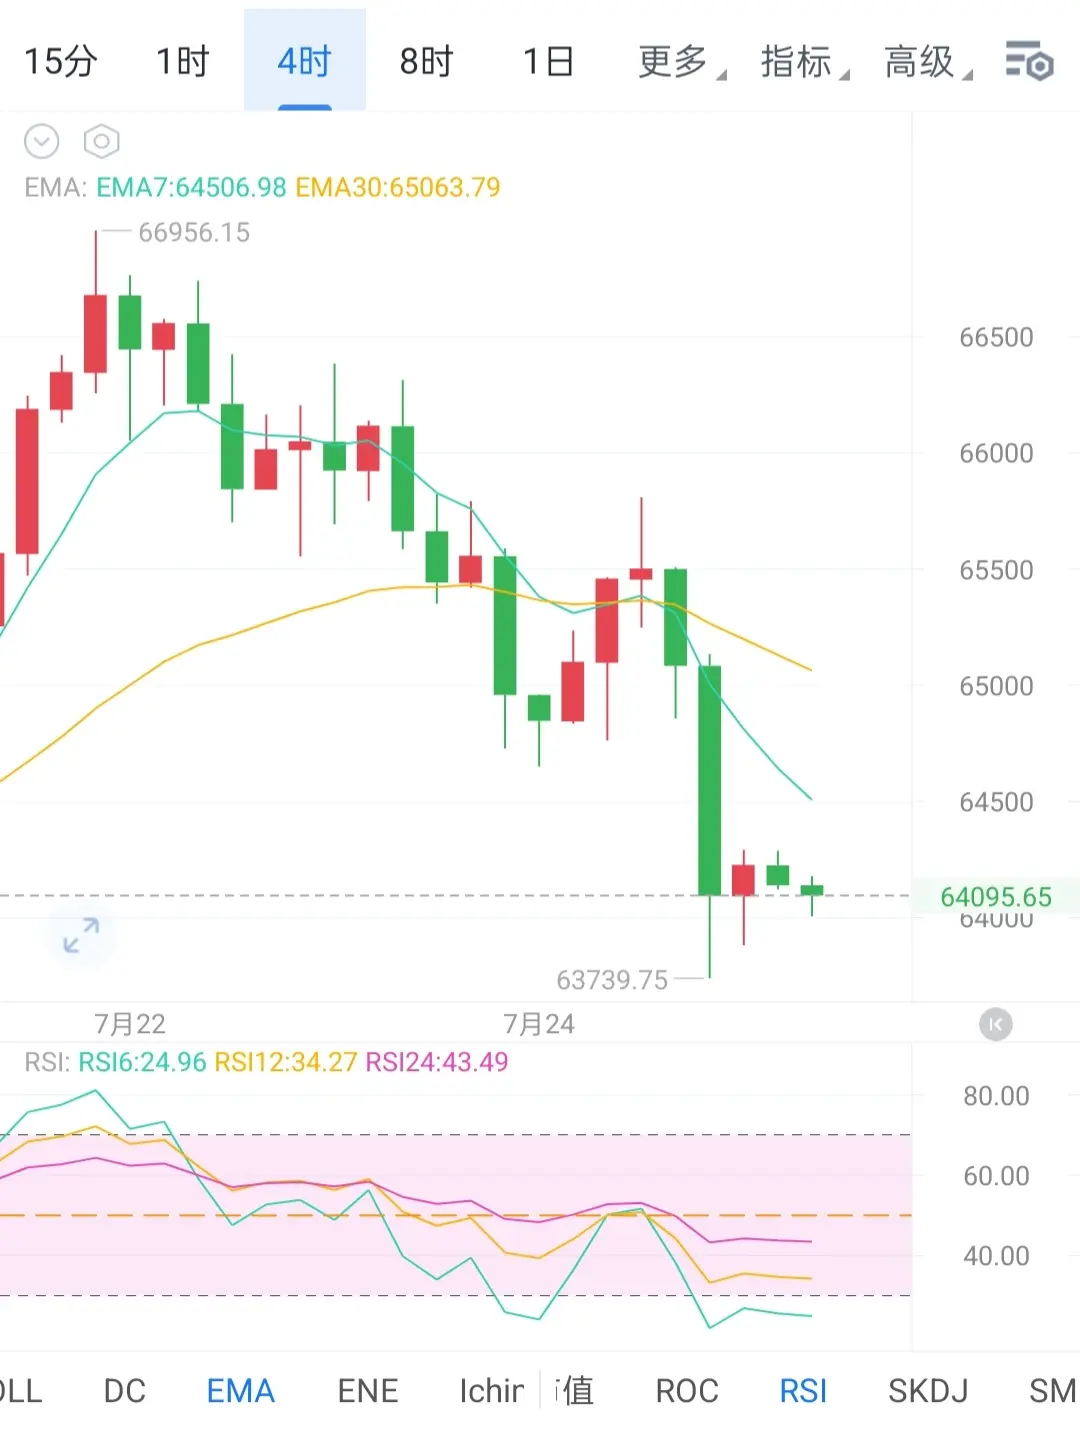
1-hour – 4-hour lines (short-term under pressure): the 5-day and 7-day moving averages have already been fully broken down, and short-term rebound momentum has weakened rapidly. The 4-hour level is currently running along the lower Bollinger Band. The strong resistance concentration is at 65,200 – 65,500. If it cannot break upward effectively, the outlook is more likely to continue breaking down than to just trade sideways in place.
Daily timeframe (extreme compression and mid-term protection at the floor): the daily chart printed a bearish candle, and the price’s center of gravity keeps shifting downward. The Bollinger Bands’ upper and lower rails are in a severe “extreme compression” phase, with price tightly trapped in the narrow range of 64,300 to 65,500. Usually, when such long space keeps tightening, it signals that a new round of major one-way breakout is about to arrive. The 20-day moving average (around 64,300) is still providing a mid-term support floor that has held for three weeks.
Weekly timeframe (weak repair within a downtrend): from a bigger perspective, after the prior quick blow-off top at the high, it quickly fell back, swallowing the earlier upswing gains. Currently, the weekly chart is only a very weak rebound within the broader trend’s downward path, without changing the overarching pressure structure.
Core momentum indicators:
MACD: short-term is in a golden-cross repair below the zero axis, but the expansion in volume is limited. The 4-hour line still maintains a dead-cross configuration, and the counterattack structure has yet to materialize.
DMI – RSI: the DMI indicator shows bears dominate (bearish advantage). Meanwhile, the RSI also failed to return above the 50 strength/weakness dividing line across key timeframes, proving that bulls are passive across the board.
IV. Support and resistance levels
Strong resistance: 65,800, the extreme rebound pressure zone—a disaster area bulls cannot cross.
First resistance: 65,200 – 65,500, the intraday battleground between bulls and bears. If the 4-hour close can stand above this level, it can be viewed as a continuation of weak repair; if it meets resistance, the rebound is immediately considered over.
First support: 64,600 – 64,700, the core short-term defense area. The overlap zone of the prior low probe and the closing area—once broken, the rebound fails and downside risk increases.
Strong support: 64,100 – 64,300, the final mid-term line of defense. Corresponding to the daily and 4-hour channel support—if there’s a breakdown with a wick insertion, focus on whether price can quickly reclaim this level.
Respect the market and manage risk reasonably
In such an extreme sideways washout and a chop market where bulls and bears repeatedly get double-killed, trying to guess the top or bottom subjectively often brings unnecessary stop-loss burden. In the face of market uncertainty, traders should maintain a sense of敬畏之心 (respect/awe) and face normal pullbacks within the trading system. At this stage, staying in cash with a light position or strictly following the key boundaries—short at the top and long at the bottom—with stop-losses in place is the way to preserve strength during a washout and wait for the arrival of the bigger trend. $BTC
I. Macro and market backdrop: capital outflow vs. contradictory headlines
The core reason lies in a volatile macro environment and the exhaustion of incremental capital:
Geopolitical headlines sending mixed signals: taking US political developments as an example, Congress releases inconsistent signals in a bill regarding powers for military action against Iran, and in addition, the situation-ending ceasefire agreement was rejected. The macro layer is filled with extreme uncertainty, causing both bulls and bears to hesitate.
Incremental capital being withdrawn: the overall capital base in the crypto market is currently relatively weak, with a large amount of liquidity being pulled into the US stock market. Without continuous inflows of OTC funds, it’s unrealistic to blindly expect a major upside one-way rebound.
Market sentiment hits a freezing point: due to prolonged narrow-range up-and-down wash trading, retail investors feel extremely uncomfortable. The Fear and Greed index across the whole network has officially fallen into an “extreme fear” phase around 20.
II. Price-volume analysis: the “undercurrent” behind the increase in open positions
On the chart, there’s a critically important contradiction—while the price keeps probing lower, the total open positions clearly rise during rebounds.
There is indeed bid support at the lows: when the price broke down and touched the 64,600 low, the market didn’t collapse quickly. Instead, alongside the synchronized increase in open positions, there was a rebound, indicating that some capital actively bought and absorbed at the low level.
Bulls are extremely passive: the most unfavorable detail for bulls is that although new positions appeared at the low and were retained, the trades didn’t transform into strong upward momentum. The high failed to effectively break through the prior selloff breakout zone. This means the newly added chips lack sustained upward attack power, and the market structure is still dominated by the bears.
III. Multi-timeframe technicals
Judging from moving averages, the Bollinger Bands, and momentum indicators, each timeframe shows different suppression and support characteristics:
1-hour – 4-hour lines (short-term under pressure): the 5-day and 7-day moving averages have already been fully broken down, and short-term rebound momentum has weakened rapidly. The 4-hour level is currently running along the lower Bollinger Band. The strong resistance concentration is at 65,200 – 65,500. If it cannot break upward effectively, the outlook is more likely to continue breaking down than to just trade sideways in place.
Daily timeframe (extreme compression and mid-term protection at the floor): the daily chart printed a bearish candle, and the price’s center of gravity keeps shifting downward. The Bollinger Bands’ upper and lower rails are in a severe “extreme compression” phase, with price tightly trapped in the narrow range of 64,300 to 65,500. Usually, when such long space keeps tightening, it signals that a new round of major one-way breakout is about to arrive. The 20-day moving average (around 64,300) is still providing a mid-term support floor that has held for three weeks.
Weekly timeframe (weak repair within a downtrend): from a bigger perspective, after the prior quick blow-off top at the high, it quickly fell back, swallowing the earlier upswing gains. Currently, the weekly chart is only a very weak rebound within the broader trend’s downward path, without changing the overarching pressure structure.
Core momentum indicators:
MACD: short-term is in a golden-cross repair below the zero axis, but the expansion in volume is limited. The 4-hour line still maintains a dead-cross configuration, and the counterattack structure has yet to materialize.
DMI – RSI: the DMI indicator shows bears dominate (bearish advantage). Meanwhile, the RSI also failed to return above the 50 strength/weakness dividing line across key timeframes, proving that bulls are passive across the board.
IV. Support and resistance levels
Strong resistance: 65,800, the extreme rebound pressure zone—a disaster area bulls cannot cross.
First resistance: 65,200 – 65,500, the intraday battleground between bulls and bears. If the 4-hour close can stand above this level, it can be viewed as a continuation of weak repair; if it meets resistance, the rebound is immediately considered over.
First support: 64,600 – 64,700, the core short-term defense area. The overlap zone of the prior low probe and the closing area—once broken, the rebound fails and downside risk increases.
Strong support: 64,100 – 64,300, the final mid-term line of defense. Corresponding to the daily and 4-hour channel support—if there’s a breakdown with a wick insertion, focus on whether price can quickly reclaim this level.
Respect the market and manage risk reasonably
In such an extreme sideways washout and a chop market where bulls and bears repeatedly get double-killed, trying to guess the top or bottom subjectively often brings unnecessary stop-loss burden. In the face of market uncertainty, traders should maintain a sense of敬畏之心 (respect/awe) and face normal pullbacks within the trading system. At this stage, staying in cash with a light position or strictly following the key boundaries—short at the top and long at the bottom—with stop-losses in place is the way to preserve strength during a washout and wait for the arrival of the bigger trend. $BTC