Share crypto content and earn up to 60% commissions through content mining.
placeholder
gatefun
$TURTLE | 1h | Breakout Continuation
Bias: Long
Entry Zone: 0.0384 to 0.0392
Stop Loss: 0.0371
Targets:
TP1: 0.0418
TP2: 0.0448
TP3: 0.0478
Invalidation:
Close below 0.0371
Why This Setup:
I’m looking for continuation after the sharp impulsive breakout and high-volume expansion through prior consolidation. As long as price holds above the breakout area, I want the next leg into the nearby liquidity levels.
TURTLE7.94%
post-image
  • Reward
  • Comment
  • Repost
  • Share
RACE TO A BILLION MC 🐸
$DROVER
#HYDRACHAIN
$PEPE
$CKOM
$WOJAK
$BOB
$PONKE
$MYRO
#Cat
$BRETT
$DOG
$GME
$TRUMP
$WYNN
$Bonk
$PEOPLE
WHO WILL GET THERE FIRST? 🤔
PEPE2.50%
WOJAK-4.53%
BOB-1.56%
PONKE0.77%
MYRO-6.43%
post-image
  • Reward
  • Comment
  • Repost
  • Share
Long-Term Bitcoin Holders Continue to Expand Positions!
gate liveLIVE
723
live-coin
  • Reward
  • Comment
  • Repost
  • Share
$JIMOTHY looks like the only bag on solana that gives a fuck about traders
keep sending this one higher
SOL2.50%
  • Reward
  • Comment
  • Repost
  • Share
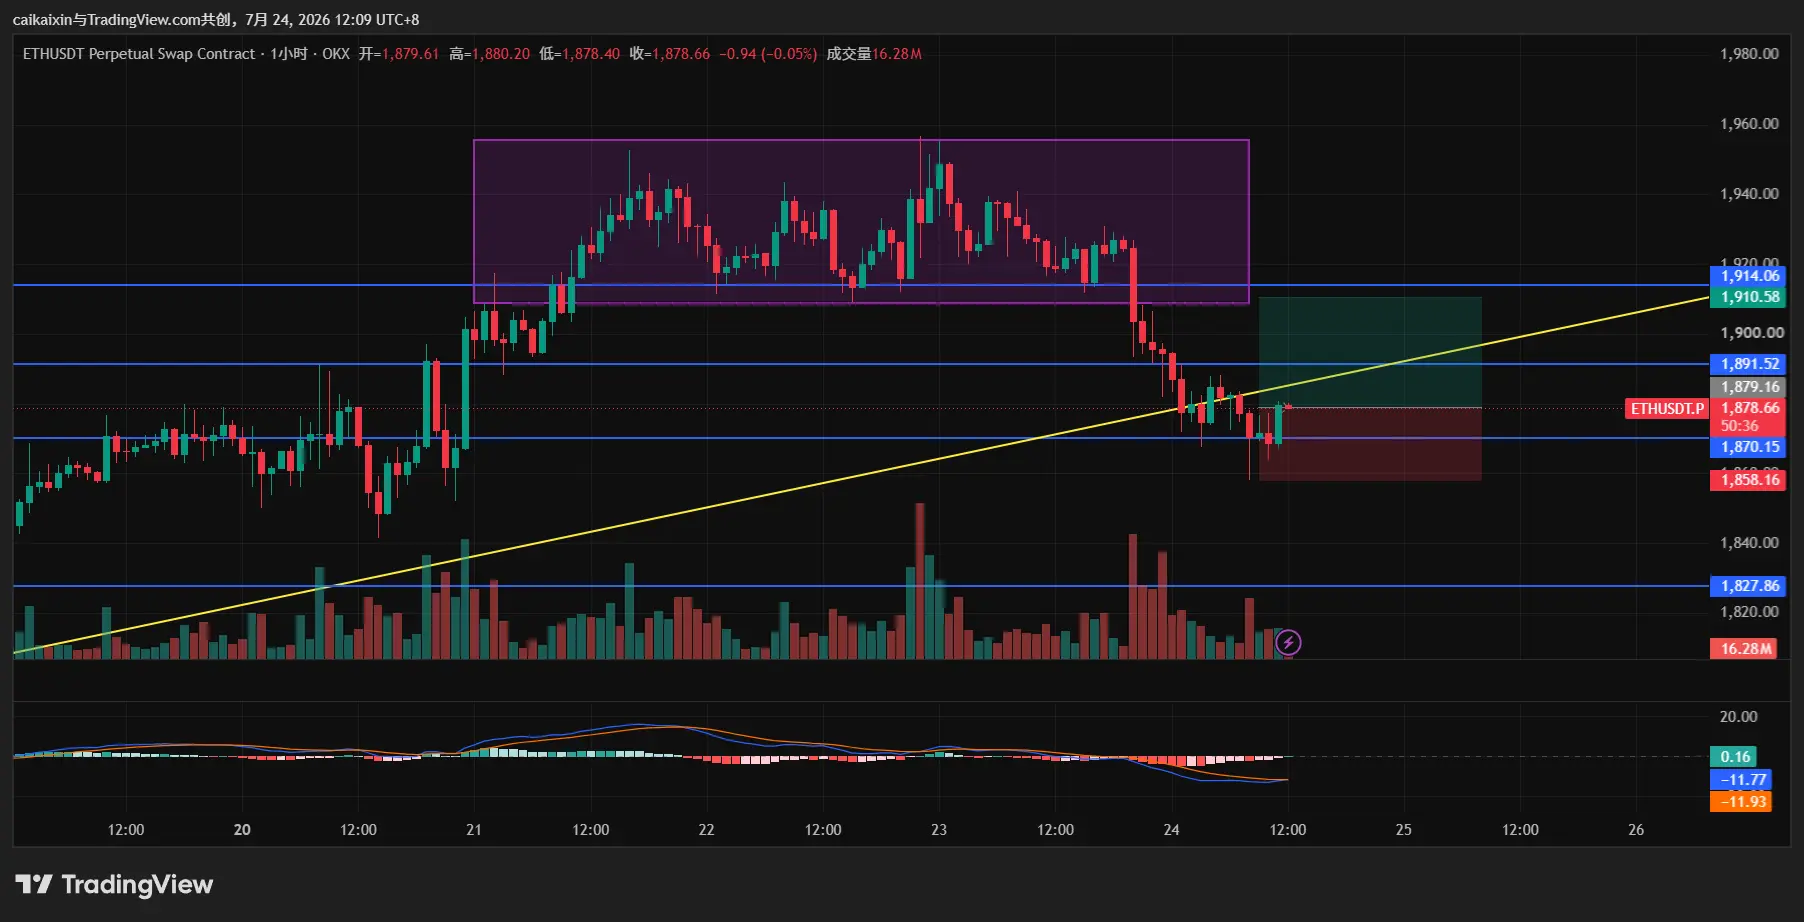
#eth Tangxin Community: last week’s record has been updated.
Next, keep an eye on the market from the afternoon of the 21st–27th–30th for the second half of the month!
ETH2.23%
View Original
post-image
  • Reward
  • Comment
  • Repost
  • Share
Global Power Demand Influences Commodity Markets!
gate liveLIVE
712
live-coin
  • Reward
  • Comment
  • Repost
  • Share
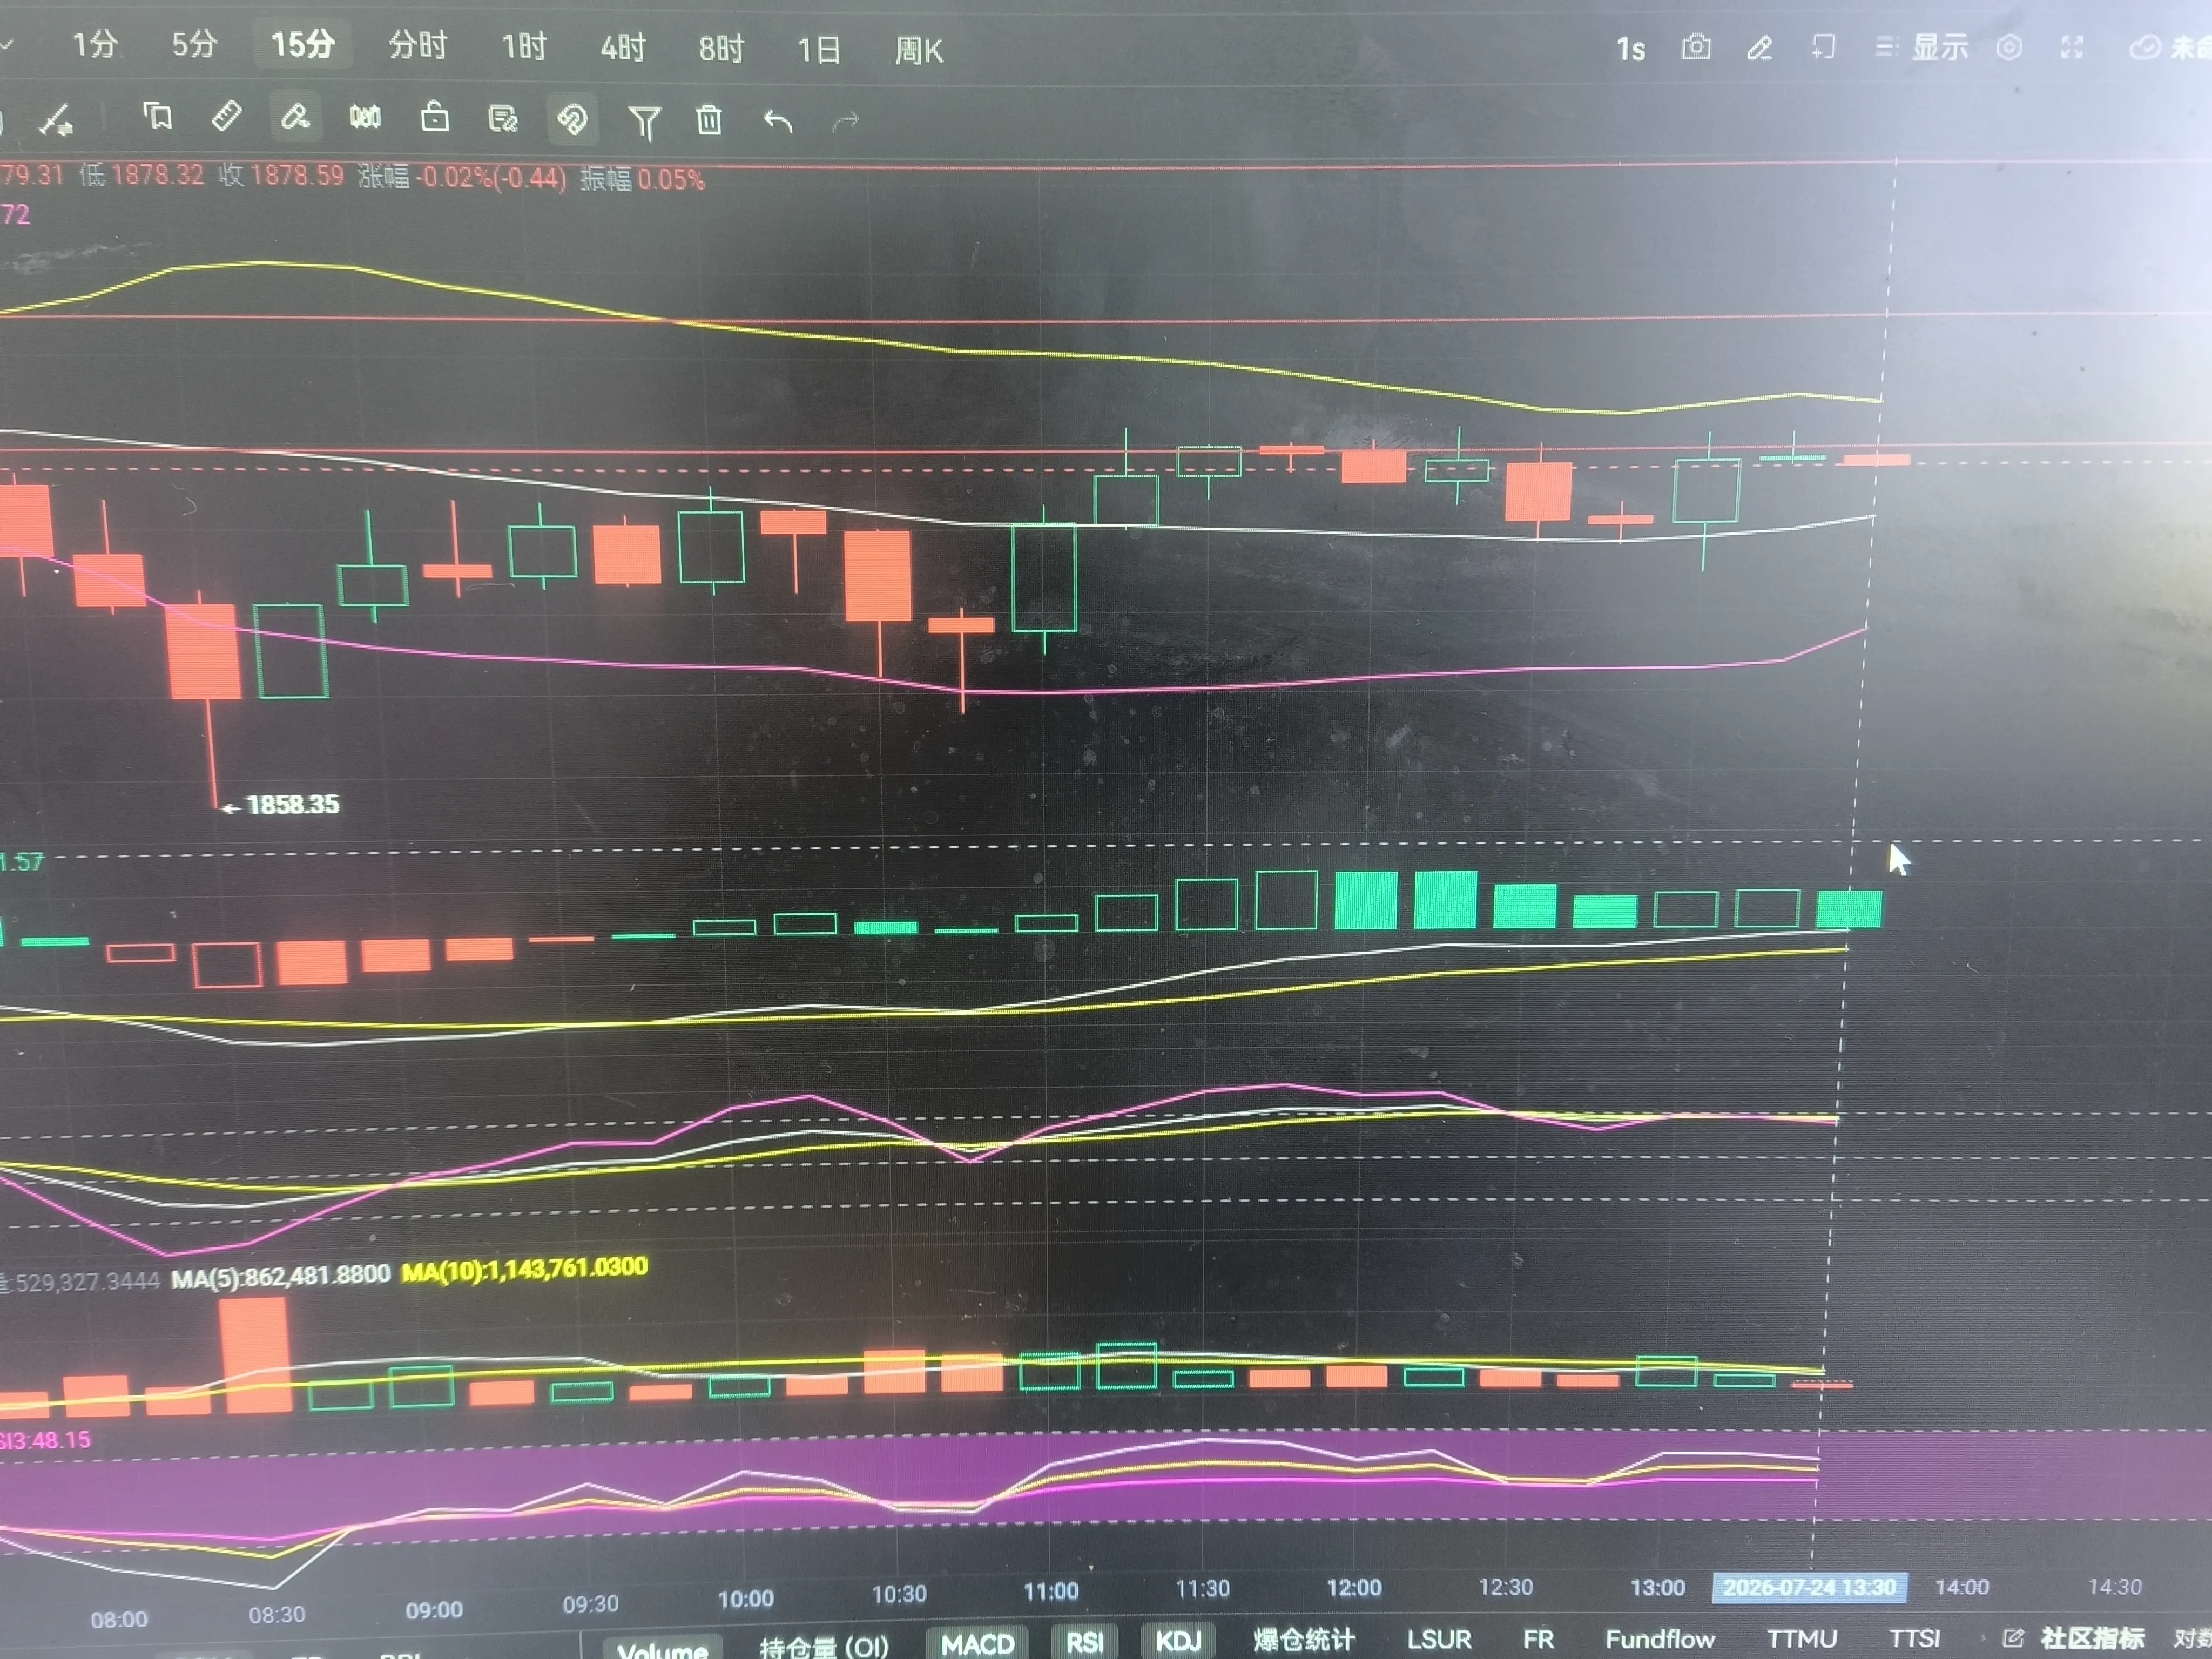
ETH
Brothers, this is the last ETH needle—this wave, whether you can seize the chance to make a big fat gain is up to you. You might as well be bold enough to take it, or you’ll end up starving if you’re too timid. Just go for it.
ETH2.23%
View Original
post-image
  • Reward
  • Comment
  • Repost
  • Share
$ALLO | 1h | Breakout Retest
Bias: Long
Entry Zone: 0.4840 to 0.4870
Stop Loss: 0.4470
Targets:
TP1: 0.5120
TP2: 0.5300
TP3: 0.5580
Invalidation:
Close below 0.4470
Why This Setup:
I’m watching the current breakout hold above the 0.4840 area after a sharp expansion move. If price accepts above the prior resistance and retests cleanly, I think the next leg can extend into the recent highs with momentum behind it.
ALLO6.51%
post-image
  • Reward
  • Comment
  • Repost
  • Share
ACE is now around 0.073u. Its all-time high reached 16.73u, which means it’s down 99.96%.
This game is quite hardcore: it’s a 3A-class game independently developed by the team. It uses the Unity engine, plus a high-definition rendering pipeline for the visuals. For online synchronization, it uses a protocol the team wrote themselves, ensuring that all game outcomes are calculated by the backend—eliminating cheating tools.
Under the hood, it runs on its own built chain called Endurance, optimized specifically for game and social scenarios. It’s EVM-compatible, so wallet services, game publisher
ACE83.71%
View Original
post-image
  • Reward
  • Comment
  • Repost
  • Share
That's some solid support for $TENDIES.
The $10–15M range is a psychological support zone as well.
If it holds, it'll bounce back hard, just like $CASHCAT.
post-image
  • Reward
  • Comment
  • Repost
  • Share
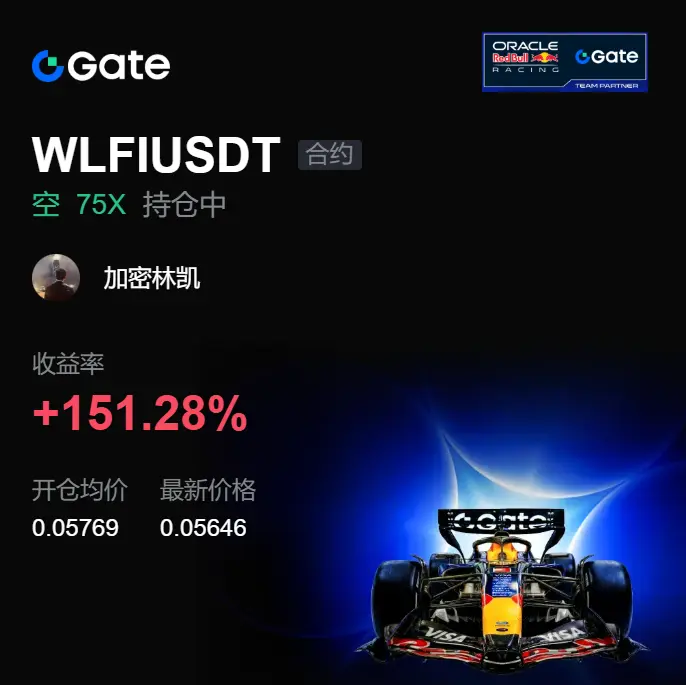
I was originally going to shut the software down, but 😮 gave me a real nose-dive in the middle of the session. When $WLD bounced back, it was clearly weak—several pushes upward were all pushed back down. Finally, the shorts took over the rhythm.
At the time, I didn’t panic just because it started pumping, and I didn’t chase randomly at key levels. Instead, I waited for confirmation of the lack of follow-through—signals indicating the short entry. The opening price was 0.3914. I laid out the plan first before executing.
Now the current price on my screen is 0.3773. The short position is locke
WLD4.60%
BTC1.67%
ETH2.22%
View Original
post-image
  • Reward
  • Comment
  • Repost
  • Share
A BTC rebound is bearish!
Entry zone: 65,600-66,300
Defense level: Above 66,800
Target zone: 64,200-63,600
Plan: The rebound is under bearish pressure—if it doesn’t break the previous high, it’s just a paper tiger! Follow it strictly and wait for the flowers to bloom!
BTC1.66%
View Original
post-image
  • Reward
  • Comment
  • Repost
  • Share
Specifically, wallets holding between 1,000 and 10,000 BTC saw a net accumulation of approximately 66,700 BTC over the past 60 days, close to the level of 68,000 BTC set on June 16. In contrast, wallets holding between 100 and 1,000 BTC recorded a net selling of approximately 77,800 BTC, one of the most aggressive selling periods in the current data.
{spot}(BTCUSDT)
BTC1.66%
View Original
  • Reward
  • Comment
  • Repost
  • Share
This round of sell-off was pretty direct. The higher the grind at the front, the more decisively it gets released later. My short thesis was confirmed around 258.4. Now the price is at 195.5, and my unrealized profit is +1174.12%. Exiting shorts on this leg feels like it hit the timing.
What really made me make the call wasn’t a single K-line, but several consecutive rebounds that failed to gain momentum. From the chart, it looks like it could hold up—but in reality, sell pressure has been sitting overhead the whole time, and the bid is taking it very loosely. A lot of people get ground down b
TAO-0.36%
BTC1.67%
ETH2.22%
View Original
post-image
  • Reward
  • Comment
  • Repost
  • Share
$AMD MI455X is now confirmed to be selected by:
> OpenAI
> Meta
> Microsoft
> Oracle
Plus possibly Anthropic, which seems to be an open secret
Clearly, it brings something to the table, because these companies could use ASICs or $NVDA, yet they still want to bet on $AMD
AMD3.50%
META0.30%
MSFT2.00%
ORCL-2.69%
NVDA0.87%
post-image
  • Reward
  • Comment
  • Repost
  • Share
got full allo
cultivate your relationships with suppliers
ALLO6.69%
post-image
  • Reward
  • Comment
  • Repost
  • Share
🚨 JUST IN: $BTC has climbed above $65,500 for the first time in nearly a month.
The move comes as more than $250 million in crypto positions were liquidated over the past 24 hours.
BTC1.67%
post-image
post-image
  • Reward
  • Comment
  • Repost
  • Share
There are thousands of indicators in trading.
Yet after decades, one indicator remains on almost every professional trader's chart:
RSI — Relative Strength Index.
Why?
Because markets don't move on price alone.
They move on momentum. 🧠
RSI helps traders measure that momentum.
It answers a very important question "How strong is this move?"
A market can go up in price…
But if momentum is weakening, the trend may be losing energy.
Likewise, a market can still be falling while selling momentum is fading.
This is why RSI became one of the most popular indicators in the world.
🔹️ Momentum Measurem
post-image
CryptoSat
Most beginners see RSI hit 70 and instantly think: " Time to sell "
Then they watch $BTC rally another 10%.
Or they see RSI drop below 30 and buy immediately…
Only to watch the market fall even further.
The problem isn't RSI.
It's misunderstanding what RSI levels actually mean.
Let's break it down.
🔴 RSI 30 – Oversold Zone
When RSI falls below 30, it means selling momentum has become very strong.
But it doesn't automatically mean price will reverse.
For example:
During major BTC corrections, RSI can stay below 30 for several candles while price continues falling.
Instead of blindly buying, ask:
▫️ Is selling pressure slowing down?
▫️ Is support holding?
▫️ Is there bullish divergence?
RSI below 30 is a warning sign, not a buy signal.
🟡 RSI 50 – Momentum Line
This is one of the most underrated RSI levels.
RSI 50 often acts like a dividing line between bullish and bearish momentum.
▪️ Above 50 = Buyers have momentum.
▪️ Below 50 = Sellers have momentum.
Many trend traders use RSI 50 as confirmation.
For example:
If #BTC breaks above resistance and RSI moves above 50, momentum is often supporting the breakout.
🟢 RSI 70 – Strong Momentum Zone
Most people call this "overbought."
Professional traders often call it "strong."
During bull markets, BTC can remain above RSI 70 for a long time.
This usually means buyers are aggressively controlling the market.
Selling simply because RSI reaches 70 can be a costly mistake.
⚠️ Common Beginner Mistakes
▫️ Buying every RSI 30 touch
▫️ Selling every RSI 70 reading
▫️ Ignoring market trend
▫️ Using RSI without volume or price action confirmation
RSI works best when combined with:
▪️ Market structure
▪️ Moving Averages
▪️ Support and resistance
▪️ Volume confirmation
📌 RSI doesn't tell you where the market will go next.
It tells you how strong the current momentum is.
The smartest traders don't ask: "Is RSI overbought or oversold?"
They ask: "What is momentum trying to tell me right now?"
#SummerCreationCamp
repost-content-media
  • Reward
  • Comment
  • Repost
  • Share
💰 $ETC Review/Analysis:
↗️ The ETC price has gathered liquidity from its previous lows and held above them. This gives the price the potential to begin an upward move. The main target for the rally is the 4-hour OB zone above the $7.50 level.
ETC0.30%
post-image
  • Reward
  • Comment
  • Repost
  • Share
This chart shows the market cycle $BTC has followed repeatedly over the years.
1. Accumulation
2. Mark Up
3. Distribution
4. And now... Mark Down.
If this cycle repeats once again, the biggest decline could still be ahead.
BTC1.66%
post-image
  • Reward
  • Comment
  • Repost
  • Share
Load More

Join 40 M users in our growing community

⚡️ Join 40 M users in the crypto craze discussion
💬 Engage with your favorite top creators
👍 See what interests you
  • Pinned