Share your thoughts
placeholder
Article
I originally wanted to cut my losses and sacrifice to the heavens, but the ritual never happened—the meat roasted itself. After seeing this market play out, I can only say: it feels good to be alive.

When everyone else was running, $UAI pulled back to a level and somehow held firmly again, with buying pressure gradually strengthening. I judged it to be a fake drop and reminded everyone to go long right then—don’t let the market action throw off your rhythm.

The process of getting the answer was agonizing, but the result was truly sweet. Entry at 0.36347, then the current price ran directly
post-image
UAI+19.63%
BTC-0.56%
SNDK-0.05%
BTC, Gold, and Crude Oil Analysis
live-cover
LIVE2,474
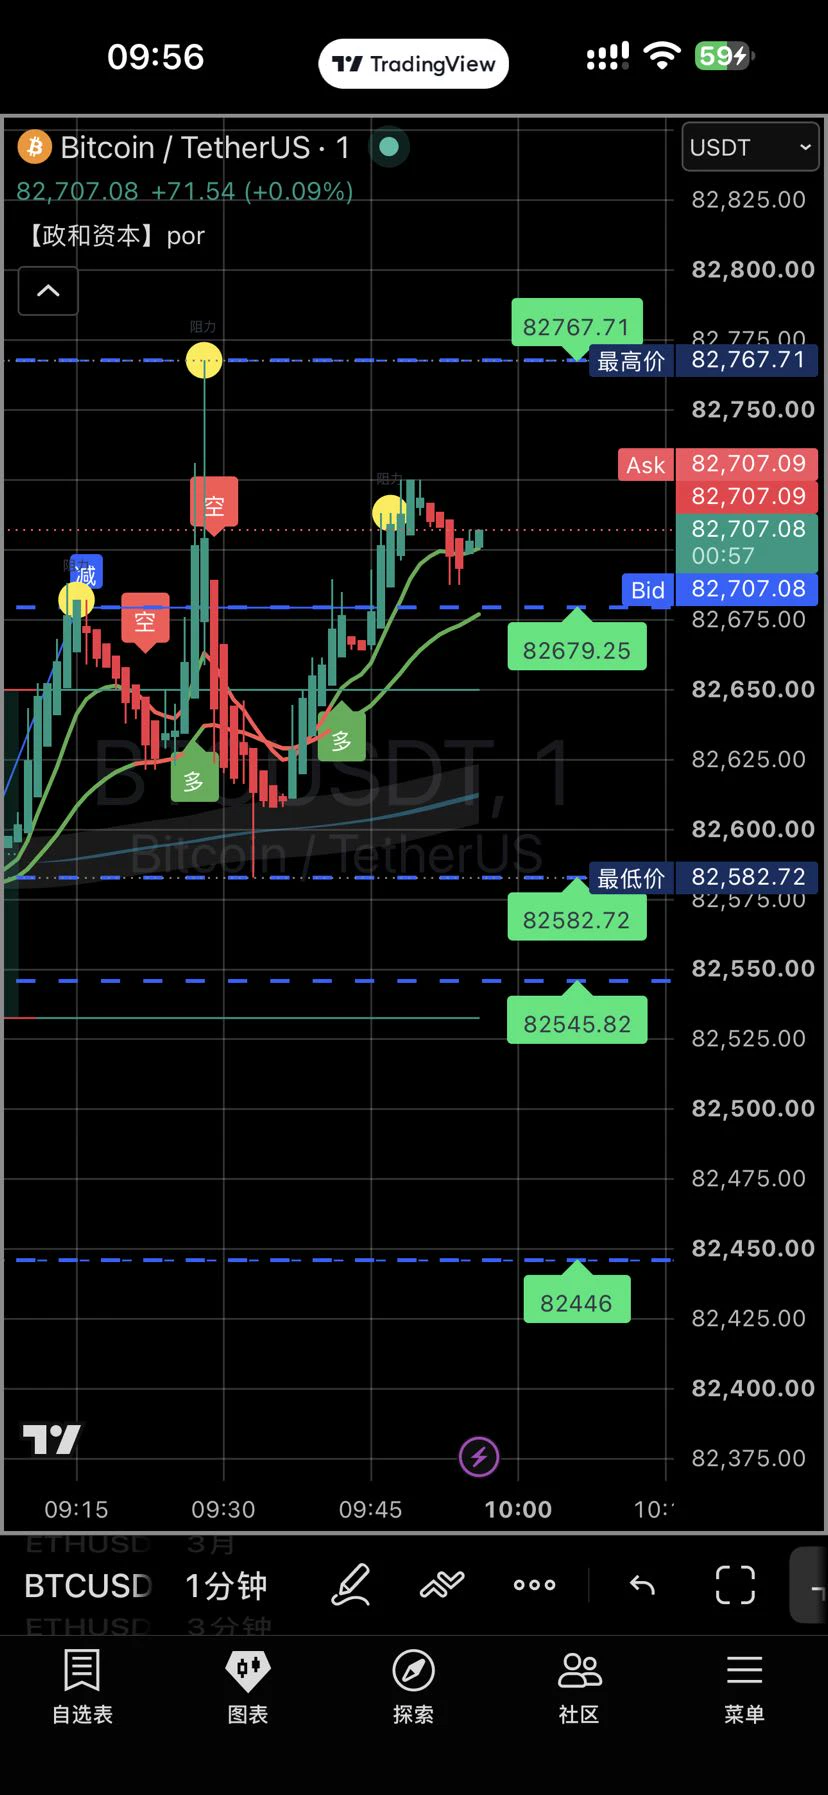
Macro, micro, technical, fundamental—whatever you have, urgently analyze $BTC so we can read your thoughts on the direction ⌛️
post-image
BTC-0.57%
$NBIS
Nebius Group is entering today’s market with a much stronger short-term structure after a powerful recovery from the late-August weakness. The latest completed Nasdaq session on September 4 closed at $226.39, up 7.48%, after opening around $210.19, reaching a high of $226.58 and a low of $209.41, with approximately 14.97 million shares traded.
The important part of this move is that NBIS did not simply bounce from support—it recovered above the $220 area with a substantial increase in participation. At the same time, the stock remains well below its 2026 high around the $300 zone, m
post-image
NBIS+7.51%
  • 2
Saw someone post in the group that MA120 is the most effective indicator for bitcoin:native risk-reward.
This is actually two versions of the same thing as my earlier $1 million U BTC dollar-cost averaging strategy.
BTC's returns have never been evenly distributed; the periods when it truly makes money and truly loses money are often highly concentrated.
From 2019 to now, most of BTC's genuinely meaningful gains have typically been concentrated in a few trend phases.
The second half of 2020, the period after 2023, and the several rounds surrounding ETF expectations and the official launch were
post-image
BTC-0.57%
$Niu Lai, a coin that rose to fame from a movie—can it still be bullish after the sentiment runs out?
After the price surged to 0.14, it clearly encountered resistance, with both attempts to move higher being pushed back. However, this pullback did not see the sharp sell-off experienced earlier, instead finding support and moving sideways around 0.083.
What does this indicate? I believe capital has not fully exited, and market sentiment has not completely faded either. This move looks more like a normal correction after early holders took profits at higher levels, rather than the trend coming
post-image
牛来-3.06%
#PONSDropsOver15%
#PONSDropsOver15% PONS/USDT — SHARP CORRECTION AFTER PARABOLIC RALLY
PONS PRICE: ~$0.81
PONS has entered a major profit-taking phase after one of the most aggressive rallies seen across the altcoin market recently. The token reached an all-time high near $0.9710 on September 5, but the momentum has now reversed sharply, with current market data showing PONS around the $0.81 area and the token suffering a double-digit 24-hour decline.
This correction should be viewed in the context of the extraordinary move that came before it. PONS had gained roughly 192% in one week, while
post-image
Jiaa_Insights
#PONSDropsOver15% PONS/USDT — SHARP CORRECTION AFTER PARABOLIC RALLY
PONS PRICE: ~$0.81
PONS has entered a major profit-taking phase after one of the most aggressive rallies seen across the altcoin market recently. The token reached an all-time high near $0.9710 on September 5, but the momentum has now reversed sharply, with current market data showing PONS around the $0.81 area and the token suffering a double-digit 24-hour decline.
This correction should be viewed in the context of the extraordinary move that came before it. PONS had gained roughly 192% in one week, while its recent monthly performance had been close to 3,000%, making the current pullback a natural test of whether the market can build a sustainable base after such an explosive advance.
WHY IS PONS DROPPING?
The most obvious factor is profit-taking after an extreme rally.
When an asset rises vertically, early buyers eventually begin locking in profits. That selling pressure becomes even stronger when late buyers enter near an all-time high.
Recent market analysis also points toward elevated selling volume accompanying the decline, suggesting that the move is more than a small intraday fluctuation. PONS has also recently entered a much more leveraged trading environment, increasing the possibility of rapid moves in both directions.
The important point is that a 15%+ correction after a parabolic rally does not automatically mean the long-term trend has completely reversed.
It means the market is now testing its first real support structure.
TECHNICAL STRUCTURE
PONS is currently trading well below its recent $0.9710 all-time high, showing that the breakout momentum has weakened considerably.
The first level I would watch is the $0.75–$0.80 zone.
If buyers defend this region and volume begins shifting back toward the upside, PONS could enter a consolidation phase and attempt another recovery.
If this zone fails decisively, the correction could become deeper.
The next major downside area would be around $0.65, which has also been highlighted in recent market analysis as a potential level if the $0.75–$0.80 region breaks.
MOMENTUM — COOLING RAPIDLY
The most important change is momentum.
PONS previously displayed extremely aggressive upside momentum as the token moved from fractions of a cent to nearly $1 in a very short period. That type of vertical movement is rarely sustainable without periods of heavy retracement.
The current decline therefore represents a momentum reset.
If selling pressure continues, momentum indicators would likely remain weak. But if PONS establishes a higher low around the $0.75–$0.80 region, momentum could begin rebuilding.
The first confirmation I would want is price stabilization followed by increasing buying volume.
VOLUME — THE KEY CONFIRMATION
Volume is extremely important after a move like this.
A falling price accompanied by increasing selling volume indicates that sellers are actively distributing positions.
However, if volume starts declining while price stabilizes, it could mean that the strongest wave of profit-taking is coming to an end.
The ideal bullish setup would therefore be:
Price holds support + selling volume decreases + buying volume returns.
Without that combination, any bounce could simply become another opportunity for existing holders to sell.
PONS AND ROBINHOOD CHAIN
PONS remains closely connected with the rapid growth of activity on Robinhood Chain.
The Pons application has generated significant fee activity from its token-creation ecosystem, with reports showing nearly $6 million in fees over a 24-hour period during the recent activity surge. The platform also reportedly created tens of thousands of tokens in a single day.
This fundamental activity explains why market attention around PONS has increased so quickly.
But strong ecosystem activity does not eliminate market risk.
The token has already experienced an extraordinary repricing, so valuation, liquidity and leverage must now be considered alongside the underlying ecosystem growth.
KEY SUPPORT LEVELS
$0.80 — immediate psychological support
$0.75 — critical short-term support
$0.65 — deeper correction target
If PONS holds $0.75–$0.80, the current move could develop into consolidation rather than a full trend reversal.
A clean break below $0.75 would change the technical picture and increase the probability of a move toward $0.65.
KEY RESISTANCE LEVELS
$0.85 — first recovery resistance
$0.90 — psychological resistance
$0.97 — previous all-time high
$1.00 — major psychological breakout level
For the bulls, reclaiming $0.90 would be the first meaningful improvement.
A break above $0.97 would place PONS back into price discovery.
A sustained move above $1.00 would represent a major psychological breakout, but I would want strong volume confirmation before considering such a move reliable.
BULLISH SCENARIO
The bullish setup begins with PONS defending $0.75–$0.80.
If buyers absorb the current selling pressure and the token reclaims $0.85, the next targets would be:
$0.90 → $0.97 → $1.00
A break above the previous ATH around $0.9710 with strong volume could reopen the price-discovery phase.
However, after such a massive rally, I would expect volatility to remain extremely high even in the bullish scenario.
BEARISH SCENARIO
The bearish scenario becomes stronger if PONS loses $0.75 with heavy volume.
In that situation, the market could move toward $0.65, and if broader crypto sentiment also deteriorates, deeper levels could eventually become relevant.
The important point is that the current correction does not automatically justify expecting a collapse back to the much lower prices seen earlier in the year.
PONS has undergone a fundamental repricing alongside the expansion of the Robinhood Chain ecosystem, so the market must first break each major support level before a much deeper bearish target becomes technically valid.
MY PONS OUTLOOK
At approximately $0.81, my short-term view is:
BEARISH ON MOMENTUM — CAUTIOUS ON TREND
The immediate momentum is clearly negative after the 15%+ correction.
But the bigger trend cannot be judged from one red day alone because PONS has just experienced an extraordinary parabolic rally.
My main decision zone is $0.75–$0.80.
If this zone holds:
$0.85 → $0.90 → $0.97 → $1.00
become the recovery levels I would watch.
If $0.75 breaks with strong selling volume:
$0.65 becomes the next important downside zone.
FINAL TAKE
PONS is showing exactly why parabolic crypto rallies require disciplined risk management.
The token reached an all-time high around $0.9710, but the subsequent 15%+ decline shows that profit-taking can arrive extremely quickly after vertical moves.
For me, the most important question is no longer whether PONS can produce another massive candle.
The question is whether buyers can build a sustainable base after the correction.
PONS PRICE: ~$0.81
RECENT ATH: $0.9710
CRITICAL SUPPORT: $0.75–$0.80
DEEPER SUPPORT: $0.65
RECOVERY RESISTANCE: $0.85 → $0.90
BREAKOUT LEVEL: $0.97–$1.00
My view: PONS remains one of the highest-volatility tokens in the market. The current correction is a serious momentum warning, but a successful defense of $0.75–$0.80 could turn this pullback into a consolidation phase before another attempt higher. A decisive loss of $0.75 would make the bearish scenario much stronger.
PONS-11.20%
Insiders are fading this range while SYMBOL sits at the exact entry zone.

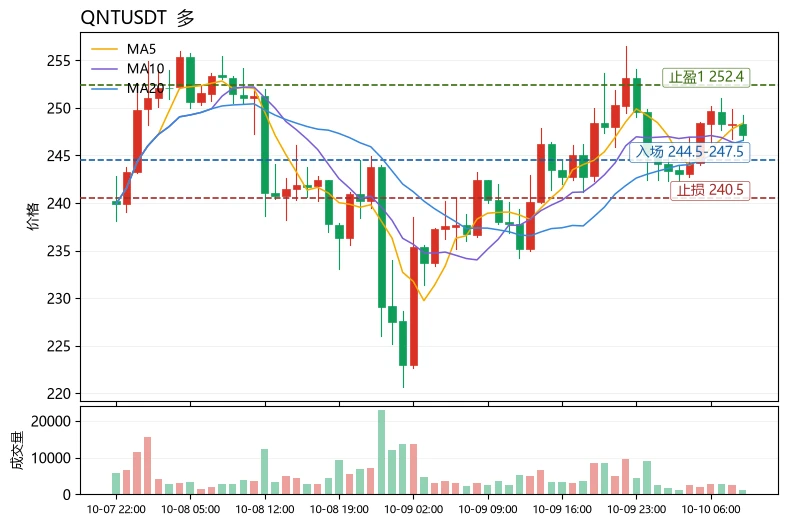
$ADA /USDT - SHORT

Trade Plan:
Entry: 0.2230 – 0.2246
SL: 0.2311
TP1: 0.2184
TP2: 0.2147
TP3: 0.2093

Why this setup?
Why now? The daily trend is range-bound, so the market is coiling for a directional move that has not yet arrived. The 1h ATR of 0.003026 shows average hourly swings are tight, meaning a breakout from the current entry zone of 0.2238 to 0.2246 could be explosive. The 15m RSI at 68.49 is approaching overbought territory, hinting that short-term momentum is running out of steam. With the higher-timefra
ADA+1.42%
🎁 5,000 USDT in rewards await you! Round 2️⃣ 2️⃣ of the Growth Points Draw is ongoing!
300 Growth Points = 1 draw. Up to 10 draws daily, and every draw wins! 🤩
💫 Interact every day and earn Growth Points with ease
🔹 Visit Square: Post, like, comment, and share for up to +600 daily
🔹 Watch Live: Watch, follow, like, comment, and share for up to +300 daily
🔹 Join Hot Chat: Participate in discussions and share trading cards for up to +90 daily
🔹 Creator bonus: Post designated token/trading card content for up to +300 per task
Gate VIP football jerseys, prediction market experience vouchers
BTC-0.57%
ETH+0.19%
HYPE-2.08%
  • 3
good luck!$BTC $NVDA
post-image
BTC-0.57%
NVDA+0.87%
Five consecutive intraday wins, long at 4383 exited at 4392, 1800🔪
In the end, trading isn't about technique, but the composure to remain calm. $XAU
post-image
XAU-0.60%
Nobody is talking about this LTC move hiding in plain sight.

$LTC /USDT - SHORT

Trade Plan:
Entry: 57.54 – 57.98
SL: 60.45
TP1: 55.74
TP2: 54.40
TP3: 52.39

Why this setup?
Why now? The daily trend is range-bound, but the 1h price at 57.76 sits right at the entry zone edge, and the 15m RSI at 68.42 shows momentum is still pushing higher into resistance. The 1h ATR of 0.861214 tells us volatility is compressed enough that a breakdown could be explosive. With a 77.4 confidence score on the SHORT bias from the 4h timeframe, the setup favors a move toward TP1 at 55.74 and TP2 at 54.40. The in
LTC+5.51%
Most traders are about to get blindsided by a hidden move in $SAMSUNG /USDT.

$SAMSUNG /USDT - SHORT

Trade Plan:
Entry: 199.90 – 200.38
SL: 202.45
TP1: 198.41
TP2: 197.25
TP3: 195.52

Why this setup?
Why now? The daily chart is range-bound, which usually traps directional traders, yet the 1h ATR of 0.961712 shows a volatility spike that is cracking the range open. The 15m RSI at 50.55 confirms the market is not overbought or oversold, leaving room for a decisive push. The 1h price of 200.14 sits at the entry zone of 199.90 to 200.38, which is the exact level where short sellers should init
SAMSUNG+1.17%
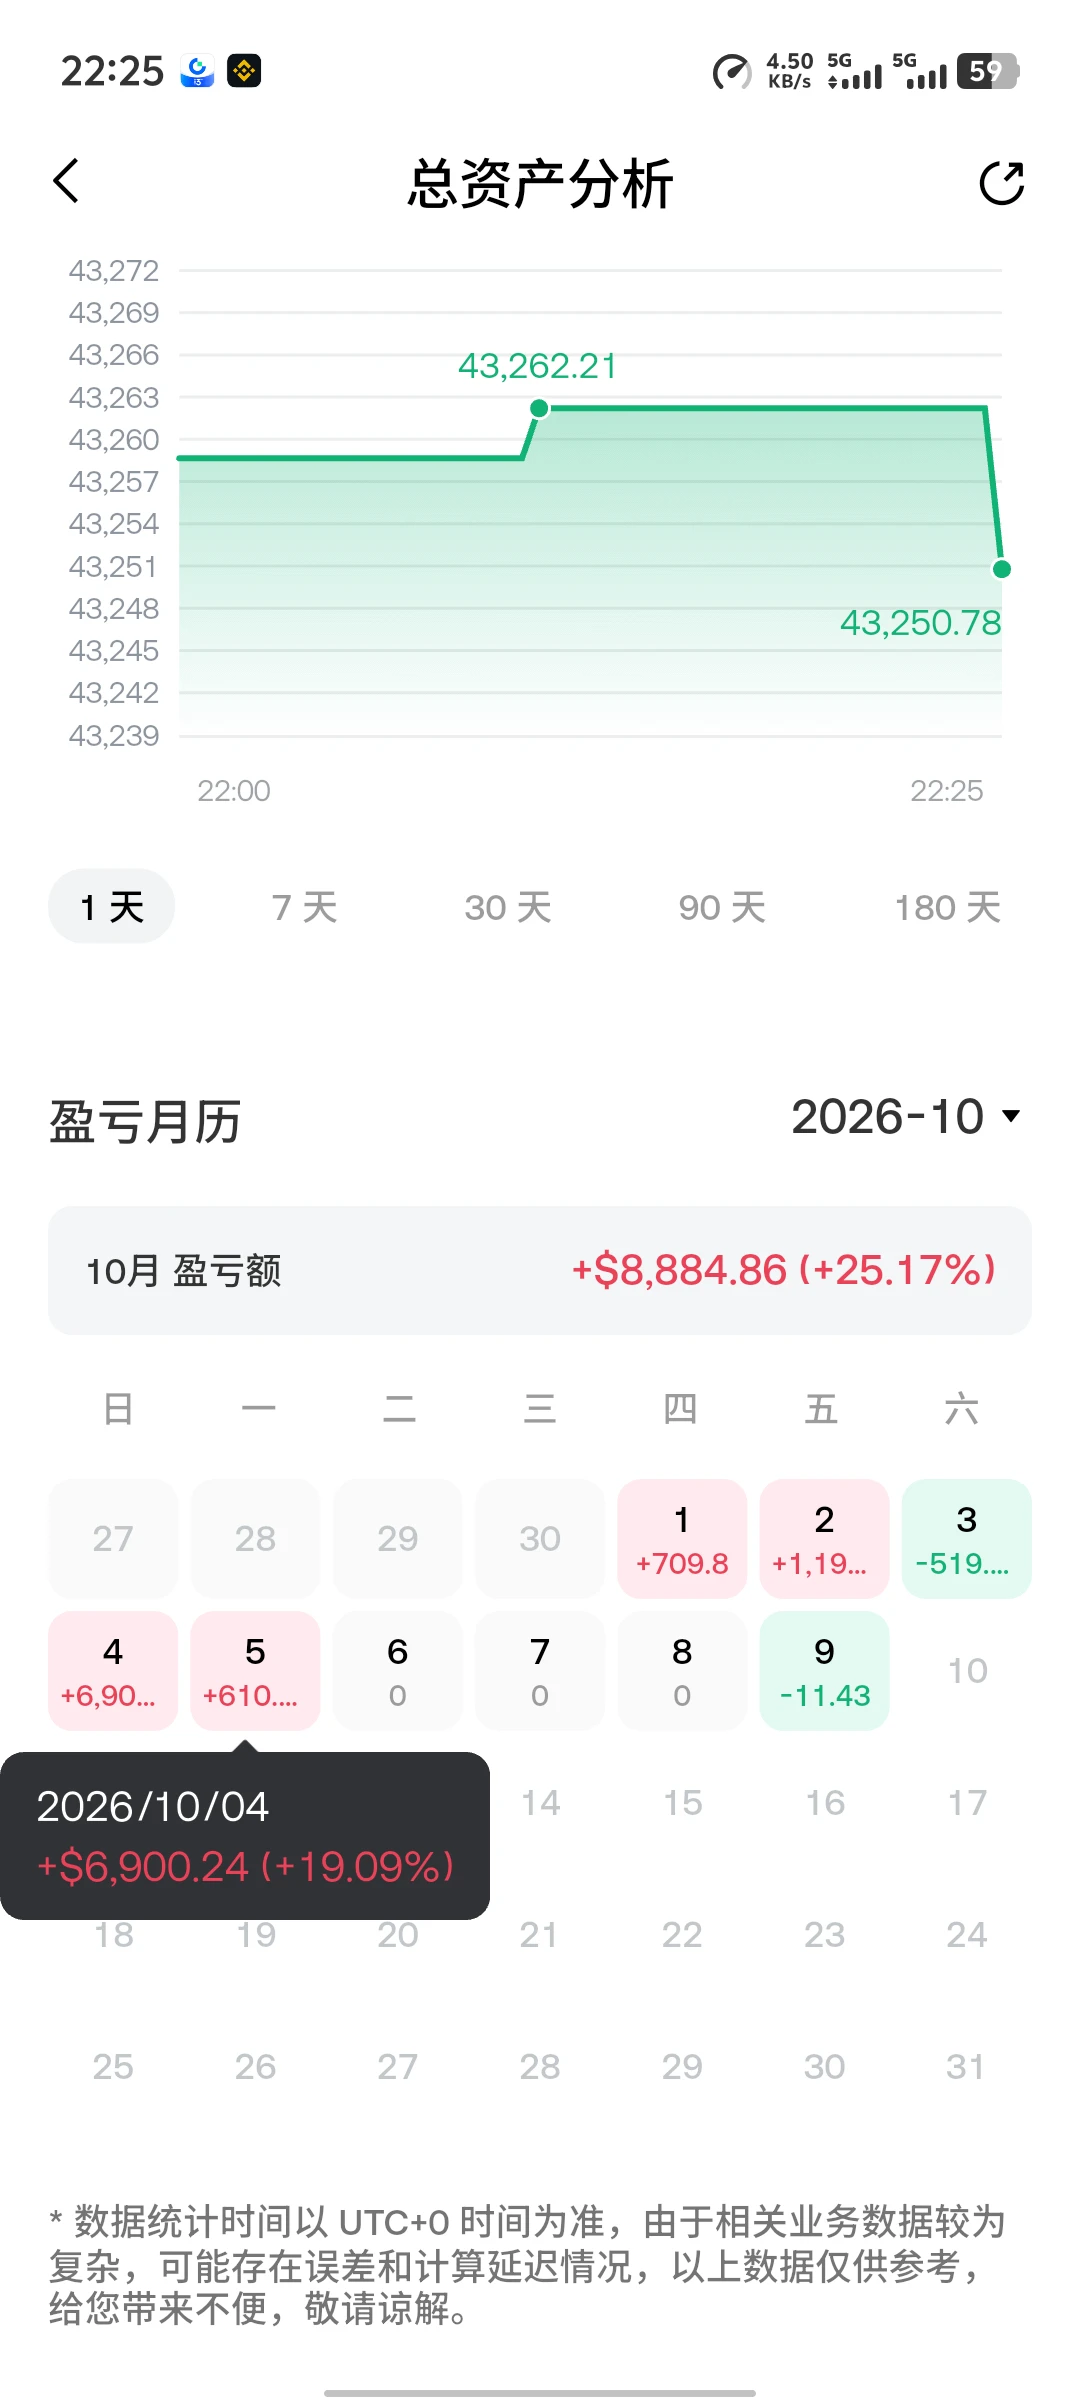
With this price action, I don't even need to think—the account is dancing on its own.
During the repeated intraday swings, the rebound looked lively, but volume failed to follow. I kept my eye on the key level above $SKYAI ; it tried to break through several times but fell just short, which was a classic bull-trap signal. Without hesitation, I placed a short order and waited for the pullback.
When I checked the chart again after lunch, the price had already slid to 0.0577. With an entry cost of 0.21986, the +1808.29% gave me the answer directly. This profit feels great; those who were already o
post-image
SKYAI-3.11%
XRP-0.96%
DOGE+1.41%
ZEC holds above $1,100—where will the shorts go?🚨
Can the bulls get in on the pullback?⛳️
Holding above $1,100, breaking through the four-digit mark in an instant—this isn’t a coincidence. It’s the whales making it clear: I’ve cornered the chips, and I call the shots on price.
The long-standing leader in the privacy sector has seen its open interest remain rock-solid after this rally, with practically no one exiting—the main players never intended to leave. Trading sideways? That’s just shaking you out before pushing higher.
What’s most exciting? The large-holder long-short ratio has fallen t
ZEC-0.16%
  • 5
🚨 $HEMI — THIS ZONE IS INTERESTING 👀🔥
HEMI has seen heavy volatility after the recent move, and price is now pulling back into a zone where I want to watch the reaction closely.
I’m keeping the targets close — no unrealistic moon targets. 🎯
🟢 ENTRY: $0.00870 – $0.00890
🛑 SL: $0.00840
🎯 TP1: $0.00905
🎯 TP2: $0.00920
🎯 TP3: $0.00935
If price holds the entry zone, these levels can be taken step-by-step.
If $0.00840 breaks, setup is invalid — protect the capital and move on.
No FOMO. No chasing.
Let the level come to you. 📊🔥
#GateLaunchesTrenchesWith0GasFee
post-image
HEMI-22.04%
  • 3
  • 1
The night session continues to 👀 rise—are you all long? #Gate上线打金狗限时免Gas费
BTC-0.56%
I was just about to go to the forum and rant, but then I saw my balance and thought, forget it—the market is always right. $LAB This time, I chose to side with the bears. It’s not stubbornness—the chart spoke for me.

While everyone else was running, I instead got on board around 4.25647. At the time, the chart looked like it was about to rebound, but every push upward fell just short, and the volume kept shrinking—the fake-pump flavor was so strong that getting in was all about catching the pullback.

Now at 0.07036, the +1936.45% profit is no longer a mirage—it’s real food money. The earli
post-image
LAB-2.96%
BNB-0.83%
ADA+1.42%
#GateIdleEarnAutoYieldUpTo3%
#Gate闲钱宝自动生息享3%年化
WHY LET IDLE USDT OR USDC JUST SIT THERE?
If you keep USDT or USDC in your Gate account while waiting for the next trading opportunity, Gate Idle Money offers an interesting way to put those idle funds to work.
Once enabled, eligible idle USDT or USDC can automatically earn interest with an annualized rate of up to 3%, without requiring you to lock the funds away.
THE SIMPLE IDEA
Sometimes we keep stablecoins in our account for hours, days or even longer while waiting for the right market setup.
During that time, the funds are simply waiting.
Gat
USDC+0.01%
  • 2
  • 1
Load More

Join 40 M users in our growing community

⚡️ Join 40 M users in the crypto craze discussion

💬 Engage with your favorite top creators

👍 See what interests you

View More