



Share your thoughts
placeholder
Article
$1000 to $100,000 Crypto Trade Challenge Today
live-cover
LIVE593
$MU /USDT is about to break range and crash 4% in hours

$MU /USDT - SHORT

Trade Plan:
Entry: 973.24 – 977.20
SL: 994.19
TP1: 961.00
TP2: 951.51
TP3: 937.29

Why this setup?
Why now? The 1h price sits at 975.22, a precise entry_ref inside the 973.24 to 977.20 zone, while the daily trend remains range-bound, setting up a sharp move. The 15m RSI at 43.0 confirms bearish momentum is still fresh, not yet oversold. The 1h ATR of 7.902302 means a single candle can cover the distance to TP1 at 961.00, and a second wave targets TP2 at 951.51. The invalidation level at 1005.10 is the line in the sa
MU-0.23%
Options Markets Price Bigger Swings! BTC and ETH Enter a High-Volatility Window
live-cover
LIVE742
Nobody is talking about the quiet move happening inside SYUIT right now.

$SUI /USDT - SHORT

Trade Plan:
Entry: 0.7268 – 0.7334
SL: 0.7620
TP1: 0.7061
TP2: 0.6902
TP3: 0.6662

Why this setup?
Why now? The daily trend is bearish, which sets the stage for a continuation move that most are still ignoring. The 1h ATR of 0.013306 shows the asset is expanding enough to fuel a serious leg down from the current 1h price of 0.7301. With the 15m RSI sitting at 43.13, momentum is still sliding without being overextended, meaning the short has room to run. The entry zone between 0.7268 and 0.7334 alig
SUI-1.90%
I had just switched the app to the background when it suddenly popped back up—are you playing hide-and-seek with me?

When I checked the chart after lunch, $SAFE was still spinning in place, with painfully light trading volume. But the sell orders were clearly thinning out; there was no volume to drive it down, while pushing it up was surprisingly easy. I've seen this rhythm far too many times—it’s not that it won’t move, the time just hasn’t come yet. My call at the time was simple: bullish, go long.

Then it took off. Entered at 0.08209, current price 0.09677, unrealized profit +177.49%. I
post-image
SAFE+0.74%
BNB+1.46%
ETH+2.90%
Pumpfun issued 194,000 tokens in one week, PUMP 24h -8.07%: The platform’s hot token price is cold
Good grief, the platform that issued 194,000 tokens in 7 days saw its own token fall first. Weekly DEX volume was $547.6 million and revenue was $5.73 million, while its flagship $PUMP is now at 0.00359, 24h -8.07%—I’m bearish in the short term, and any rebound is an opportunity to short.

The revenue goes into the platform’s pocket, while PUMP holders get not a penny; 194,000 new tokens flooded the market in one week, and competitors’ weekly volumes are also in the hundreds-of-millions range.
PUMP-6.88%
I had just switched the app to the background, and it suddenly dropped—are you playing hide-and-seek with me? This morning, when I opened the chart, $TOSHI was clearly under pressure at the highs, with insufficient buying support; the overhead pressure was suffocating. I said then to stay bullish and look for shorts at high levels—the timing was spot-on.

Hold as long as the trend remains intact; run if it breaks down. Don't fall in love with a stock.

From 0.0001166 to 0.0001131, the short position wasn't held in vain: +144.55%. That feels amazing. It dragged its feet at first, but the mov
post-image
TOSHI+0.62%
ETH+2.90%
XRP+0.32%
Insiders are quietly loading short positions on $XAU /USDT while the 1h price sits at 4358.21

$XAU /USDT - SHORT

Trade Plan:
Entry: 4353.25 – 4363.17
SL: 4405.82
TP1: 4322.50
TP2: 4298.70
TP3: 4262.99

Why this setup?
Why now? The daily trend is range-bound, which often precedes a sharp directional break, and the 1h ATR of 19.83796 confirms enough volatility to fuel a meaningful move. The 15m RSI at 47.88 shows the market is balanced, not overbought, so a short bias has room to breathe. The entry zone between 4353.25 and 4363.17 aligns with the 1h price of 4358.21, giving a precise refere
XAU+0.68%
After missing the first wave of the decline, I did not chase the short. I waited until $SUI rebounded to around 0.7630 and clearly weakened before entering the short, avoiding repeated wicks at a key level.
After entry, it moved sideways for a while, with no sign of the bulls taking the initiative to counterattack. The hourly moving averages gradually converged into a bearish alignment, while each rebound reached a lower level than the previous one. Before the moving-average structure turned bullish, I chose to continue holding the short.
The actual drop came faster than I expected, followed b
post-image
SUI-1.90%
BTC+0.14%
ADA-1.53%
Odds of rate hikes sit at 86%
September 16 is the most important day of the month.
The Fed is likely to make the first interest rate hike in the last 3 years.
Expect a volatile week ahead
post-image
🐋 WHALE WATCH : Looking at the current BTC sentiment I find it more noteworthy than scary.
Bearish + Very Bearish is taking up as much as 51% while Bullish + Very Bullish is only 28%. Neutral is 22%.
Personally I usually don't like FOMO when the majority is overly optimistic. On the contrary when sentiment tilts strongly toward pessimism like this I start paying more attention.
Of course bad sentiment doesnt mean BTC will bounce right away. But the market often has a familiar trick: when the majority has mentally prepared for a downside scenario the price chooses to make things difficult for
post-image
BTC+0.15%
I was just about to shut down my computer and go to sleep, but then it started putting on a nosedive, instantly jolting me awake.

A few days ago before bed, the rebound looked pretty aggressive, but the volume clearly failed to keep up, and every push higher was just short of breaking through. I opened a short directly around 0.008967, betting that this rebound was a bull trap—an upside move without conviction won’t go far.

When I opened the chart this morning, well, it gave me the answer outright. At 0.00686, the drop was even more decisive than I expected, and +462.65% in unrealized prof
post-image
ZEC+2.91%
BTC+0.14%
🚨 JUST IN: Citi now expects Fed Chair Kevin Warsh and the Federal Reserve to raise interest rates next week.
Most traders are ignoring the range trap forming in SYMBOL right now.

$DOT /USDT - SHORT

Trade Plan:
Entry: 1.041 – 1.053
SL: 1.104
TP1: 1.005
TP2: 0.976
TP3: 0.934

Why this setup?
Why now? The daily trend is range, which means the 1h price is coiling for a directional burst that has not yet hit the tape. The 15m RSI sits at 38.95, confirming that momentum has not yet flushed out weak hands and the short side is still under-accumulated. The 1h ATR of 0.023581 shows the current volatility envelope, so the entry zone between 1.041 and 1.053 is the precise compression band where smart short
DOT-7.98%
What is your top #Altcoin pick right now ⁉️
And which #Memecoin are you betting on next 🚀
👇👇👇
post-image
MEME+1.51%
MEMECOIN-12.23%
On this $BNB trade, I took profit near the target instead of chasing the final acceleration. Volume has clearly contracted, lowering the probability of another push higher; the biggest risk was watching unrealized gains go through another roller coaster ride.

Looking back at the entry logic: The price pulled back to the platform near 701.00, and the four-hour candle closed with a long lower wick, making the shift between bulls and bears fairly clear. I entered with a 30% position to test the waters and held after it stabilized.

During the rally, I originally planned to sell 70% first, but
post-image
BNB+1.46%
DOGE+0.18%
ZEC+2.91%
#ShareWeekly
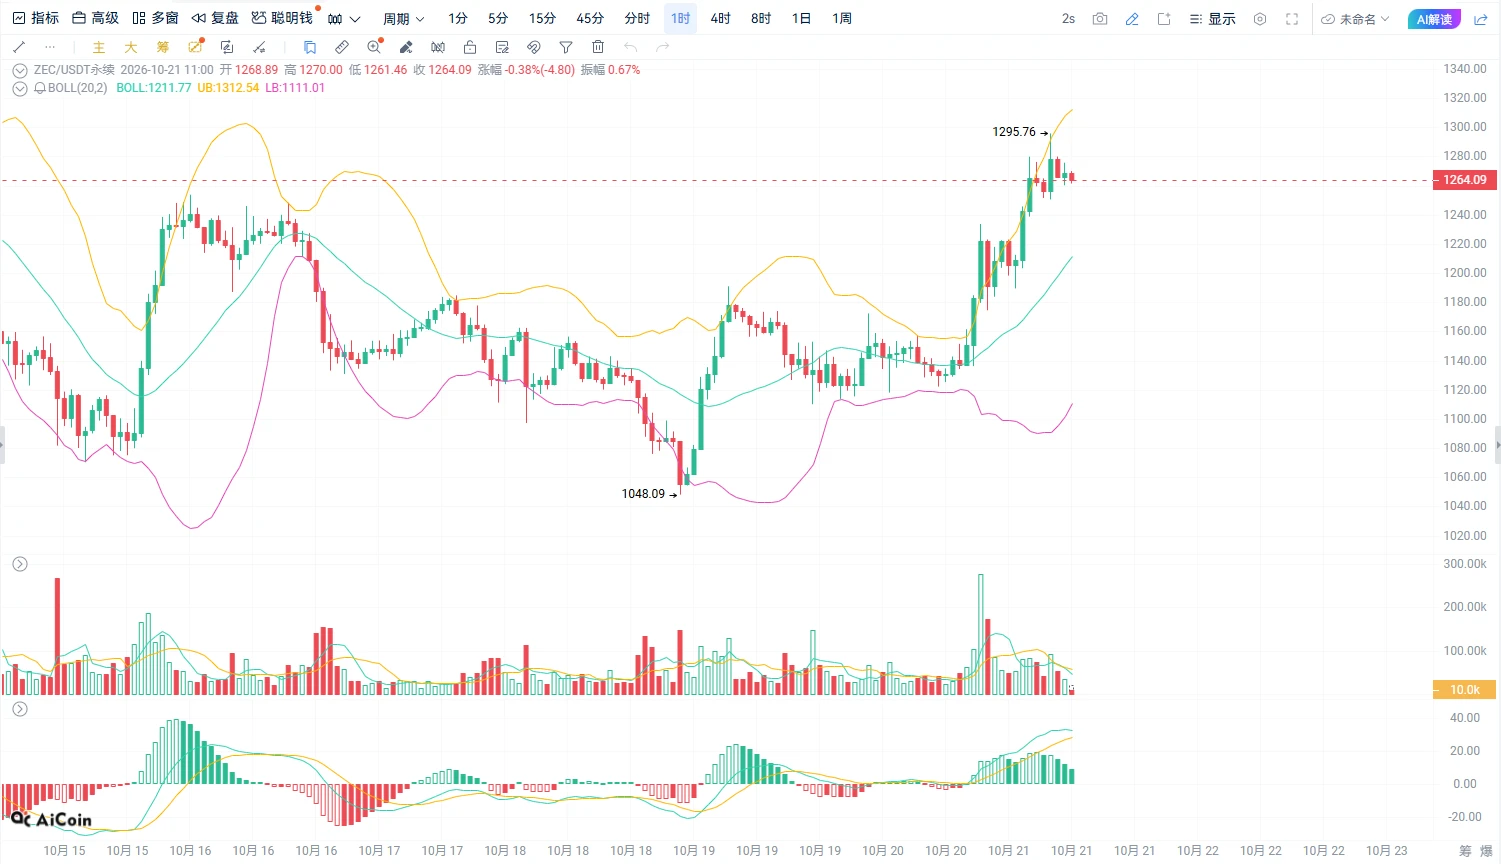
ZEC/USDT Daily Chart Analysis and Setup
Current Price: $1,180.65 (+4.46%)
Zcash has just experienced a massive, parabolic breakout. After consolidating for months around the $400 to $500 range, the price exploded to a local high of $1,297.00 before entering a sharp intraday correction. It is currently trading near $1,180.
Technical Indicators
The moving averages are in a perfect bullish alignment. The EMA5 sits at $1,146, the EMA10 at $1,086, and the EMA30 at $884. The price is trading well above all of them, confirming an extremely strong uptrend.
The Bollinger Bands are incredi
post-image
ZEC+2.91%
  • 11
$XAG /USDT is about to break range in a direction nobody expects

$XAG /USDT - SHORT

Trade Plan:
Entry: 64.31 – 64.55
SL: 65.59
TP1: 63.56
TP2: 62.98
TP3: 62.11

Why this setup?
Why now? The daily trend is range, which means $XAG /USDT has been trapped in a box and a decisive move is overdue. The 1h price is sitting at 64.43, right inside the entry zone of 64.31 to 64.55, giving us a precise trigger. The 15m RSI is at 48.96, showing the momentum is balanced but leaning bearish enough for a short setup. The 1h ATR of 0.484 tells us volatility is compressed, so a breakout from this entry are
XAG+1.52%
I originally wanted to cut my losses and sacrifice to the heavens, but the ritual never happened—the meat cooked itself.
A few days ago, $RE was still bottoming out in the afternoon. I kept watching RE’s order book, and that pullback held without breaking down. The bids underneath were solid, so there was no need to overthink it—just sit tight. I only gave one hint at the time: if it can’t fall any further, that’s the best signal.
The market eventually gave the answer. Entered at 0.40266, now at 0.4461, with paper gains of +211.4%. The earlier stagnation made me want to close the app, but onc
post-image
RE+3.21%
SNDK-3.32%
ZEC+2.91%
A few days ago, I nervously removed the stop-loss. Looking at it today, it feels like I narrowly escaped.
During the intraday bottoming phase, $MAGMA held firm after one pullback, while buy orders below kept replenishing. I only said at the time: Don’t add to shorts.
From 0.17163 to 0.24803, +880% is right there. Take profit on 80% first, and protect the remaining 20% at the entry price.
Being out of the market isn’t a sin; recklessly opening positions is the mistake. Setting up risk controls in advance is called rationality; cutting after taking a loss is called decisively sacrificing part t
post-image
MAGMA+5.55%
ADA-1.53%
DOGE+0.18%
Load More

Join 40 M users in our growing community

⚡️ Join 40 M users in the crypto craze discussion

💬 Engage with your favorite top creators

👍 See what interests you

View More