



Square
Following
Hot
News
Profile
Share your thoughts
placeholder
Article
$INJ is showing strong bullish momentum, breaking above $7.40 and moving toward the $7.56 resistance level. If it breaks through effectively, the uptrend may continue further.
Long entry price: $7.48 to $7.55 First target price: $7.65 Second target price: $7.80 Third target price: $8.00 Stop-loss price: $7.30 Wait for confirmation signals; if momentum weakens, avoid chasing the price higher. Buy and trade $STR
$SAN
post-image
INJ+9.74%
SAN+0.11%
Even with such little profit on my alt account, I can still make the leaderboard—how bad are the top players on it, really? 😂
post-image
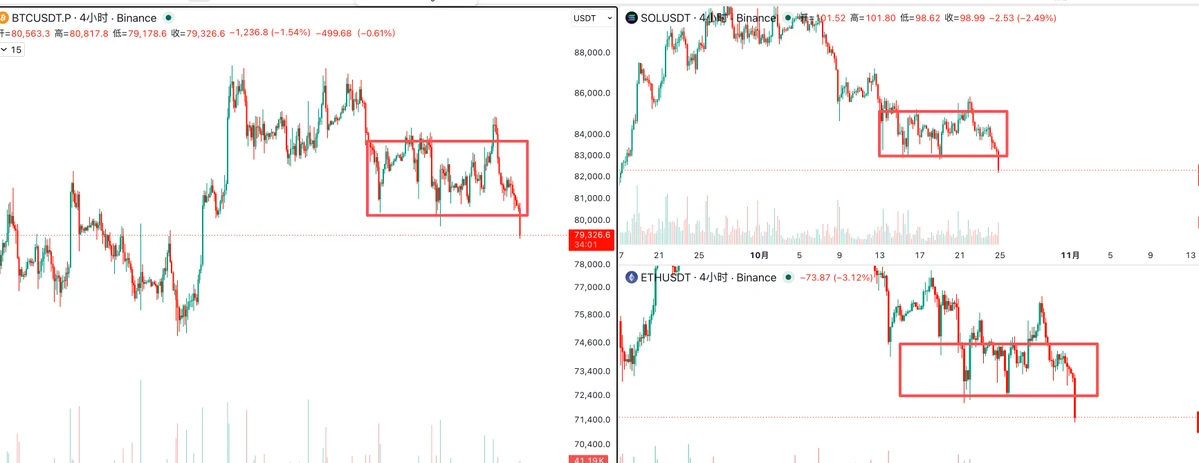
$BTC $ETH
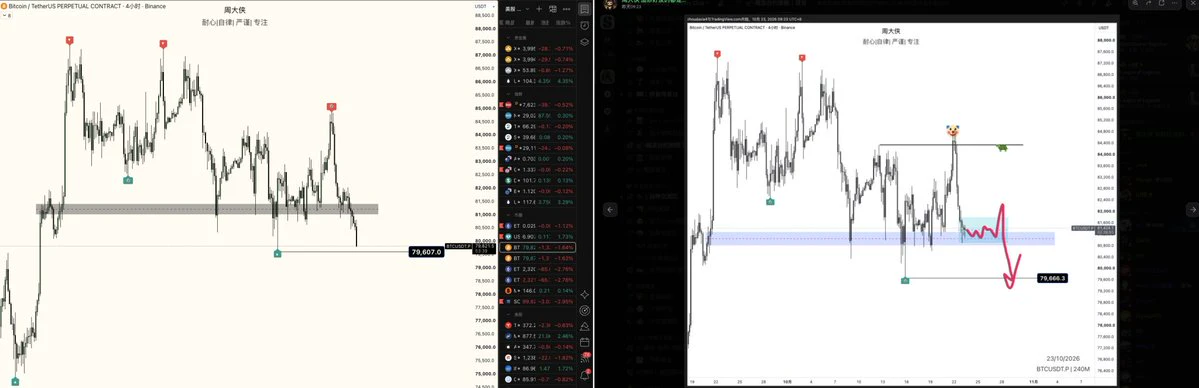
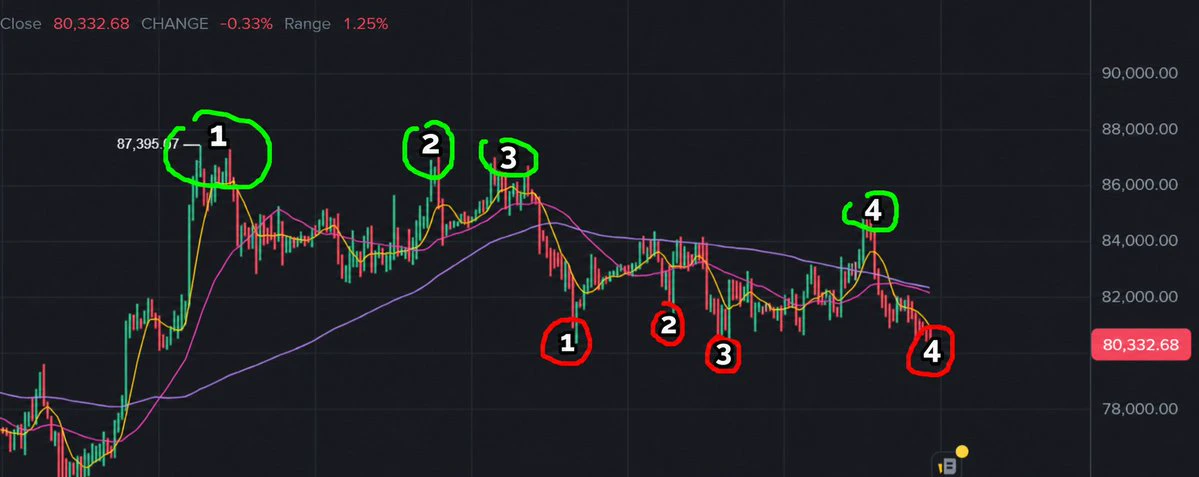
Tonight's livestream document—save it if needed.#BTC回调触及81000美元
post-image
BTC+0.59%
ETH+1.02%
  • 1
GM happy weekends
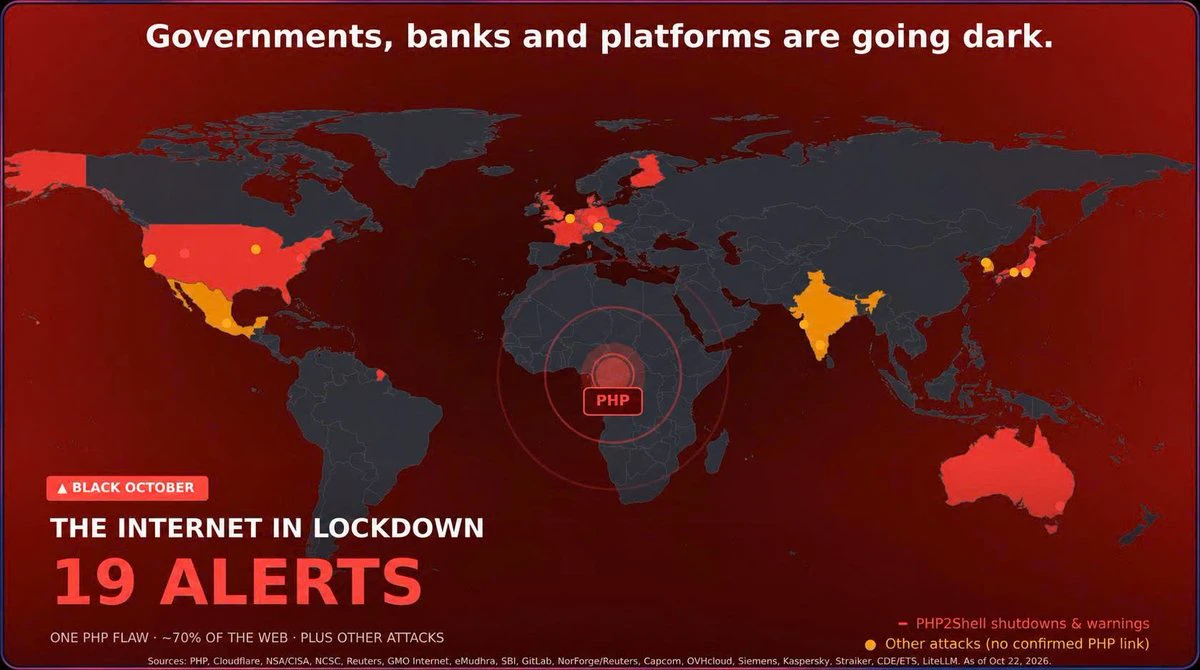
Why are they broadcasting our crypto losses on the streets to normies 😭
post-image
Found this at the end of a trail.
You’re welcome
post-image
$STRK STRK/USDT — Possible Wyckoff Distribution on the 1H
This range looks like potential Wyckoff distribution, with repeated tests of upper resistance around 0.075–0.077 followed by rejection.
The latest bounce could be another test of supply rather than the start of a sustained breakout. I’m watching whether price forms a lower high and returns towards support around 0.068–0.069.
A decisive break below that support, followed by a failed reclaim, would strengthen the distribution interpretation. A sustained breakout above resistance would weaken it.
Still developing—the wider structure and vo
post-image
STRK+40.08%
$BTC Bitcoin Weekly Shenanigans
Based on the current structure of the weekly Bitcoin chart, I believe price may continue ranging between $80,000 and $88,000 before eventually retracing down.
This outlook is supported by two key indicators:
Stochastic RSI: The indicator is currently overextended, suggesting momentum may be weakening and a potential reversal could be approaching.
Ichimoku Cloud: The cloud structure is approaching its end, a point that often precedes a major directional move. Based on the current setup and historical price behavior in similar conditions, this appears to be the mo
post-image
BTC+0.59%
$NEAR NEAR USDT - Technical Outlook | Oct 10
NEAR is trading at $5.014with over 5% gain in the last 24 hours.
Highlights on the Chart (4H):
After a sharp pullback to the $4.30level in recent days, a strong recovery has taken place. The price managed to bounce approximately 16% from the bottom.
We are at a technically important level:
Price has moved above MA5 ($4.852)and MA10 ($4.783).Now the MA30 resistance at $5.024is being tested. 4-hour closes above this level could strengthen the momentum.
Levels to Watch:
Resistance: $5.056(24h high) / $5.34/ $5.60Support: $4.85/ $4.63/ $4.30
The Order B
post-image
NEAR+13.00%
$LOFI Smashes Targets 💥🎯
1st Picture 📸
See how price action floated sideways?
This signals accumulation. 💯
2nd Picture 📸
In the 4hr timeframe we can see a falling wedge bullflag.
Falling wedges breakout to the upside 68% of the time.
It would appear that price action is looking to retest the yellow 4hr 200MA.
This is perfectly normal healthy price action.
$LOFI has had some really impressive moments to the upside lately.
$LOFI has been constantly working and building no matter the market conditions.
$LOFI Targets 🎯
1) $0.015875
2) $0.018716
3) $0.021158
4) $0.076846
Don't fade the Yeti
LOFI-0.10%
crypto market update
live-cover
LIVE1,676
What #memecoin has the strongest community?
Shill me👇
post-image
MEME+3.55%
#GateNetInflowRanks3rd
Gate's recent capital flow paints a significant picture regarding activity within the platform's user base. According to data compiled by independent platforms, Gate recorded a net inflow of $126 million over the past month. This places it third among global centralized exchanges. The same dataset indicates net inflows of approximately $22.38 million in the last 24 hours and around $138 million over the past seven days; in other words, there is a positive flow across all three timeframes.
These figures do not, in isolation, indicate a specific market direction. Net infl
post-image
GT+0.09%
  • 1
  • 1
$ERA Up 20.84% in 24 hours, it surged as high as 0.0912 before crashing back to 0.0779. Those who chased the rally are now sitting on nearly 15% unrealized losses. Trading volume was 161 million, so volume is not an issue, but the candlestick left a long upper wick, showing heavy selling pressure above 0.09.
At this level, it is stuck in the middle. My plan: accumulate in batches on a pullback to 0.072–0.075, with a stop-loss below 0.0642; exit immediately if it breaks below the daily low. The first take-profit target is 0.088, and the second is around the previous high near 0.091. Keep the po
ERA+20.84%
Last few days to sign up to @TxFlow_L1 before points go live.
I’ve had my eyes on $STRK for a while, but honestly, I didn’t expect to see it move like this today.
Over 20% up, around $0.09, and leading the gainers among the top 100 on @CoinMarketCap . That’s a move worth paying attention to.
I’ve always found Starknet’s technology interesting, especially the ZK rollup and Cairo ecosystem. But having solid tech and getting the market’s attention are two different things.
Now, I’m curious to see if this move has legs or if it’s just another short-term market rotation.
I’m not rushing to buy anything. I’d rather watch how the price behaves from here than ge
post-image
STRK+39.88%
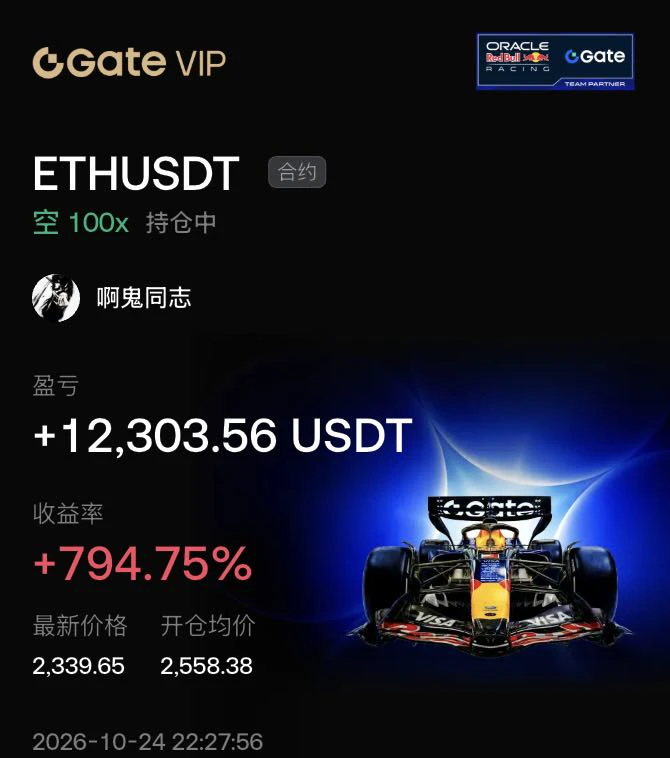
#晒出我的持仓收益 Fuck it to death…………………………
post-image
FOMC Super Meeting Night: Is the Fed Going to Raise Rates? How Will BTC Perform?
live-cover
LIVE247
$TURTLE TURTLEUSDT Forming Falling Wedge
TURTLEUSDT is forming a clear falling wedge pattern, a classic bullish reversal signal that often indicates an upcoming breakout. The price has been consolidating within a narrowing range, suggesting that selling pressure is weakening while buyers are beginning to regain control. With consistent volume confirming accumulation at lower levels, the setup hints at a potential bullish breakout soon. The projected move could lead to an impressive gain of around 20% to 30% once the price breaks above the wedge resistance.
This falling wedge pattern is typical
post-image
TURTLE+5.29%
$WLD Near Resistance: What Evidence Is Most Lacking for a Breakout
$WLD 24-hour +12.72%, current price 0.561, just 2.69% from the 1-hour resistance at 0.5761. Positions like this most easily create an illusion: briefly crossing above during the session is mistaken for a completed breakout. The answer that truly carries weight is whether it can hold after crossing.
Let’s pull the camera back to the 24-hour range: low 0.492, high 0.5761. Where does the current price of 0.561 sit within this range? That directly affects what the same signal means. Near the high, strength needs to prove it is not
post-image
WLD+13.96%
Load More

Join 40 M users in our growing community

⚡️ Join 40 M users in the crypto craze discussion

💬 Engage with your favorite top creators

👍 See what interests you

Trending Topics

GateAtTOKEN2049

39.7k Views21.53k Discussing

Gate brought a series of major events to TOKEN2049 Singapore! From the official launch of Gate Money to the F1 Red Bull driver meet-and-greet and the Gate Gala, we witnessed a new chapter of "One Gate, Borderless Finance." Which moment from TOKEN2049 stood out most to you?

LedgerLossesNear90Million

39.06k Views199 Discussing

GateWCTCS9GlobalTradingCompetition

33.57k Views4.88k Discussing

View More