
Share your thoughts
placeholder
Article
Weekly Macro Highlights: Nonfarm payrolls reignite expectations for Fed rate hikes, yen trading logi
live-cover
LIVE2,679
💫💫 BTC IS DEFENDING THE BREAKOUT - $83K IS BACK IN PLAY
BTC broke above $81K on Sept. 4
#BTCUSDT is holding near $79,500 after the sharp push above $81K and the latest pullback into the rising support structure. Price has already reacted from the $78,800-$79,000 area, and buyers are trying to build another leg higher. If this support continues to hold, the next recovery path points toward $81,500 first and then the major $83,000-$83,500 resistance.
U.S. spot BTC ETFs posted $730.8M in net inflows on Sept. 3 - institutional demand strengthened sharply again.
before cooling back toward support
BTC-1.47%
The latest ETF data has been updated! Here's an update for everyone!
Yesterday, $BTC had a net inflow of 174.6M
$ETH had a net inflow of 26.46M
The main ETF for both remains IBIT, from BlackRock.
post-image
BTC-2.35%
ETH-2.49%
IBIT-2.46%
BLK-0.37%
Why Prediction Markets Are Inevitable
If I had to choose one of the sectors most worth following over the long term in the next few years, I would put prediction markets on the list without hesitation. The reason is not how much attention prediction markets have recently received, nor is it because the U.S. presidential election once created a massive Prediction Market boom. Rather, I increasingly believe that what prediction markets are truly changing is not the form of betting, but the way humans deal with “uncertainty.”
Financial history has essentially always been doing the same thing: con
post-image
BTC-1.47%
TRUMP+0.99%
AAPL-2.51%
LMTS-1.83%
ETH-2.30%
SNDK SanDisk’s key support at 1510 has been emphasized repeatedly, with continued guidance to build long positions near 1510, while the market has also provided multiple opportunities to enter on pullbacks.

At noon today, SNDK took off strongly once again, with the price directly breaking above 1700 and reaching an intraday high of 1781. The previously given upside target of 1700 was achieved as expected, securing a solid 270-point move!

The opportunity is right in front of you; having the courage to enter is important, but you must also hold your position. Trade with the trend, and profit
SNDK+10.24%
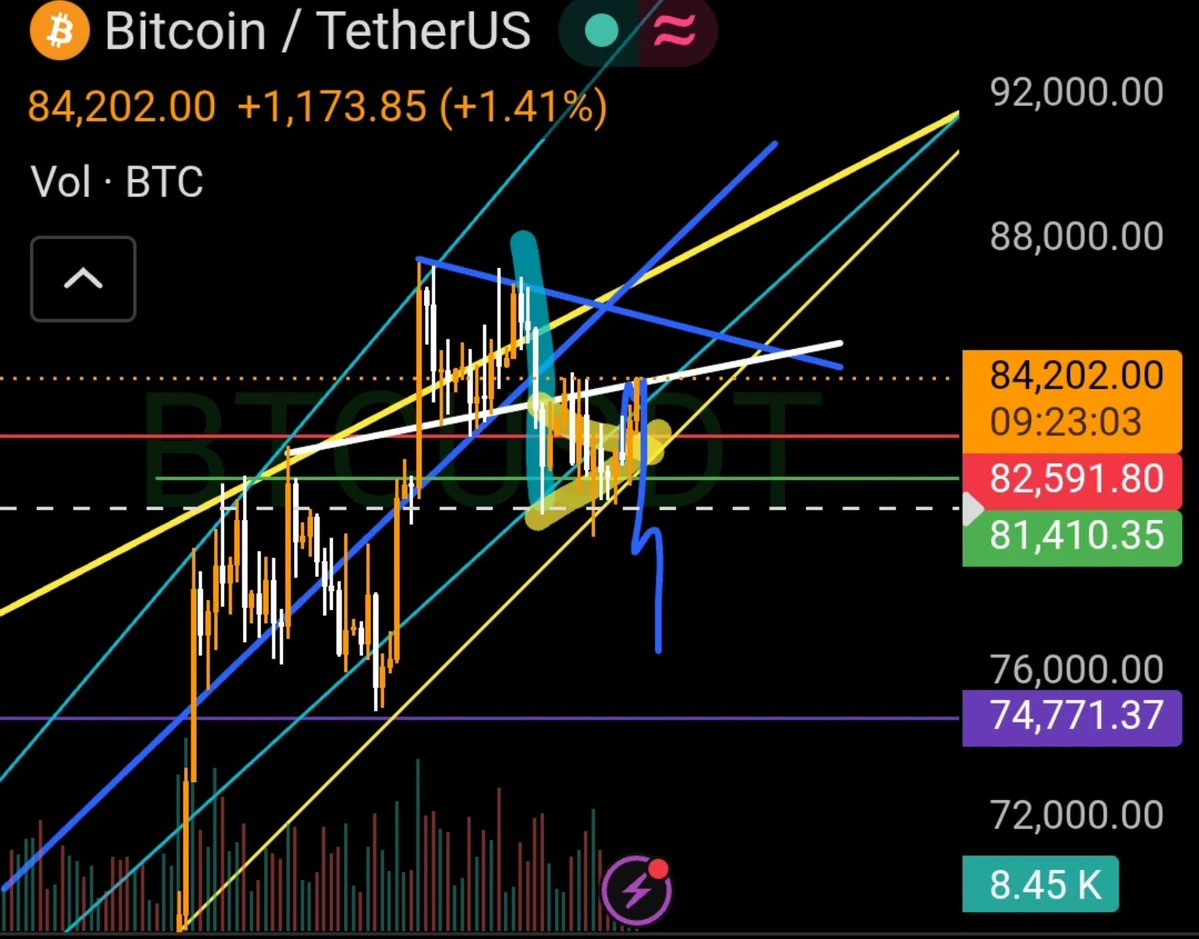
$BTC : It could be a quiet weekend. The key level to keep the white roadmap intact is $78,640.
A break below this level would shift the focus to $76,290.
One more high is still on the table, but keep in mind that a top could be near.
post-image
BTC-1.47%
$AXS help me help you GATEIO!!!! 😡😡😡🙏🏼🔥💵💵
#axs5l
post-image
AXS+1.14%
$XRP — -2.84%
XRP is down the most today at $1.4040, but the technical picture suggests this is a healthy pullback, not a reversal. The $1.3837 level held strong, proving demand is still there.
Support: $1.3837
Resistance: $1.4622
🎯 Target: $1.50+
🔥 Next Move: XRP needs confirmation above $1.45 to prove bulls are still in control. If that breaks, expect a run toward $1.50. The pullback is temporary.
💡 Pro Tip: Accumulate on dips to $1.38–$1.40. Risk-reward is heavily favored for upside here.
post-image
XRP-3.09%
9.5$ZEC Weekend Trading Suggestions
ZEC surged to around 1050 yesterday before quickly retreating to around 1013. On the 15-minute chart, bearish volume expanded; EMA7, EMA30, and the Bollinger middle band at 1020 have turned into resistance. The TD downside count has begun, and short-term momentum is weakening.
Fund flows have diverged, with 12-hour futures flows turning net negative and bullish momentum weakening! Spot inflows have slowed,
with heavy volume at the highs but no price increase, and clear signs of profit-taking. The 1030-1050 range above is a dense resistance zone, making rebo
post-image
ZEC+3.92%
$NET /USDT Perp – "Bearish Rejection – Short"**
**Trading Plan Short $NET
Entry: 277.50
SL: 278.80
TP1: 276.40
TP2: 275.50
NET is rejecting below the 278.7 yellow line and the EMA30 after spiking to 280.2. MACD is bearish; short the weakness and stop out above the recent 24h high resistance zone.
post-image
NET-1.74%
  • 3
  • 1
$MARSCOIN Signal】Long, positive funding rate + 1H sideways accumulation
$MARSCOIN Funding rate 0.0371% positive, OI moving sideways. 1H RSI 56.15, MACD histogram at -0.0041 in negative territory. Price at 0.1788, aligned with EMA20, while EMA50 is at 0.1477. 4H Bollinger Bands expanding, with the middle band at 0.1190 and lower band at 0.0210. Order book depth imbalance -4.10%, buy/sell depth ratio 0.92, with selling pressure slightly dominant; price has been reclaimed multiple times around 0.1760.
🎯 Direction: 【Long】
⚡ Entry/Limit Order: 【0.1782835 - 0.1788200】
🛑 Stop Loss: 【0.1770318】
post-image
MARSCOIN+67.68%
BTC-1.47%
ETH-2.30%
SOL-1.41%
#BTCPullbackto79000 🚨
BITCOIN PULLBACK TO $79,000 — CORRECTION OR NEXT BUYING OPPORTUNITY? ₿🔥
Bitcoin has entered another important phase after recently pushing toward the $82,000 area and facing strong selling pressure. The rejection from the highs brought BTC back toward the $79,000–$80,000 zone, putting this area directly under the spotlight for traders.
The latest move shows why chasing green candles can be risky. BTC can rally aggressively, but after a sharp move higher, profit-taking and leveraged-position liquidations can create fast pullbacks. Recent reports also linked the sell-off
post-image
BTC-1.47%
$GT — -0.70%
GateToken is showing the most stability today, barely bleeding despite broader market weakness. Trading at $8.52, GT's tight range between $8.27–$8.59 suggests accumulation phase.
Support: $8.27
Resistance: $8.59
🎯 Target: $9.00+
🔥 Next Move: The smallest 24H loss is actually bullish—smart money isn't panicking. Next breakout could target $9.00 quickly. Watch for volume confirmation.
💡 Pro Tip: Relative strength beats absolute strength. While others bleed, GT's resilience is a green flag for medium-term play.
post-image
GT+2.24%
monero:native 12H & 1H 👀
Trying to put a higher low inside support here.
Need to see a close above $541 now.
post-image
XMR0.00%
Everyone’s chasing WLD longs while the 15m RSI screams 70—who’s actually left to buy?

$WLD /USDT - SHORT

Trade Plan:
Entry: 0.3911 – 0.3935
SL: 0.4041
TP1: 0.3834
TP2: 0.3775
TP3: 0.3686

Why this setup?
Why now?
- 1D trend is *range*, not breakout—so momentum is a mirage.
- 4h bias flips SHORT with 55% conviction right as price taps 0.3923 resistance.
- ATR (1h) at 0.0049 means a tight squeeze—either we reject here or fake through.
- TP1 at 0.3834 is only a 2.2% drop, but TP2 at 0.3775 aligns with range lows.
- If 0.3839 invalidates, the alt scenario flips to 0.4012—so this lev
WLD+1.15%
afternoon updates with your host beatiful girl
live-cover
LIVE1,753
Jiujiang, Jiangxi Bride Price Loan
No need to worry about bride price expenses—borrow your way to steady happiness.
post-image
Everyone’s staring at $CL /USDT’s 91.05—but the real money is hiding beneath the range’s floor.

$CL /USDT - SHORT

Trade Plan:
Entry: 90.94 – 91.16
SL: 92.09
TP1: 90.27
TP2: 89.75
TP3: 88.97

Why this setup?
Why short now? The 4h signal says SHORT (55% confidence), and we’re stuck in a 1D range—that’s a compression zone. RSI on 15m is 52.68, not overbought, but ATR (0.43) shows volatility is thinning. When ranges tighten, breakouts fake out. Entry sits at 91.05 with TP1 at 90.27—a quick scalp. TP2 at 89.75 is where the range’s lower lip gives way. If 90.94 breaks, momentum shifts fast.

D
CL+0.74%
🔷️ K-Line & Structure Analysis of $CYS
​Current Trend: Short-term bearish impulse followed by horizontal range consolidation on the 15-minute timeframe.
​Candle Pattern: Sharp sell-off from 0.2492 down to 0.2368, followed by small-bodied candles (spinning tops/dojis) indicating lower selling pressure and base formation near local support.
​Moving Averages: Price is attempting to reclaim MA5 (0.2391) and MA10 (0.2390). MA30 (0.2422) acts as dynamic overhead resistance.
​Key Support Levels: 0.2368 (Local Support) | 0.2345 (24h Low)
​Key Resistance Levels: 0.2422 (MA30) | 0.2492 (Recent Swing
post-image
CYS-15.76%
#BTCReclaims80K
Bitcoin has reclaimed the 80,000 level for the first time in three days and is up more than 5 percent over the past 24 hours. The move has been supported by cooling rate-hike expectations and a wave of short liquidations. The open question is whether the next leg targets 82,000 or whether the market settles into range-bound consolidation.
On the 4-hour chart price is currently trading near 79,638 after testing 79,727. The 9-period MA sits at 80,061 and the 50-period MA is lower at 78,604. Bollinger Bands stretch from 76,032 on the downside to 82,416 on the upside, with the mid
BTC-1.47%
Load More

Join 40 M users in our growing community

⚡️ Join 40 M users in the crypto craze discussion

💬 Engage with your favorite top creators

👍 See what interests you

View More