


#ETHBrieflyFallsBelow2000 #ETHBrieflyFallsBelow2000 — Ethereum’s $2,000 Breakdown Puts $1,900 Support to the Test
Ethereum has entered another critical phase after losing the psychologically important $2,000 level. Trading around the $1,940 region in the latest market snapshot, ETH is facing renewed selling pressure, with its weekly decline approaching 12%.
The breakdown has weakened the short-term structure and shifted attention toward the $1,900–$1,875 support zone. The key question now is whether buyers can defend this area or whether sellers will push the market into another leg lower.
BEARS STILL CONTROL THE SHORT-TERM STRUCTURE
On the daily timeframe, Ethereum continues to display lower highs and lower lows, indicating that sellers remain in control.
The reported daily RSI near 25 suggests deeply oversold conditions. However, oversold does not automatically mean bullish. Strong downtrends can maintain weak momentum for extended periods.
For a genuine recovery, ETH needs more than a temporary bounce. Buyers must reclaim important resistance levels and establish a higher low.
KEY SUPPORT LEVELS
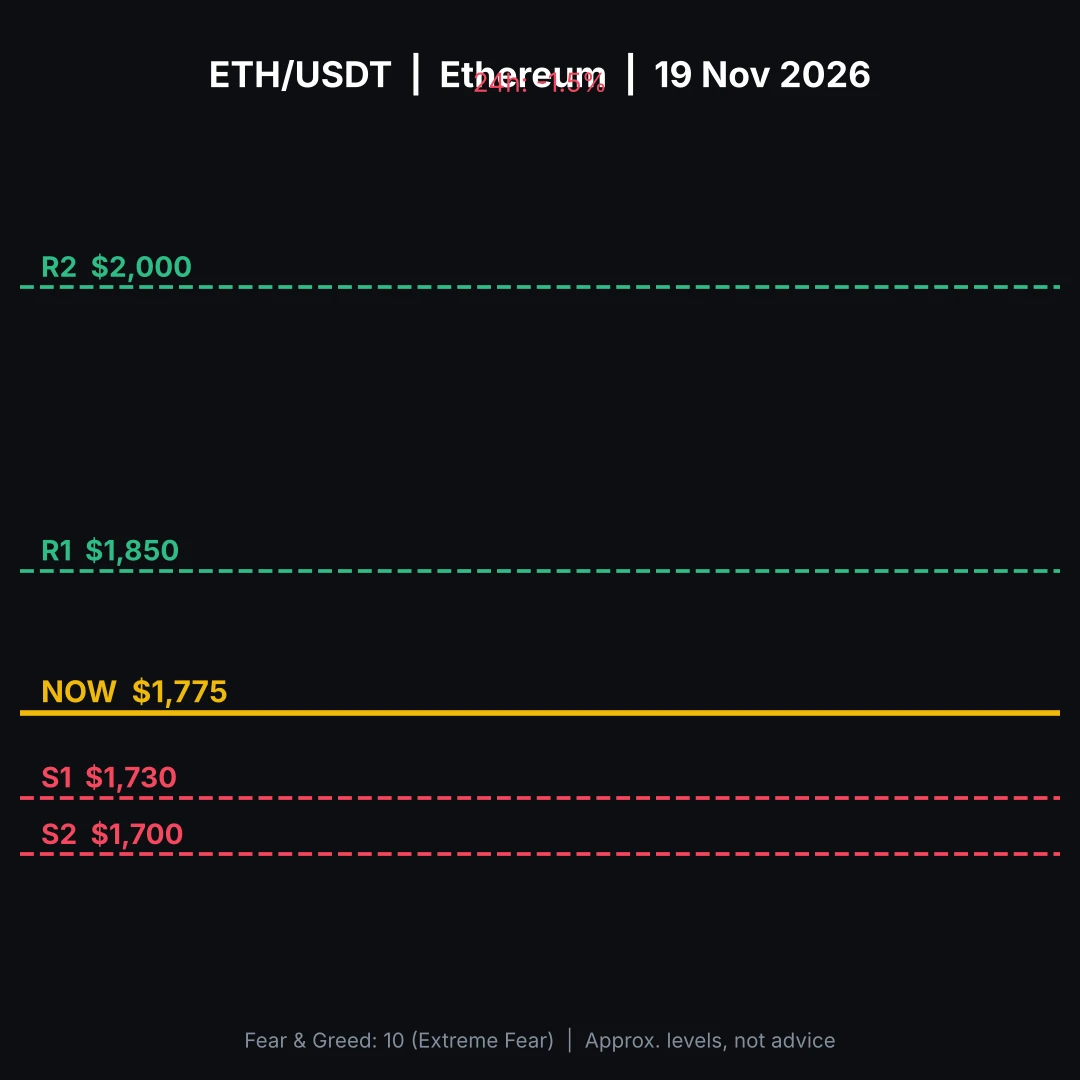
The immediate demand zone sits between $1,900 and $1,875.
If this region holds, ETH could attempt a short-term recovery. However, a decisive daily close below $1,875 would increase downside risk.
The next levels to monitor are:
• $1,850 — First downside reference.
• $1,830 — Additional support.
• $1,800 — Important broader support.
• $1,600 — A deeper correction scenario if selling accelerates.
RESISTANCE: WHERE BUYERS MUST RESPOND
The former $2,000 support has now become an important resistance area.
• $1,988–$2,000 — First recovery barrier.
• $2,020–$2,045 — Stronger confirmation zone.
• $2,100 — Next upside target.
• $2,250–$2,300 — Broader recovery resistance.
A sustained move above $2,045 would improve the short-term outlook. Until then, recovery attempts should be treated cautiously.
WHAT IS DRIVING THE SELLING PRESSURE?
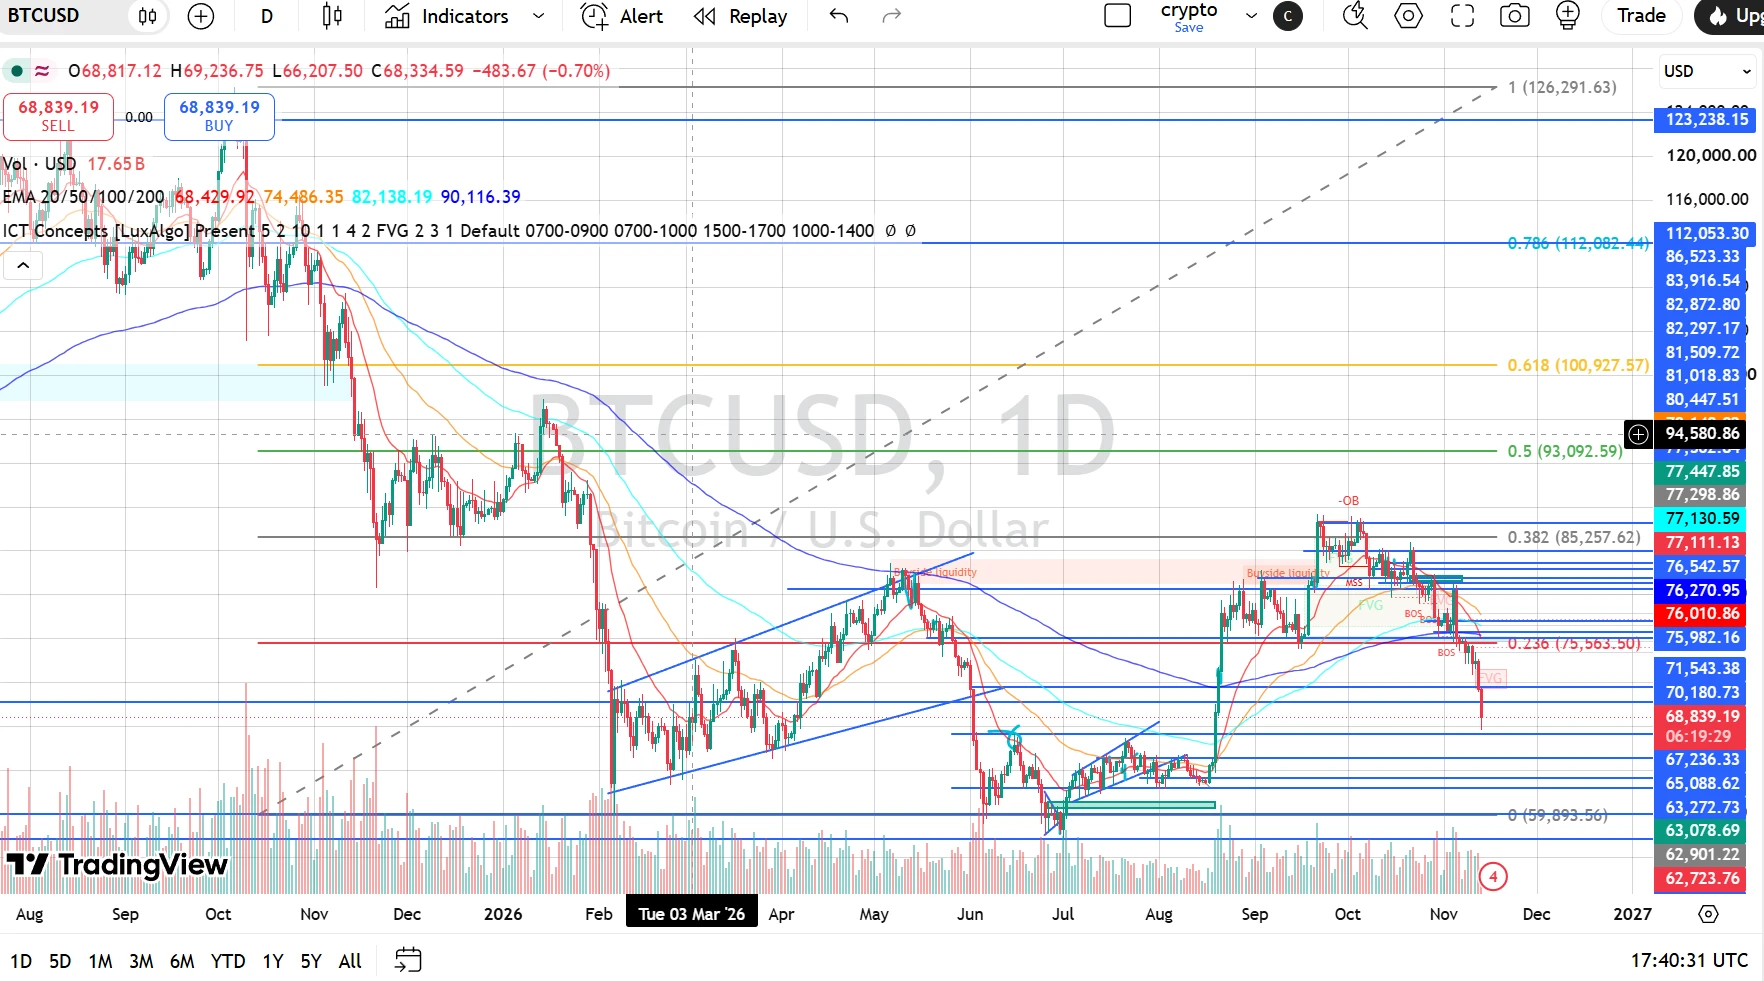
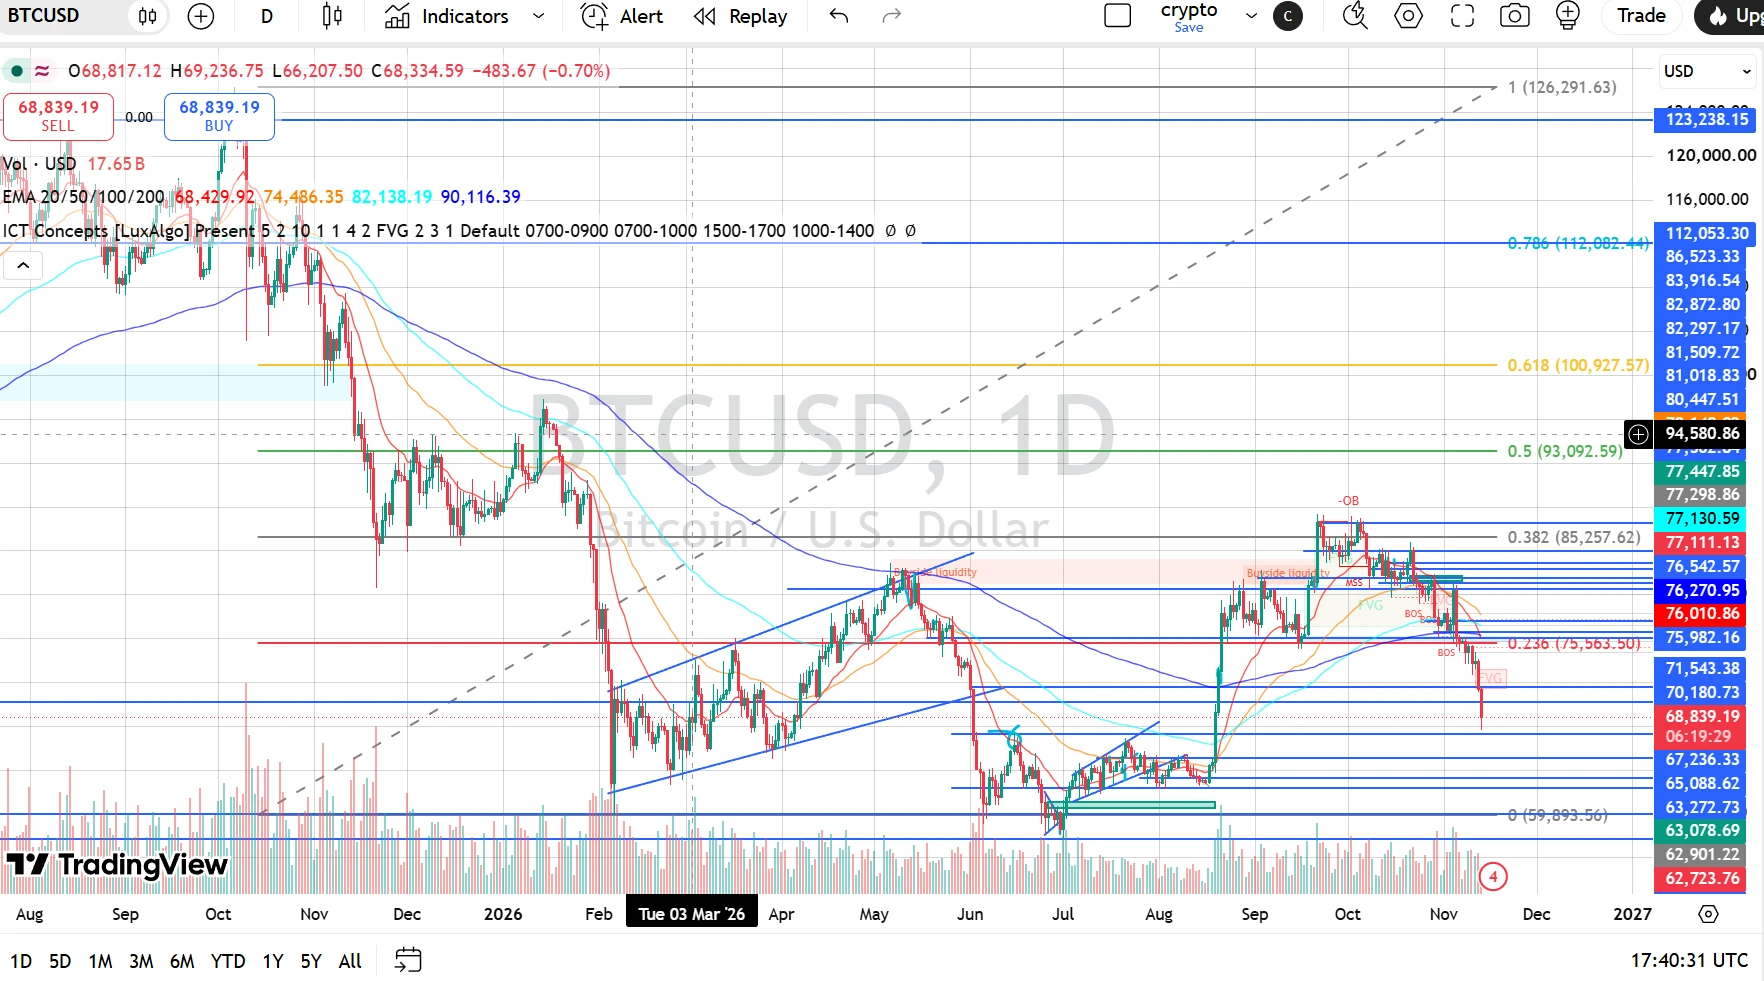
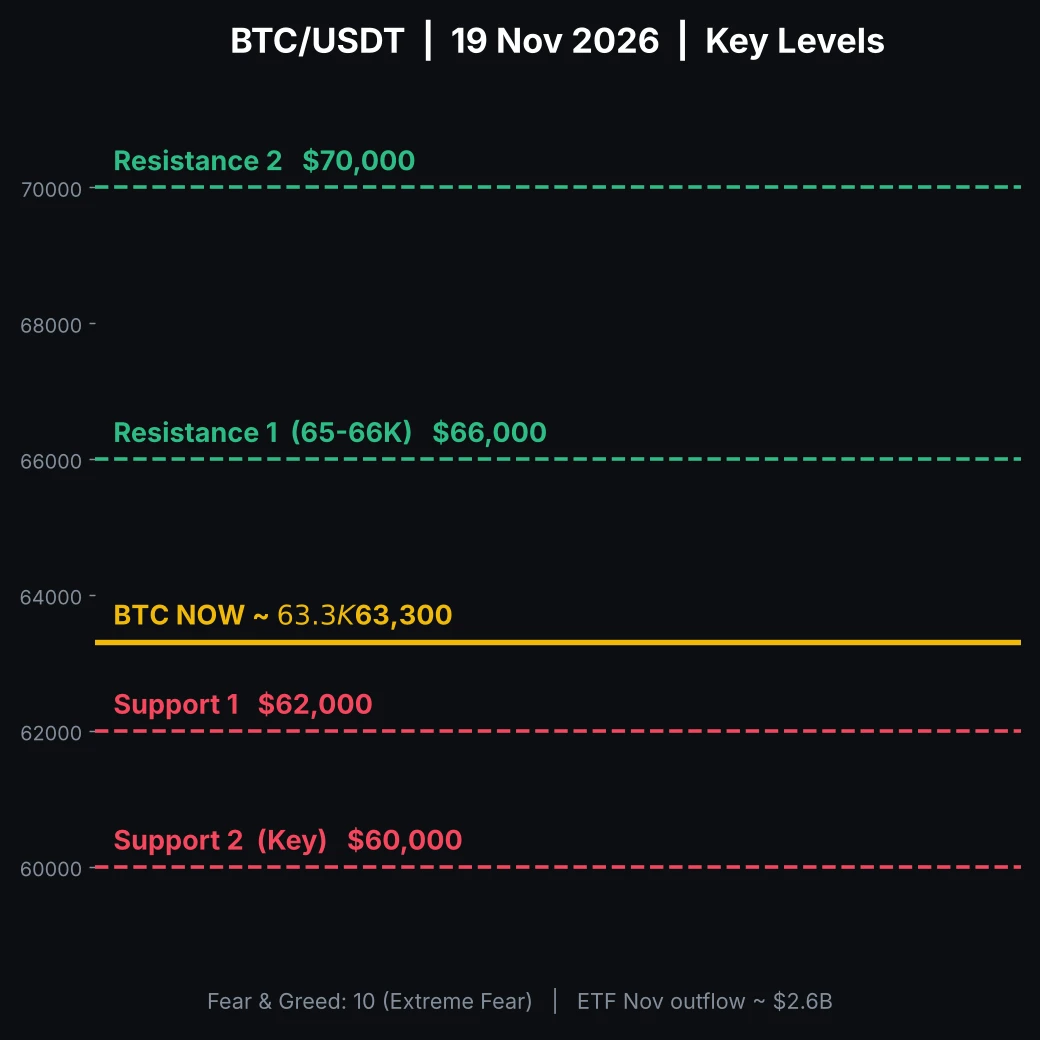
Ethereum's weakness is connected to broader market conditions. Bitcoin's decline, inflation concerns, and uncertainty around Federal Reserve policy have reduced risk appetite.
Institutional flows are also worth watching. US spot Ethereum ETFs recorded approximately $144.8 million in net outflows on November 11, extending their withdrawal streak to five trading sessions. Meanwhile, reported ETH liquidations near $250 million highlight how leveraged long positions can amplify market declines.
These factors add pressure to sentiment, although ETF flows and liquidations alone cannot determine Ethereum's next direction.
BULLISH VS. BEARISH SCENARIOS
Bullish scenario: ETH defends $1,900–$1,875, reclaims $2,000, and establishes support above $2,020–$2,045. This could open the way toward $2,100.
Bearish scenario: ETH loses $1,875 on a decisive daily close. That could expose $1,850, $1,830, and potentially $1,800.
MY MARKET OUTLOOK
The short-term trend remains bearish, but the market is approaching an important demand zone. This creates an environment where both continuation and a sharp relief rally are possible.
For traders, chasing an extended downward move can be risky. Confirmation matters more than emotion. Watch how price reacts around $1,900 and whether buyers can reclaim $2,000 with meaningful momentum.
Ethereum does not need one green candle to confirm a reversal. It needs a structural change: a higher low, stronger buying pressure, and a sustained break above resistance.
For now, $1,875–$1,900 is the critical downside zone, while $2,000–$2,045 is the recovery zone to watch.
$ETH $BTC $ETHBTC
DYOR
#Ethereum #ETHBrieflyFallsBelow2000 #ShareWeekly
Ethereum has entered another critical phase after losing the psychologically important $2,000 level. Trading around the $1,940 region in the latest market snapshot, ETH is facing renewed selling pressure, with its weekly decline approaching 12%.
The breakdown has weakened the short-term structure and shifted attention toward the $1,900–$1,875 support zone. The key question now is whether buyers can defend this area or whether sellers will push the market into another leg lower.
BEARS STILL CONTROL THE SHORT-TERM STRUCTURE
On the daily timeframe, Ethereum continues to display lower highs and lower lows, indicating that sellers remain in control.
The reported daily RSI near 25 suggests deeply oversold conditions. However, oversold does not automatically mean bullish. Strong downtrends can maintain weak momentum for extended periods.
For a genuine recovery, ETH needs more than a temporary bounce. Buyers must reclaim important resistance levels and establish a higher low.
KEY SUPPORT LEVELS
The immediate demand zone sits between $1,900 and $1,875.
If this region holds, ETH could attempt a short-term recovery. However, a decisive daily close below $1,875 would increase downside risk.
The next levels to monitor are:
• $1,850 — First downside reference.
• $1,830 — Additional support.
• $1,800 — Important broader support.
• $1,600 — A deeper correction scenario if selling accelerates.
RESISTANCE: WHERE BUYERS MUST RESPOND
The former $2,000 support has now become an important resistance area.
• $1,988–$2,000 — First recovery barrier.
• $2,020–$2,045 — Stronger confirmation zone.
• $2,100 — Next upside target.
• $2,250–$2,300 — Broader recovery resistance.
A sustained move above $2,045 would improve the short-term outlook. Until then, recovery attempts should be treated cautiously.
WHAT IS DRIVING THE SELLING PRESSURE?
Ethereum's weakness is connected to broader market conditions. Bitcoin's decline, inflation concerns, and uncertainty around Federal Reserve policy have reduced risk appetite.
Institutional flows are also worth watching. US spot Ethereum ETFs recorded approximately $144.8 million in net outflows on November 11, extending their withdrawal streak to five trading sessions. Meanwhile, reported ETH liquidations near $250 million highlight how leveraged long positions can amplify market declines.
These factors add pressure to sentiment, although ETF flows and liquidations alone cannot determine Ethereum's next direction.
BULLISH VS. BEARISH SCENARIOS
Bullish scenario: ETH defends $1,900–$1,875, reclaims $2,000, and establishes support above $2,020–$2,045. This could open the way toward $2,100.
Bearish scenario: ETH loses $1,875 on a decisive daily close. That could expose $1,850, $1,830, and potentially $1,800.
MY MARKET OUTLOOK
The short-term trend remains bearish, but the market is approaching an important demand zone. This creates an environment where both continuation and a sharp relief rally are possible.
For traders, chasing an extended downward move can be risky. Confirmation matters more than emotion. Watch how price reacts around $1,900 and whether buyers can reclaim $2,000 with meaningful momentum.
Ethereum does not need one green candle to confirm a reversal. It needs a structural change: a higher low, stronger buying pressure, and a sustained break above resistance.
For now, $1,875–$1,900 is the critical downside zone, while $2,000–$2,045 is the recovery zone to watch.
$ETH $BTC $ETHBTC
DYOR
#Ethereum #ETHBrieflyFallsBelow2000 #ShareWeekly