Share your thoughts
placeholder
Article
JUST IN: Rumors swirl around DeepMind and RSI (Recursive Self-Improvement) as AI chatter spikes; no verifiable evidence yet. If true, full self-improving AI cycles could redefine tech timing and investment sentiment. $AI?
post-image
today update 🥰🌹
live-cover
LIVE1,946
$RIVER In 24 hours, it surged from 1.0140 to 1.4060, with 74.8M in trading volume and a 28-point range—this isn't a pump, it's a short-seller meat grinder.
In the 6th to 12th months after the past three halvings, small-cap, high-volatility coins have followed this script: first a wick that blows out shorts, then range-bound attrition, and finally acceleration. At 1.3710, the price is right at the upper edge of the 4-hour chip concentration zone.
My trading logic is simple—don't chase highs; wait for a pullback. Scale in between 1.28 and 1.30, with the position capped at 15% of total capital,
RIVER+33.77%
USDT.D rejected from 7.12% supply and dropped into 6.87% demand. A relief bounce toward 7.05–7.10% could pressure BTC and alts, but another rejection may target 6.73%. A breakdown there would strengthen bullish momentum across crypto markets. Manage risk, trade levels.
post-image
BTC+0.68%
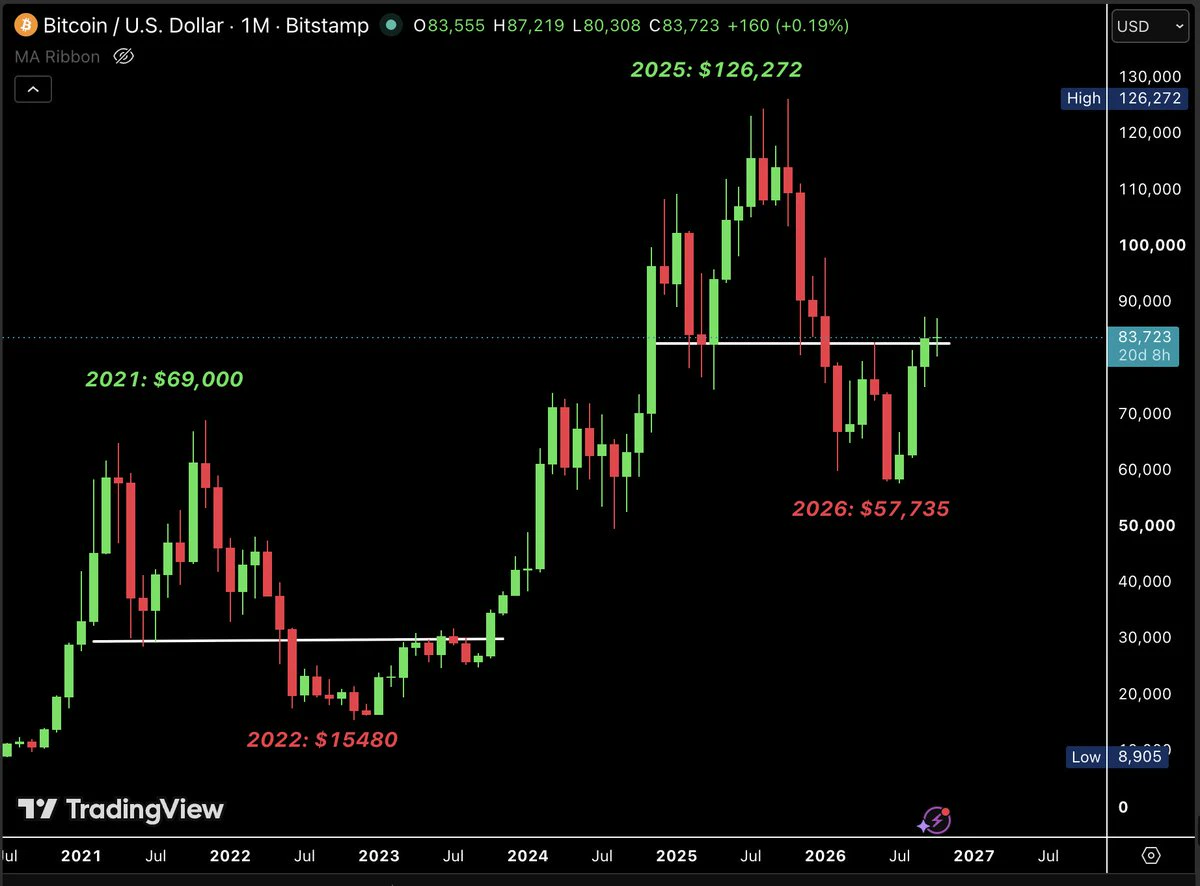
CPI news delivered a major move in both directions, but the bigger picture is still worth watching.
Bitcoin could still revisit the $69K area, especially with major events ahead:
• Clarity Act outcome
• FOMC meeting
The $69K zone has strong confluence. The inverse Head and Shoulders retest, 200-week EMA, previous ATH support, and the FVG are all lining up around this level.
Trade Setup: LONG from support
Entry Zone: $69,000–$70,500
Stop Loss: Below $67,500
TP1: $74,000
TP2: $78,000
TP3: $81,000
A clean hold above the $69K support zone could set up a strong move toward higher resistance levels.
post-image
BTC+0.66%
JUST IN: launches pre-market trading contracts for OpenAI and Anthropic with up to 5x leverage via Lighter, tracking private-company valuations rather than equity. If liquidity expands, watch for increased volatility in AI-themed plays. $OPENAI $ANTHROPIC
post-image
OPENAI+3.09%
ANTHROPIC+3.23%
Rate cut scam? $ETH surged to 2666 before a sudden “guillotine” appeared! Retail investor survival guide—read now!
Don’t trust the news; the K-line is the market makers’ trump card!
The Fed’s mouthpiece bluntly said that “one rate cut cannot solve the problem.” Macroeconomic expectations have fallen short, intensifying the capital battle. Looking at the ETH 1H chart, it flash-crashed from 2666 to 2512! Funds are fleeing wildly on the 1H/4H charts, with MA99 becoming the last line of defense. 2600 overhead has become an impassable barrier.
Trading suggestions:
Short lightly if a rebound to 258
ETH+2.85%
I switched to the background to reply to a message, and when I came back, it had already finished the job. While checking the market after lunch, $PRL faced heavy sell-side pressure, trading volume was low, and there was clearly resistance overhead, so I indicated that shorts could watch for support.
PRL was pressed down from 0.33936 to 0.11534, with +1299.19% locked in—the short position paid off, and the timing was spot-on.
Close 80% first, and protect the remaining 20% at breakeven. Let the profits run if it keeps falling, but don't give them back on a rebound.
Hold as long as the trend re
post-image
PRL+3.99%
DOGE+1.36%
BTC+0.66%
$MINA Signal】Long + 4H upper-band resistance, positioning for a short squeeze under negative funding
$MINA The 4H Bollinger upper band at 0.1065 has repeatedly capped the price, with the current price at 0.10626 running along the edge. The 1H MACD histogram at 0.0004 continues to contract, while the 4H histogram at 0.0012 is still expanding, showing momentum divergence between the two timeframes. The order-book buy/sell ratio is 0.92, depth imbalance is -4.15%, and sell orders are one level thicker than buy orders. The funding rate is -0.0688%, OI is stable, and short holding costs are accumu
post-image
MINA+16.71%
BTC+0.68%
ETH+2.89%
SOL+2.72%
Convert Advanced Season: Climb the Leaderboard and Earn Up to 1,000 USDT https://www.gate.com/campaigns/6163?ref=UFRFAQ0M&ref_type=132
post-image
  • 2
I saw the private message too
Because it was in the spam folder
I normally can't see it there = =
post-image
76,800 entry, 80,000 chase, 75,000 defense—this -2-degree trade, three numbers lay out an entire strategy.
His logic is: 76,800 is the daily-chart bottom; holding it makes it a short-term dip-buying point, while breaking below turns into a two-day-chart-level correction. For defense, he doesn’t place it at 76,800, but at 75,000.
This is the level I agree with most: a one-level difference determines whether you can withstand a fake drop. These details are the threshold for making my list.
His real bet is 80,000: breaking above it will accelerate the move, with a target of 81,800 to 85,000. What
post-image
BTC+0.68%
Onchain Lens monitoring shows that a trader profited $235,000 through PONS over 9 days. The trader bought 1.497 million PONS with approximately 378.23 ETH ($936,000) and sold all of it for about 473 ETH ($1.17 million), earning 94.77 ETH ($234,800), a return of 25.06%.
post-image
PONS+0.22%
ETH+2.89%
$ZEC is showing a pullback after a strong move up from the 1,054 area. Price is now around 1,138.85, sitting near the recent support zone.
📍 Entry Zone: 1,125 – 1,140
🎯 TP1: 1,160
🎯 TP2: 1,185
🎯 TP3: 1,205
🛑 Stop Loss: 1,105
Setup: I’d prefer to see bullish rejection and a reclaim of 1,145–1,150 before entering aggressively. If that level is recovered with momentum, the next liquidity areas are around 1,185–1,205.
⚠️ If ZEC loses 1,105, the long setup is invalidated. Manage leverage and risk carefully—don’t chase the move.
Plan the trade. Respect the SL. Let the market do the rest. 🧠📈
post-image
ZEC+7.12%
Why is everyone suddenly watching SYMBOL at exactly 2.3591?

$NEAR /USDT - LONG

Trade Plan:
Entry: 2.3423 – 2.3759
SL: 2.1976
TP1: 2.4802
TP2: 2.5609
TP3: 2.6820

Why this setup?
Why now? The daily trend is bullish and the 1h price sits at 2.3591, which is also the entry reference, meaning institutional levels are aligning with a fresh long setup. The 15m RSI is at 37.11, showing the asset has just exited oversold territory and is ready for a rebound. Meanwhile the 1h ATR of 0.06728 tells us volatility is compressed enough to justify a bold entry zone between 2.3423 and 2.3759. With a 95%
NEAR-0.45%
$MITO Signal】Long + 1H order-book support, 4H momentum recovery
$MITO 1H RSI 62.01, order-book bid-to-ask depth ratio 1.70, with active bids around 0.0140.
🎯Direction: Long
⚡Entry/Limit order: 0.014058 - 0.014100
🛑Stop-loss: 0.013959
🚀Target 1: 0.014312
🚀Target 2: 0.014417
🛡️Trade management:
- Execution strategy: Reduce the position by 50% after reaching Target 1 and move the stop-loss up to breakeven. If the price falls back to the entry level, exit automatically to protect the principal.
Depth logic: 4H RSI 46.38 remains below the midpoint, while 1H RSI 62.01 has turned upward first.
post-image
MITO+11.37%
After placing the $FLORK short order, I stopped watching the market constantly to avoid being shaken out by minor fluctuations. I entered only after the price returned to the key level, with the protective stop not set too far away. The idea was simply to wait for the price to move lower.

The core judgment behind this trade was that the rebound’s volume had dried up: the price reached near the previous high but failed to hold, and the moving averages did not turn bullish again. I don’t think the bearish thesis has run its course; on the contrary, the bearish option is still on the table.

T
post-image
FLORK-3.39%
ETH+2.85%
SNDK-2.50%
A Brief Analysis of BTC’s Short-Term Trend from Dow Theory, Chan Theory, Elliott Wave Theory, Volume-Price Relationships, Order Flow, and Price Action
I. Dow Theory
Primary trend (1-hour): The primary uptrend since the August 14 low of 62,484 has undergone its most critical test of this cycle. On September 11, the four-layer support defense (76,200-76,900) held successfully on its fourth test—after probing down to 76,173 in the early morning, the bulls launched an epic counterattack, driving the price from 76,173 to 79,748 on heavy volume in a single day, closing at 77,216 (an intraday range o
BTC+0.68%
CPI JUST MADE THE FED’S NEXT MOVE A LOT MORE INTERESTING.
The market was hoping for a clear path toward rate cuts.
But the latest inflation data didn’t give traders that comfort.
#ShareWeekly #weeklyshare
August CPI increased 0.4% from the previous month, while yearly inflation reached 3.4%. Core CPI also rose 0.3% month-over-month, coming in hotter than the 0.2% expected.
That might sound like a small difference.
For markets, it isn’t.
The Fed wants inflation moving closer to its 2% target before it can comfortably lower rates. A stronger CPI number gives policymakers another reason to stay
post-image
LAB+67.14%
LSK+51.24%
Load More

Join 40 M users in our growing community

⚡️ Join 40 M users in the crypto craze discussion

💬 Engage with your favorite top creators

👍 See what interests you

View More