Square
Following
Hot
News
Notifications
Profile
Share your thoughts
placeholder
Article
JANE STREET AND BITCOIN — WHO REALLY MOVES THE MARKET?

Institutional ETF Holdings Raise Questions About Bitcoin Market Influence

CRYPTO INSIGHT ID
RESEARCH • ANALYSIS • MARKET INTELLIGENCE

MARKET OVERVIEW

Jane Street is attracting attention after reporting approximately $1.79 billion in holdings across three Bitcoin ETFs as of September 30, 2026.

The disclosure has renewed discussions about the growing influence of institutional players in the Bitcoin market.

WHAT DOES THE DATA SHOW?

* ETF Holdings: Reported positions increased from approximately $926 million in Q2 to $1.79 billion in Q
BTC-3.45%
#XAU/USDT
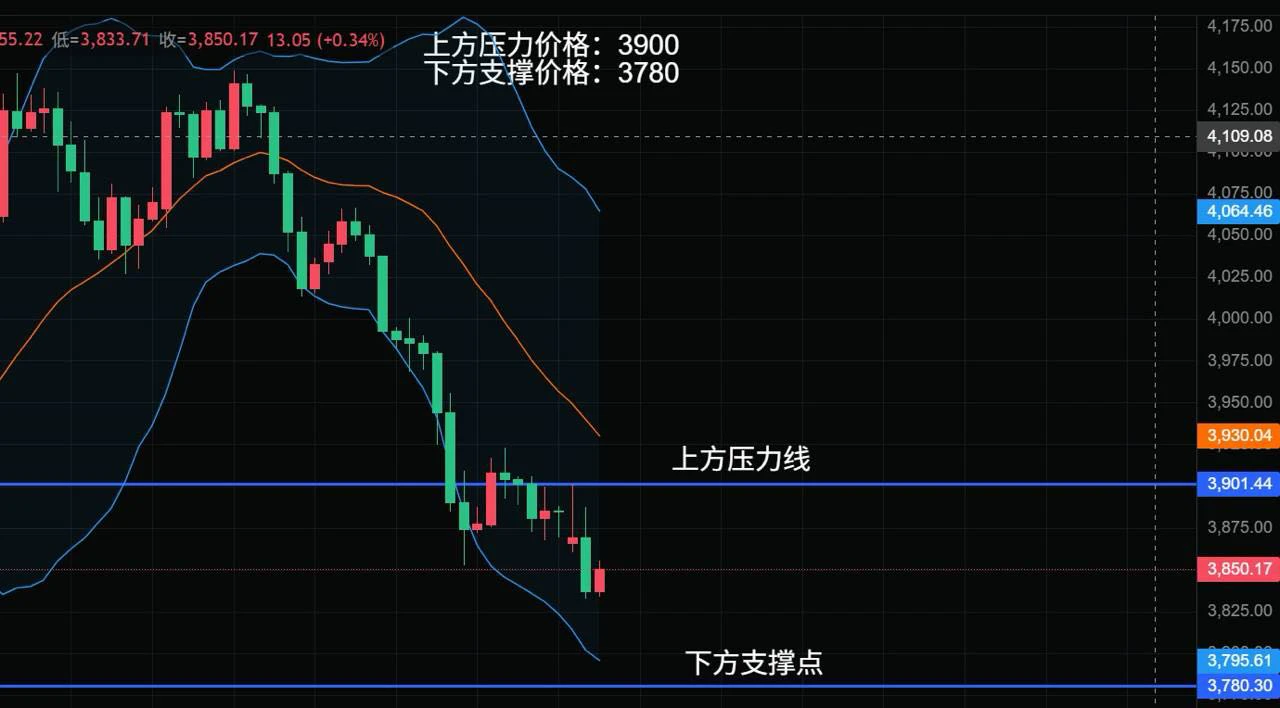
December 16 $XAUUSD
Resistance above: 3900
Support below: 3780
Trend: After falling in the morning, the price entered a low-level sideways range, fluctuating between 3866 and 3885. It retested the low of 3833 before rebounding slightly. The current rebound is weak, and the overall trend is bearish.
Strategy: Short at highs and go long at lows; consider a long entry near 3835
post-image
XAUUSD+0.00%
  • 1
  • 1
Trenches
mihao
m
bade
b
mihao
4Cxj...pump
Market Cap
$.
Change
.
24h Vol
$.
Holders
.
Marvin
M
bade
b
Marvin
HkRQ...pump
Market Cap
$.
Change
.
24h Vol
$.
Holders
HOGE
H
bade
b
HOGE
FVzq...pump
Market Cap
$.
Change
.
24h Vol
$.
Holders
.
rockstar
r
bade
b
rockstar
9HFU...pump
Market Cap
$.
Change
.
24h Vol
$.
Holders
.
AGT
A
bade
b
AGT
0x5d...e274
Market Cap
$.
Change
.
24h Vol
$
Holders
.
Looking at gold’s current trend, prices have continued to retreat from around $5043 earlier, falling as low as $3775 and currently trading around $3855. Overall, the bearish trend on the daily chart remains clear, while there are signs of a short-term rebound.

On the daily chart, the MA5, MA10, and MA30 are bearishly aligned, with prices trading below the moving averages. The MACD is also below the zero line, indicating that the medium-term trend remains weak for now. On the 4-hour chart, the MACD has formed a low-level golden cross, and short-term rebound momentum has recovered somewhat, but
post-image
XAU+0.38%
Take it slow in the daytime session; lock in a steady 1,000 on BTC first!
BTC-0.67%
The space was better when this was the main character
I'm willing to fight anyone on this
post-image
🔹BTC Falls Below $71,000 to Its Lowest Level Since September! With the $70,000 Mark Under Threat, H
live-cover
LIVE2,012
Watching $1000PEPE$1000PEPE struggle to hold these lows is like watching someone try to climb an oil-slicked slide. It can’t wait to get out of here, and the downward momentum right now is truly unstoppable. TP: 0.0036015SL: 0.0039090Market Update:
$BTC : Current price 64,389.8 - 24-hour change: -0.11%
$EVAA : Current price 2.8247 - 24-hour change: +66.28%
post-image
EVAA-0.49%
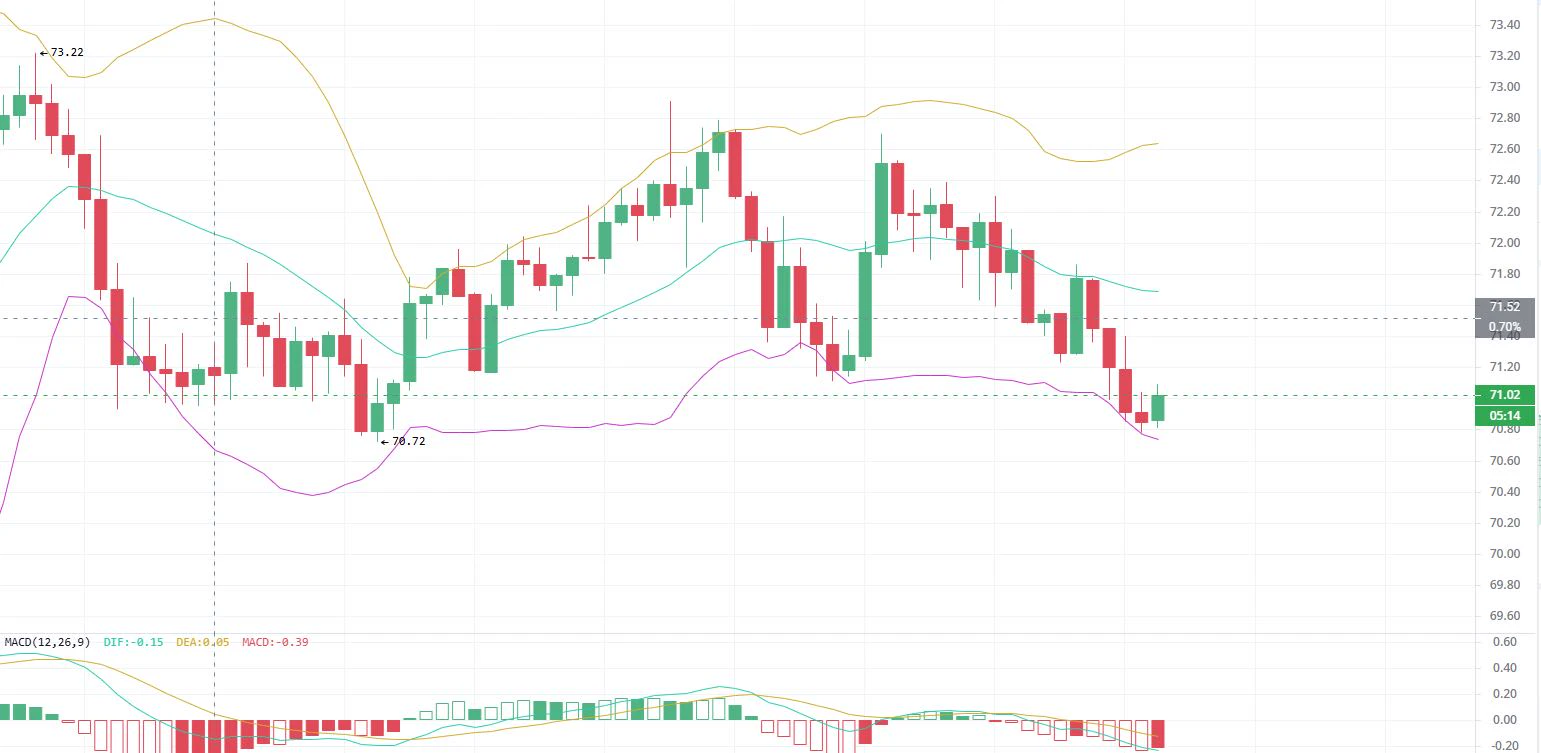
11.16 SOL Midday Silk Road
$SOL ‌
【Market Analysis】
Price pulled back in a choppy manner from the high of 73#Gate直通IPO第三期Anthropic .22. The Bollinger Bands gradually narrowed and turned downward, with the candles trading under pressure below the middle band. The previous low of 70.72 is acting as near-term support. After this dip, price found support and printed a rebound candle near the support level. MACD is below the zero line, with DIF close to DEA; bearish momentum is easing marginally. This is a low-level consolidation and recovery structure following the decline. The range has not yet
post-image
SOL-0.74%
[ NEW STREAMER ] CRYPTO MARKET
live-cover
LIVE1,968
aptos accepts aip-137, introducing optional post-quantum signatures based on nist-standardized slh-dsa to prepare accounts for future quantum computing threats.

\#APTOS #QUANTUM $GATE
post-image
APT-1.51%
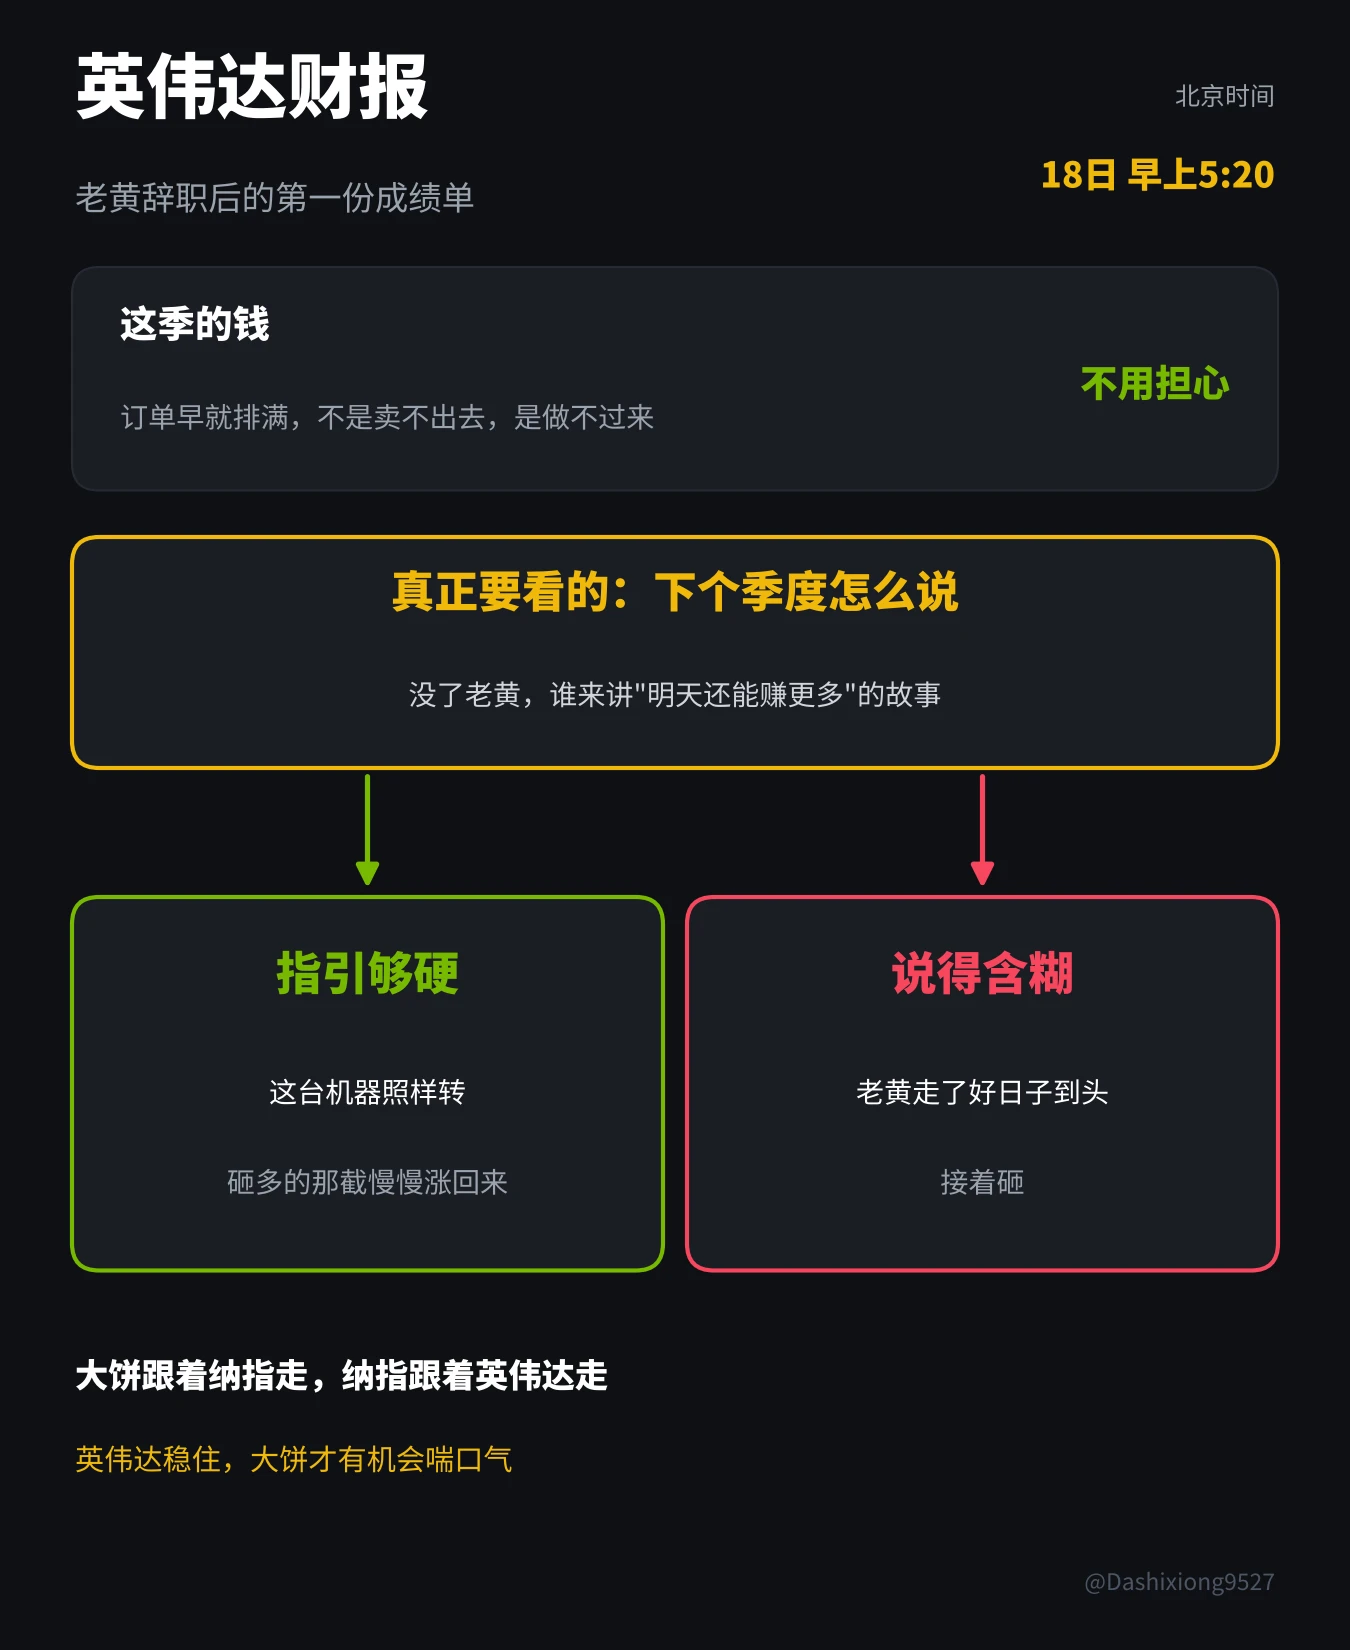
Guys, Nvidia reports earnings tomorrow, after the U.S. market closes on the 17th. This is its first earnings report since Huang resigned, and everyone is watching to see whether Nvidia can still hold up without him.
Dachao is focusing on just this one question.
Nvidia has already earned the money for this quarter. Major companies around the world are scrambling for its chips, with orders backed up until next year. It’s not that they can’t sell them; they can’t make them fast enough. So the numbers in this earnings report probably won’t look bad.
Then why has the stock fallen so much? Because w
post-image
NVDA-1.92%
BTC-0.67%
NAS100+0.00%
Last week, all ETH short strategies hit their targets, with trend timing nailed

November 9 short position, entry range 2150-2180. The intraday high of 2159.26 touched the lower end of the range, met resistance, and pulled back; the intraday low of 2081.19 reached the take-profit target.
November 10 short position, entry range 2150-2170. The intraday high of 2132.55 met resistance on the rebound and then continued to weaken; the intraday low was 2082.07.
November 11 short position, entry range 2070-2090. The intraday high of 2072.87 reached the range, but the move higher lacked momentum and th
ETH-1.23%
BTC-0.67%
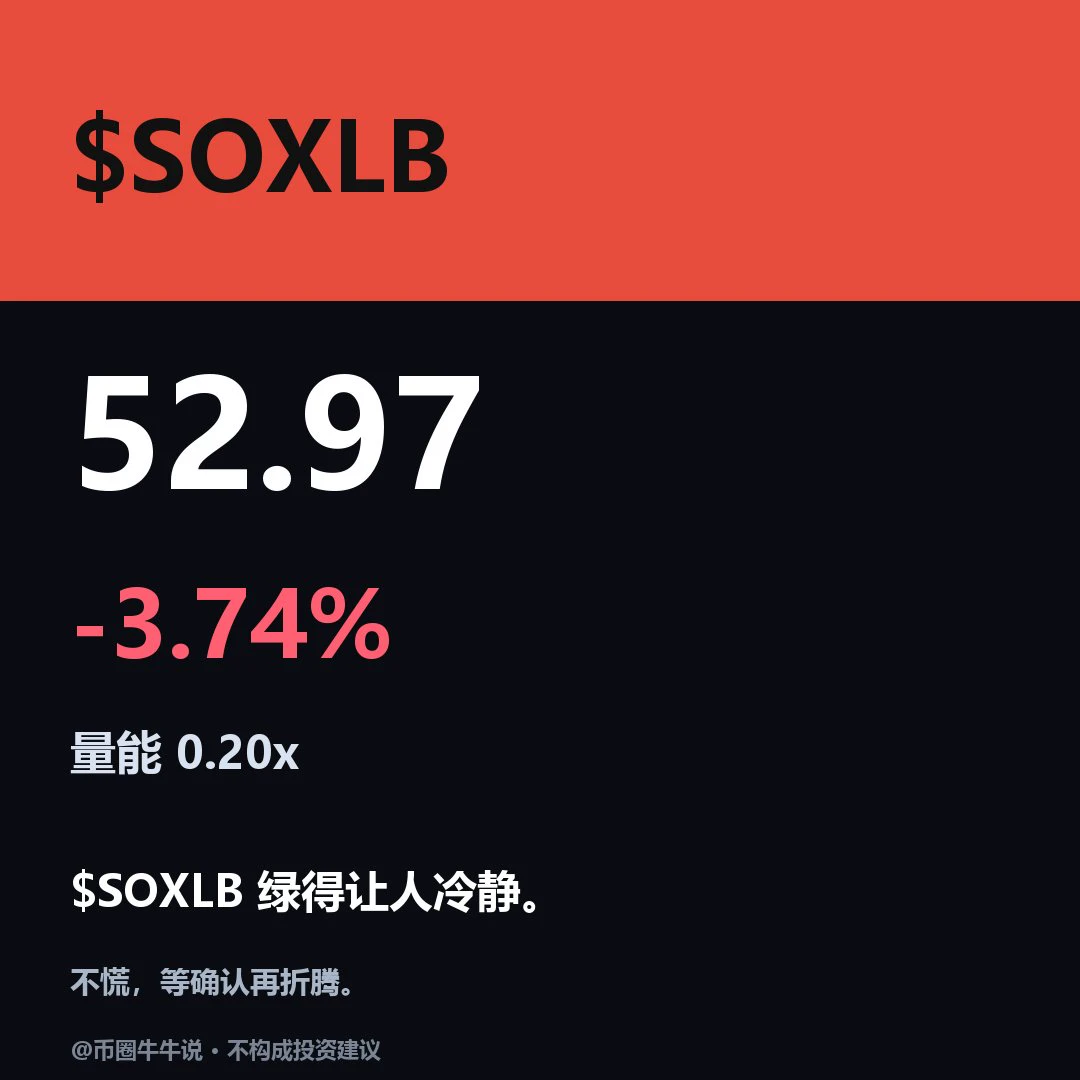
$SOXLB is currently trading at 52.97, down 3.743% over 24H, with light trading. On the 1H and 4H timeframes, both show a weak structure, with insufficient RSI momentum and volume at just 0.20x the average of the last 20 bars; a single move above the level needs confirmation from increased participation. Key resistance is at 59.23, with support at 51.82. If it holds above 59.23, wait and see; if it breaks below 51.82, the short-term outlook weakens. In the follow-up review, focus on whether it holds above 59.23 and whether a break below 51.82 is followed by a recovery. The setup is invalidated
post-image
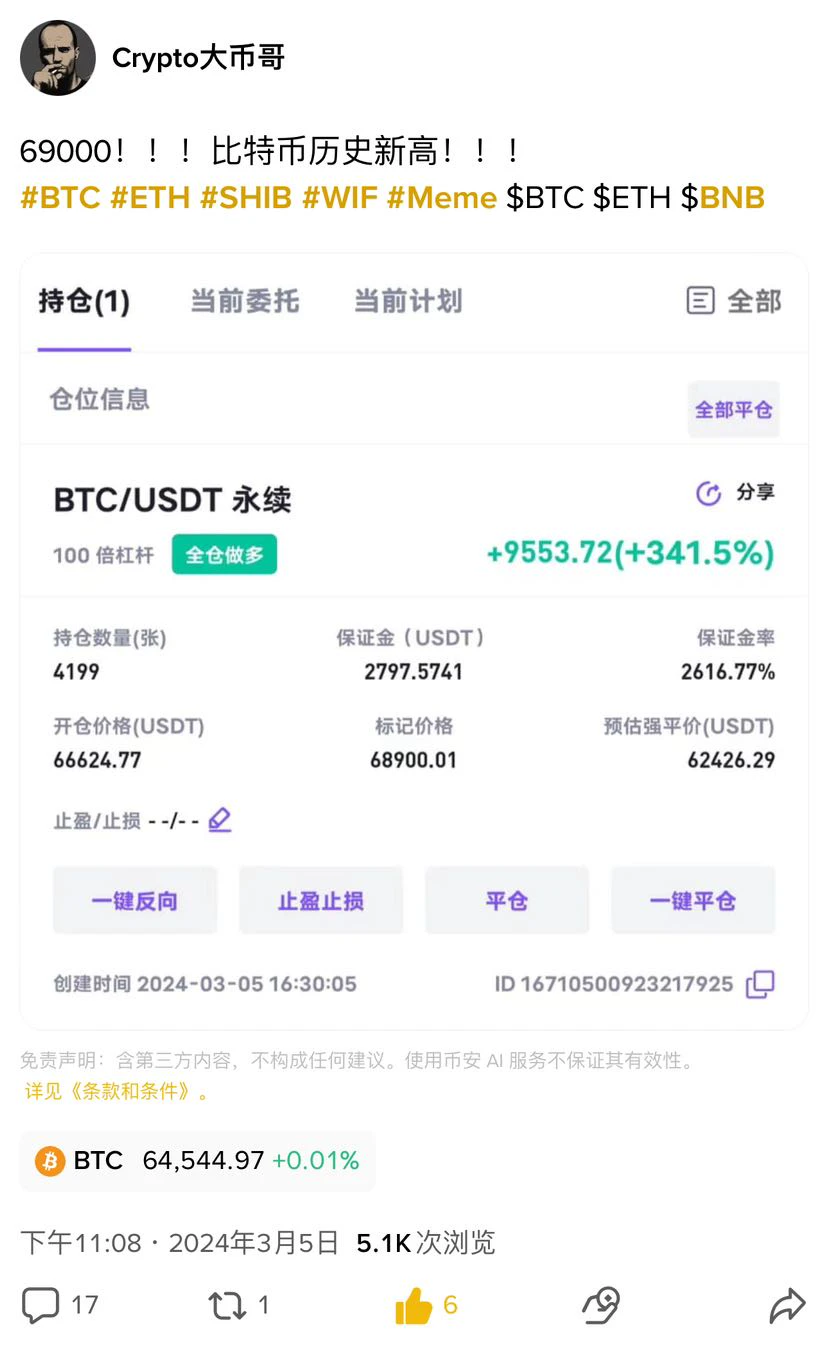
“Long at 69000, exited at 341%, today 64000”

On March 5, 2024, I opened at 66624 and took profit at 68900, with unrealized gains of +341.5%. That day, I posted: 69000, a new all-time high for Bitcoin!

Today, near 64000, the weekly chart has broken below the 200-week moving average, and the market has shifted from “new highs” to “survival mode.”

Put this chart next to the current price, and there are just three things to say.

I. The most important thing to review has never been the entry, but the exit.
On March 5, 2024, everyone online was saying 100,000 was just the beginning, while fundin
post-image
BTC-0.67%
ETH-1.26%
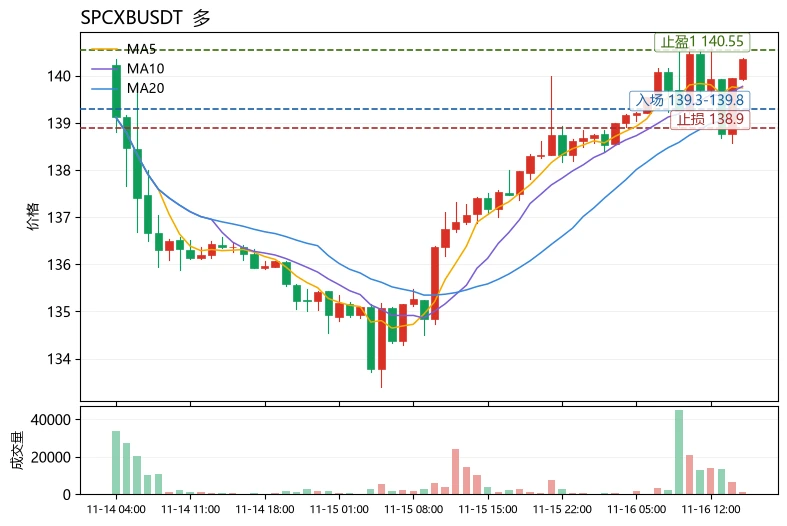
The Extreme Fear Index is just 10, yet $SPCXB rose 2.13% in 24 hours against the trend. This is the most unusual detail in today's market: sentiment at rock bottom and prices reaching new highs at the same time often mean that positions are quietly changing hands. Breaking it down with moving averages: the current price of 140.3 is above MA5 (139.742) and MA20 (139.252), with MA5 above MA20, so the short- and medium-term trend structure remains healthy. This is the core basis for judging that the bullish trend has not broken down. But note two divergence signals: RSI has risen to 61.4, nearin
post-image
SPCXB
SPCXBSpaceX
Four.meme
MC:$3.12KHolders:2
0%
SOL-0.77%
LINK-0.18%
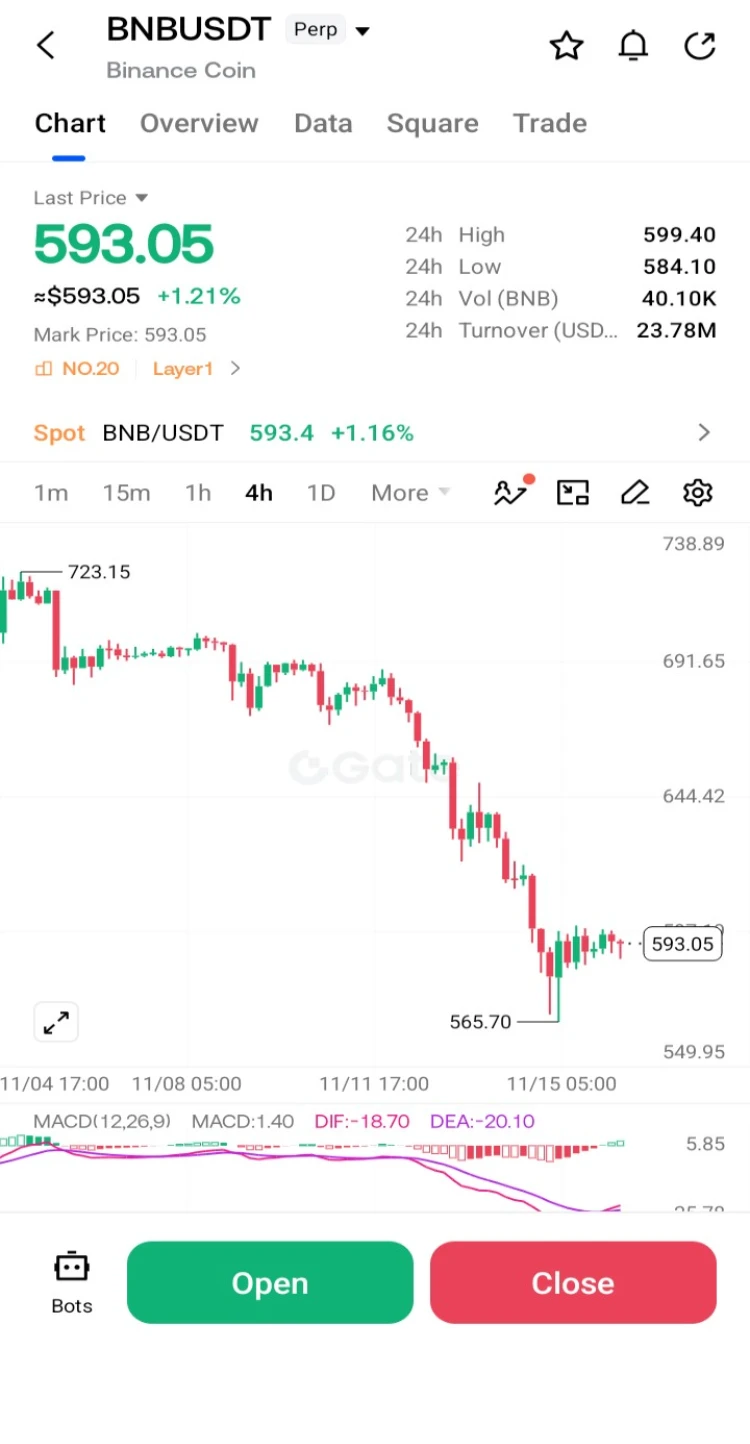
$BNB has been a bit annoying to trade today. It keeps chopping around $590-595, fake moves up, fake moves down, and it’s easy to get shaken out if you’re not patient. But if you zoom out, something interesting is happening: sellers keep trying to push it lower and they just can’t get any real follow-through.

That tells me buyers are quietly defending this area. It’s not explosive yet, but it’s the kind of quiet strength I like to see before a move.

The level that matters: $600

That’s the line in the sand. A clean break and hold above $600 would shift momentum back to the bulls, and that’s
post-image
BNB-0.76%
Fear Index at 13—Be Greedy When Others Are Fearful? Don’t Rush to Go All In

Guys, I opened my market app today and everything was deep in the red. The CMC Fear and Greed Index plunged straight to 13. What does 13 mean? It’s in the “extreme fear” zone. BTC is hovering around $64,700, having broken below key support, and the mood in the group is practically like a funeral.

When I see a market like this, I’m in the opportunity camp. But let me be clear first: being opportunistic absolutely does not mean blindly rushing in to catch a falling knife.

A lot of newbies hear “be greedy when others a
BTC-0.65%
  • 1
With a 10x short position open, the return is +698.14%! $BTW Entry price: 1.486827; current price: 0.440245.

BTW, volatility has narrowed over the past two days, and the bearish structure remains unchanged. After 1.0 is lost, the nearest effective support below is 0.44. Under normal conditions, when the price falls from above 1.5 through 1.0, the first target is 0.44. In practice, the price may not hit that level precisely every time, so taking profit around 0.5 is also reasonable. If 0.44 breaks, the next level to watch is 0.35.

When trading volume has not picked up, breaking the rebound hi
post-image
BTW-7.75%
GT-2.24%
SOL-0.74%
British media report that Jensen Huang is considering a return to Nvidia. Huang coming back? Who will be Nvidia’s next CEO? Nvidia’s CEO chair is probably the hottest swivel chair in Silicon Valley. Huang resigned over an extramarital affair scandal, and just days later, Musk led a joint letter calling for him to come back. Unreal, right? Even more unreal, some people are cursing, “What kind of ridiculous script is this?” while staring at NVDA’s chart with trembling hands. Here’s the situation on the ground: The potential replacements are one more outlandish than the next. Interim CFO Colette
post-image
NVDAB
NVDABNVDAB
Pump.Fun
MC:$3.5KHolders:1
4.36%
NVDA-1.92%
AAPL+0.41%
SOXL+0.00%
This move by Polkadot$DOT really cut away the last bit of faith the old bagholders had.

Does Polkadot-san still have any fight in it now?

The parachains, cross-chain ecosystem, and Web3 infrastructure once hyped to the skies are now facing a liquidity drought, and even star project Acala is preparing to shut down its chain.

What's the most ironic part?

Projects can cease operations, developers can switch fields, and KOLs can delete their old predictions of 100x gains.

Only the retail investors who bought at the top are still clinging to charts down 90%, waiting for a recovery in value.

DOT-1.51%
ACA+0.24%
BTC-0.67%
Load More

Join 40 M users in our growing community

⚡️ Join 40 M users in the crypto craze discussion

💬 Engage with your favorite top creators

👍 See what interests you

Trending Topics

GateIPOAccessAnthropic

390.6K Views2.9K Discussing

Gate IPO Access Phase 3 features Anthropic (ANT), with USDT subscription interest starting from 100 USDT. Successful allocations will be delivered as real shares to Gate Stock Accounts. Indicative price: $70–$78/share Subscription: Nov 12–17 (UTC+8) Allocation is not guaranteed. Please manage risk accordingly.

Dr.HanOxfordUnionSpeech

314.9K Views1.2K Discussing

BTCBreaksKeySupportAsFearDeepens

847.1K Views1.1K Discussing

View More