

Share your thoughts
placeholder
Article
SOL Technical Outlook: Solana Reclaims $110 as Recovery Structure Strengthens
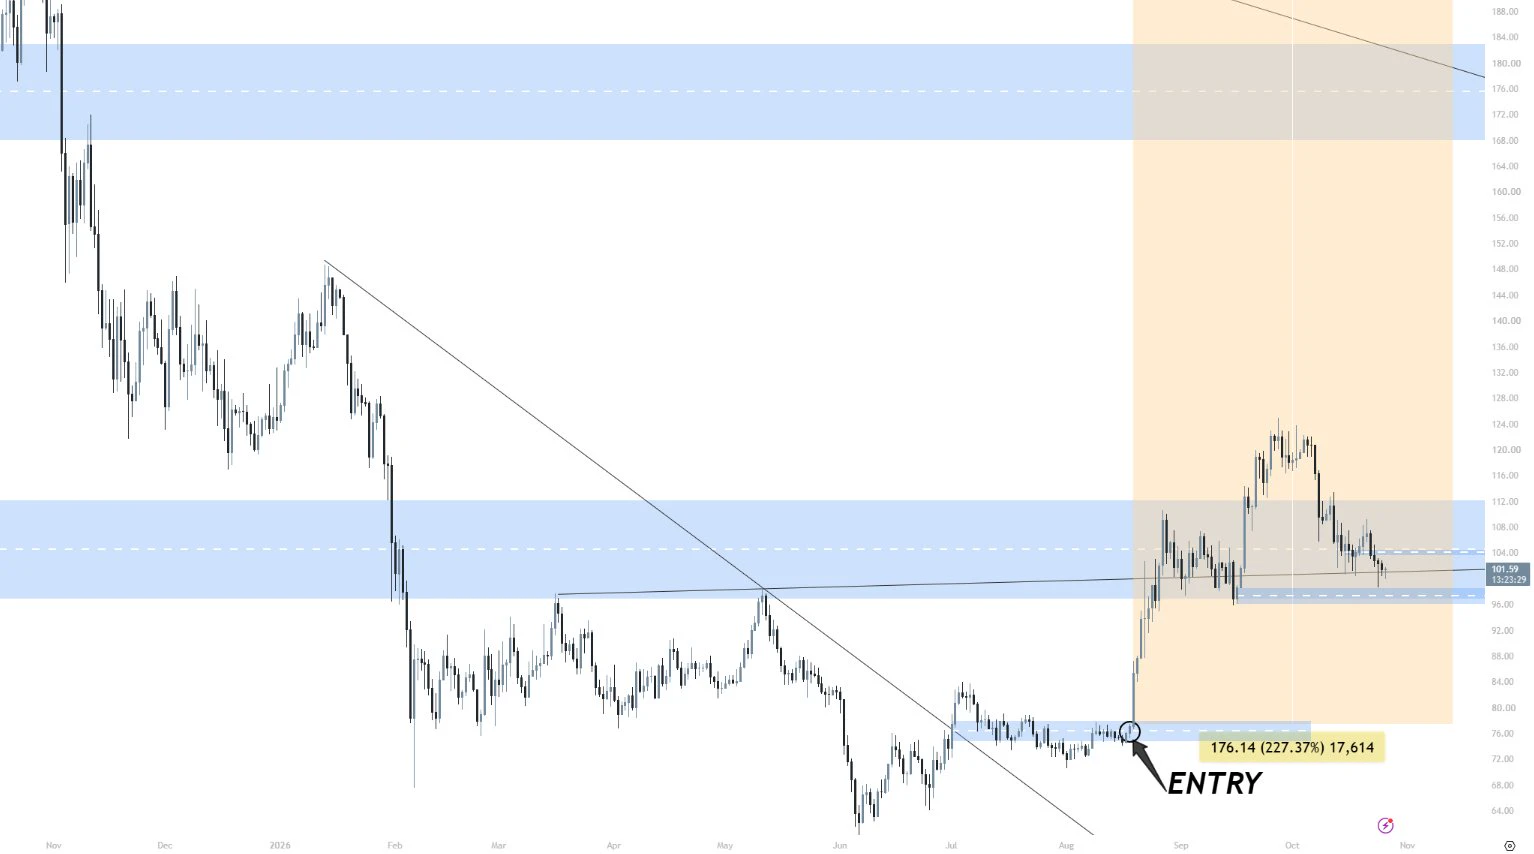
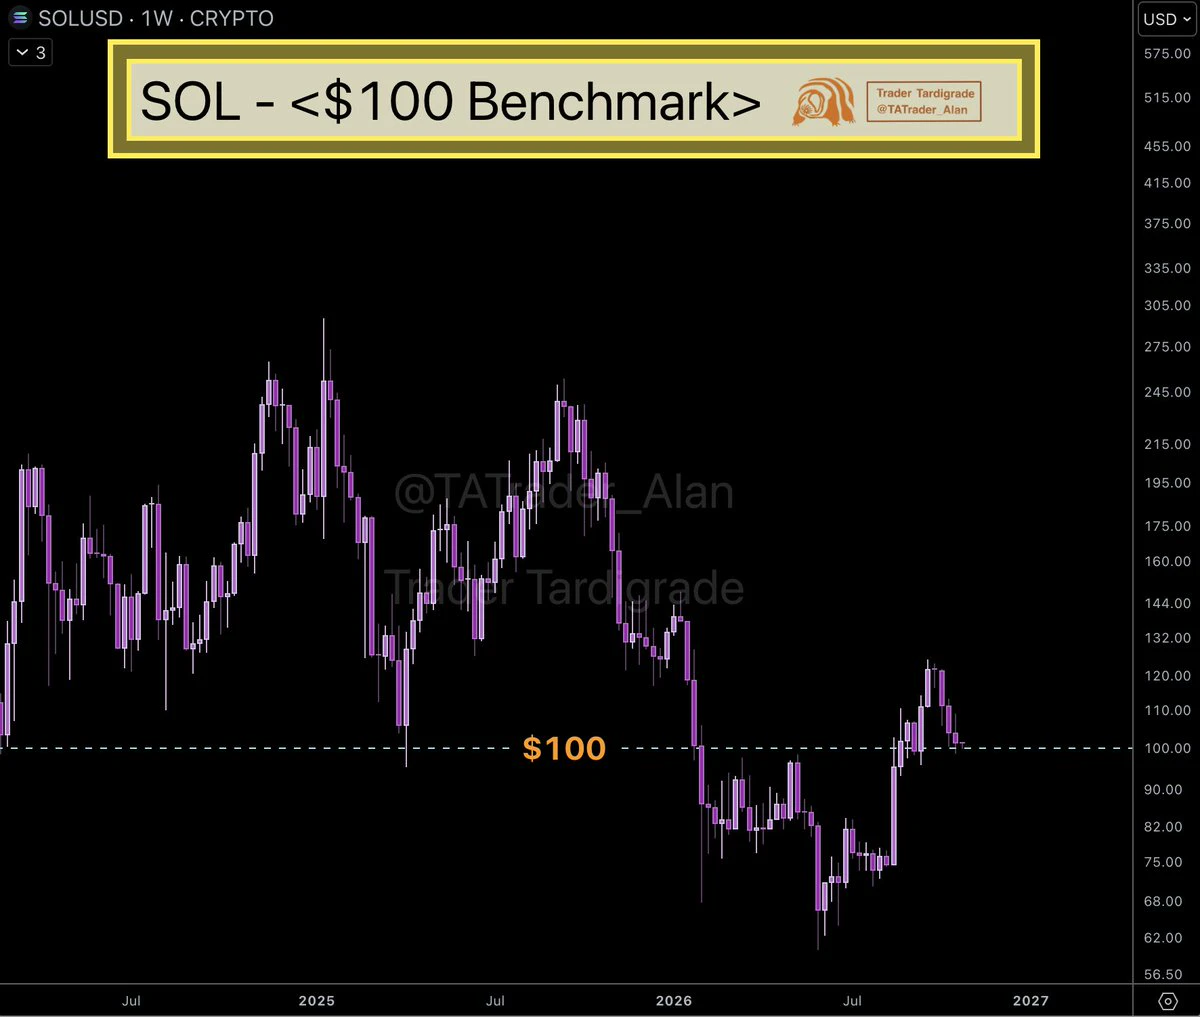
SOL is currently trading around $110.1, holding above the $106–$109 region after the recent recovery from the $92–$100 support area.
The broader structure has improved, with price reclaiming the $100 area and moving back toward the major $111–$114 resistance zone. A sustained move through this area would put the higher Fibonacci levels back into focus.
📈 EMA Structure
20 EMA: $102.68
50 EMA: $95.19
100 EMA: $89.54
200 EMA: $92.61
SOL is currently trading well above the 20 EMA at $102.68.
The recovery above the 50 EM
SOL-1.07%
  • 1
BTC UPDATES
live-cover
LIVE15
#JapanRealEstatePowerChipStocksRise
Japan’s stock market continues to attract attention as investors focus on two important themes: real estate and semiconductor-related companies.
Recent trading has shown strong interest in Japanese chip and AI-related stocks. Semiconductor names such as Advantest, Tokyo Electron and Kioxia have been among the companies drawing significant buying interest, reflecting the continued global focus on AI infrastructure, advanced computing and memory demand.
The semiconductor story is particularly important for Japan because the country remains a major part of the
post-image
#BTCRetakes80K
BTC is strong again, but this is exactly where I don’t want to confuse a recovery with a confirmed breakout.
Bitcoin is trading around $80.4K today, after pushing as high as roughly $81.9K. The bigger picture has changed quickly: BTC recovered from the $75K area after the Fed-driven volatility and then reclaimed the $80K psychological level. That tells me buyers are still willing to step in, but the market is now sitting directly in a zone where profit-taking can appear.
The ETF picture is also worth watching. U.S. spot Bitcoin ETFs finished the week of September 18 with a smal
post-image
BTC-0.35%
Nobody is talking about this quiet short setup on $XAU /USDT right now.

$XAU /USDT - SHORT

Trade Plan:
Entry: 4377.52 – 4378.92
SL: 4384.96
TP1: 4373.17
TP2: 4369.80
TP3: 4364.74

Why this setup?
Why now? The daily trend is range, which often precedes a decisive break, and the 1h price is sitting at 4378.22, the exact entry reference for a short. The 15m RSI at 56.71 shows room to drop without being overbought, while the 1h ATR of 2.807966 means the next candle can easily cover the distance to TP1 at 4373.17. TP2 at 4369.80 offers a bigger reward, but the invalidation level of 4370.91 is
XAU-0.17%
Claim your 500k $BULLHUNT Airdrop 🪂
Like + RT pinned post 📌

Drop your $sol address & RT ♻️

First 500 wallets 👇 #Solana
AIRDROP0.00%
SOL-1.07%
‼ The lowest price of the year, four gt half-price offer ends tonight; 90% win rate, over 600 subscribers🎉 have been profiting every day for nearly a month🀄️Today’s futures/spot updates are live👇
https://www.gate.com/zh/profile/Bitcoin King, come over
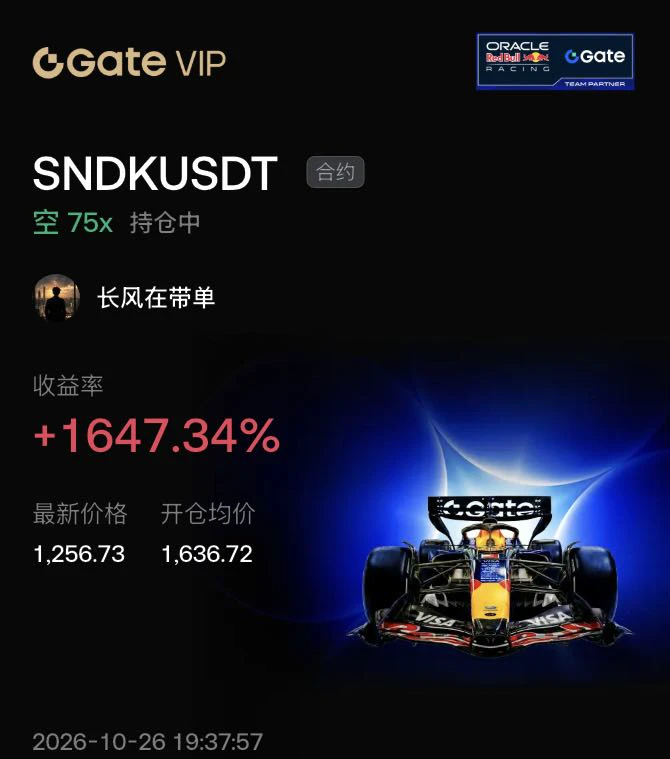
🔥Recently continuously profited 6,660,000 U‼️Accurately went long on the NFP at 75000/2375, now at 81900/2665, profiting again📈SanDisk went long at 1440, reached 1820, doubling the account by 800,000📈Second wave went long at 1535, then surged to 1800, doubling the account🀄️This time ZEC went long at 1035, reached 1590 in a massive surge, d
GT+0.48%
BTC-0.33%
  • 10
$SNDK /USDT is range-bound on the daily chart, but the 1h setup says otherwise.

$SNDK /USDT - SHORT

Trade Plan:
Entry: 1771.46 – 1774.92
SL: 1789.81
TP1: 1760.73
TP2: 1752.42
TP3: 1739.96

Why this setup?
Why now? The 1h price is at 1773.19, the 15m RSI sits at 53.35 showing neutral momentum, and the 1h ATR is 6.922983, meaning a single bar can cover over 6 points of range. The entry zone between 1771.46 and 1774.92 aligns with that 1h price, giving a tight risk-reward for a short bias. TP1 at 1760.73 and TP2 at 1752.42 define the first two targets, while the invalidation level at 1687.27
SNDK-0.58%
  • 4
$btc
Could it be?
#bitcoin
BTC-0.35%
$SNDK /USDT is about to break range in a direction nobody expects

$SNDK /USDT - SHORT

Trade Plan:
Entry: 1773.90 – 1777.36
SL: 1792.25
TP1: 1763.17
TP2: 1754.86
TP3: 1742.40

Why this setup?
Why now? The daily trend is range, which means the 1h price at 1775.63 is trapped between extremes, and a short setup is forming near the 15m RSI reading of 61.81, signaling that momentum is still stretched but ready to reverse. The 1h ATR of 6.922983 shows enough volatility to push price from the entry zone of 1775.63 toward the first target at 1763.17, then deeper toward 1754.86. If the breakdown ho
SNDK-0.58%
The 10-year U.S. Treasury yield has risen to a high of 5.01%, continuing to weigh on risk asset valuations, while the crypto market remains under overall pressure; the SEC’s innovative exemption for tokenized stocks has sparked divisions, bearish for BTC, while ETH lacks independent positive catalysts; whale-related data shows no clear buying support. Technically, short-term rebound potential is limited, and the risk of chasing higher prices is relatively high. A rebound into the 2610~2660 range is suitable for shorting; monitor changes in Treasury yields and regulatory news. For market analys
post-image
BTC-0.35%
ETH-0.39%
A name that has been rising for five straight days has climbed onto the trending list overnight: RENDER—who's scooping it up?
Well, a name that has been rising for five straight days climbed onto CoinGecko's trending list overnight—$RENDER . Current price: 1.662, up 5.7% in 24 hours, with volume reaching 2.478 times the 30-day average.

I'm bullish at this level—don't chase spikes in the short term; I favor buying dips below 1.66, cut losses if it breaks below 1.616 (4h SAR), and talk about acceleration only after it reclaims 1.757.

Two reasons—the daily MACD has formed a golden cross above
RENDER+5.63%
THE WOLF DOESN’T PANIC IN THE STORM
Every strong move eventually meets resistance.
Every crowded trade eventually meets fear.
The wolf doesn't panic when the forest gets quiet—it starts looking for clues.
Meme markets are famous for volatility.
A token can surge rapidly, attract massive attention and then retrace just as quickly.
That's where many decisions become emotional.
The first question after a sharp pullback shouldn't always be:
“Should I sell?”
A better question is:
“What actually changed?”
Did liquidity disappear?
Did volume collapse?
Did the market break its structure?
Did participa
post-image
ARC+12.05%
DOGE-3.09%
SAGA+47.99%
PEPE-6.03%
  • 1
156%, excluding fees. Note this down.
post-image
$AKE ➜ 0.085 🥂💥 BOOOOOMMM
ONE'S M-O-R-E CONGRATS🎉✨ PERFECT WIN $AKE Tp 1,2 ACHIEVE 🤝🎉🥰 $AKE FLY TO ▫️ 0.059 ▫️0.065
post-image
AKE-7.99%
To be honest, I’m surprised this trade has survived until now; luck played a significant part.
A few days ago, I was watching $DOGE in the early hours. It held above the key level and stabilized after the pullback, so I gave just one signal at the time: open a long. I didn’t expect it to actually come through.
From 0.07003 all the way to 0.08705, +2260.82% says it all. That was a satisfying bite of profit—staying up late wasn’t for nothing.
The market is won by waiting, and profits are secured by holding. Putting risk control first is rational; cutting after taking a loss is a last-resort move
post-image
DOGE-2.99%
BTC-0.33%
ZEC-0.09%
[New Streamer] Market Prediction
live-cover
LIVE83
The trade war has dragged on, and the tariff lists are now longer than a shopping receipt, with both sides waiting for the other to blink first. But the data doesn’t lie: import prices have risen, and so have the prices on store shelves, while ordinary people’s wallets are the first to feel the pain. It’s that simple: whoever gives in first loses face, and whoever holds out suffers. Who do you think will crack first?
post-image
Short BTC at the current price! The long position has already taken profit! $BTC
post-image
BTC-0.33%
#JapanRealEstatePowerChipStocksRise
Japan’s equity market is seeing renewed attention across two distinct areas: real estate and semiconductor-related companies. Recent land-price data showed Japanese land prices increased 1.5% in the year through July 1, marking the fifth consecutive annual increase. Prices across the Tokyo, Osaka and Nagoya metropolitan areas rose 4.4% on average.
The property-market trend has also been reflected in listed real-estate companies. Recent market reporting showed gains across several major Japanese developers following the land-price data, with investors monito
Load More

Join 40 M users in our growing community

⚡️ Join 40 M users in the crypto craze discussion

💬 Engage with your favorite top creators

👍 See what interests you

Trending Topics

MSTRTopsNasdaq100

74.26k Views3.03k Discussing

Strategy (MSTR) has gained about 48% over the past month, making it the best-performing stock in the Nasdaq 100, while Bitcoin rose roughly 12% over the same period. The company holds 845,050 BTC with a cumulative cost basis of about $63.73B. MSTR is not a pure Bitcoin proxy — its price swings can be more extreme. Can this rally last?

Gate Tops 24H Net Inflows Among Exchanges

26.51k Views3.69k Discussing

BTCRetakes80K

57.37k Views60.68k Discussing

View More