Share your thoughts
placeholder
Article
#GateTops7DayNetInflowsGlobally
Weekly Net Inflow Crown Goes To Top Trading Venue
A fresh weekly read on capital flow shows a clear leader at the top. One major trading venue has posted the largest net inflow across the global market for the past weekly window, pulling ahead of all rivals. The data points to strong user trust and a wave of fresh deposits aimed at spot and derivatives books. In a time when traders move funds with care, this kind of lead is seen as a strong vote of confidence.
① Why Net Inflow Matters For Market Health
Net inflow tracks the gap between funds added and funds tak
MU+5.89%
NVDA+0.87%
SNDK+11.88%
TSLA-5.96%
AAPL-2.51%
  • 9
Everyone’s watching BTC, but UAI just printed a 95% confidence LONG while the crowd sleeps.

$UAI /USDT - LONG

Trade Plan:
Entry: 0.58632 – 0.60584
SL: 0.50234
TP1: 0.66638
TP2: 0.71325
TP3: 0.78355

Why this setup?
- 4H structure is armed: entry zone 0.586–0.605, with 1D trend already bullish.
- RSI (15m) at 59 shows momentum building, not overheated—room to run before exhaustion.
- ATR (1h) at 0.039 means volatility is alive; TP1 at 0.666 is a 12% move, TP2 at 0.713 is +20% from here.
- Why now? Price is coiling inside the entry range, and the 95 score says the path of least resist
UAI+5.33%
Dogs vs Cats globally.
Judging by Data, Dogs lovers are bigger than cat lovers. If $ZCAT can trade at 100m on stonkfun, $WDOG should trade so much higher 🚀📈📈📈.
1B dogcoin paired with 1T digital gold "Bitcoin".
post-image
DOGS-0.35%
BTC+0.19%
Liquidated another $1,000; I only had $15 left yesterday. I’m not depositing anymore. I’ll keep a daily record and see how many days I can last and how far I can go.
post-image
“how much crazier could it possibly get?”
this is a real screenshot:
post-image
I had just switched the software to the background, and it shot right back up—is it playing hide-and-seek with me? I thought $OPENAI was going to drag its feet again today, but it gave me no time to react at all and went straight up.

A few days ago, the last thing I saw before bed was that buying pressure was quietly getting stronger, with the key levels on each pullback moving higher. The judgment was simple: the fact that the supply was being absorbed meant someone was ready to make a move. The long direction was decided, so entering was only natural. The moment the pullback held, I got in
post-image
OPENAI-0.32%
BNB-2.73%
ZEC+20.91%
Layout for Bitcoin, Ethereum, and Dogecoin
live-cover
LIVE3,603
  • 1
A few days ago, I was still calculating whether I had enough money for instant noodles this month; this morning, I was already wondering whether to add a sausage.
The last thing I saw before bed was $BEAT edging a little above 0.1339. I rubbed my eyes and didn’t rush to chase a long position. Volume hadn’t followed through, and every push upward fell just short—this looked less like a breakout and more like a bull trap. I placed a short order around 0.1339, set my stop-loss, and went to sleep. When I opened the chart in the morning, the price had already fallen to 0.1253, and my account showed
post-image
BEAT+0.89%
BTC+0.21%
LAB-5.00%
YO WTF JUST HAPPENED???
post-image
$PONS /USDT Perp – "V-Shape Recovery – Long"**
**Trading Plan Long $PONS
Entry: 0.8299
SL: 0.8100
TP1: 0.8627
TP2: 0.9200
Explanation: Price is recovering above the EMA5/10 with a positive MACD, targeting the 0.8627 yellow resistance.
post-image
PONS-3.86%
  • 5
  • 2
$$Bull Run Data looks off: the 24h high was 0.1299, and it is now 0.0933, down 28% from the peak, but trading volume is still $137 million—this shows someone is aggressively buying the dip during the plunge, rather than this being simple selling.
Three possibilities: First, the whales are wash-trading to shake out leveraged traders chasing the rally, switching hands before preparing to pull a second wave; second, the project team is reducing its holdings while liquidity is good, and this level of volume is enough for them to exit more than half their position; third, panic sellers and dip buye
牛来-18.05%
#Gate用户突破6000万 October 11, 2025—this was the day that taught me to remember the pain even after the wound had healed😁😁😁
Before bed that night, I was still happily looking at my positions: several grid bots had their orders neatly arranged, and the account’s unrealized profits looked encouraging. After running for days, they were like money-printing machines that never needed to rest, automatically buying low and selling high every day. I had even started calculating whether I should increase my positions next month.
Then I woke up to find that the sky had fallen.🙀🙀🙀
The market had fluct
post-image
With this price action, I don’t even need to think—the account is dancing on its own. When the market was just dumped in the early session, I already warned not to rush into buying; a rebound without volume is just bait.
The rebound is weak, volume isn’t keeping up, and there’s still a pile of sell orders overhead. This setup isn’t beyond saving, but we need to wait for the bears to exhaust their strength first. I opened a short position around 0.46953 and held it with complete peace of mind.
Now it’s at 0.02818, with a return of +2305.06%. The market played out the script on its own—what a ru
post-image
LAB-5.00%
SNDK+1.29%
Now, after making a payment, you can shake your phone to send some love to students in need. Nice.
post-image
  • 8
  • 2
MARKET prediction
live-cover
LIVE81
$$METIS The data looks off: the 24-hour trading volume is only 16.3M, yet the price has been pushed up 21.61%? In a sideways market, this kind of price-volume divergence is a trap nine times out of ten.
First, look at the chart: the current price is 3.399, trading just below the 24-hour high of 3.463. The swing from the low of 2.792 to the high of 3.463 exceeds 24%, yet the trading volume is even lower than that of many third-tier altcoins. Put bluntly, this was not driven up by real money from major players; it is the product of short liquidations and dried-up liquidity—the moment sell order
METIS+22.59%
The entry point for this trade was not perfect; I tried a long at the second-bottoming area on the hourly chart of $UAI . The moving averages had not fully turned upward yet, so I could only use a small stop-loss to capture the potential upside.
After entry, the price action was very sticky. Several pushes higher were driven back down, making it look like the trend was weakening. But the key levels during each pullback never broke below the key reference level at entry, so I chose to reduce my trading frequency and let the position run.
Only after the key level above was broken did the trend be
post-image
UAI+5.33%
BTC+0.21%
ZEC+20.91%
JUST IN: 🇺🇸 President Trump says he made "hundreds of billions of dollars" from stocks for the US.
"Not myself."
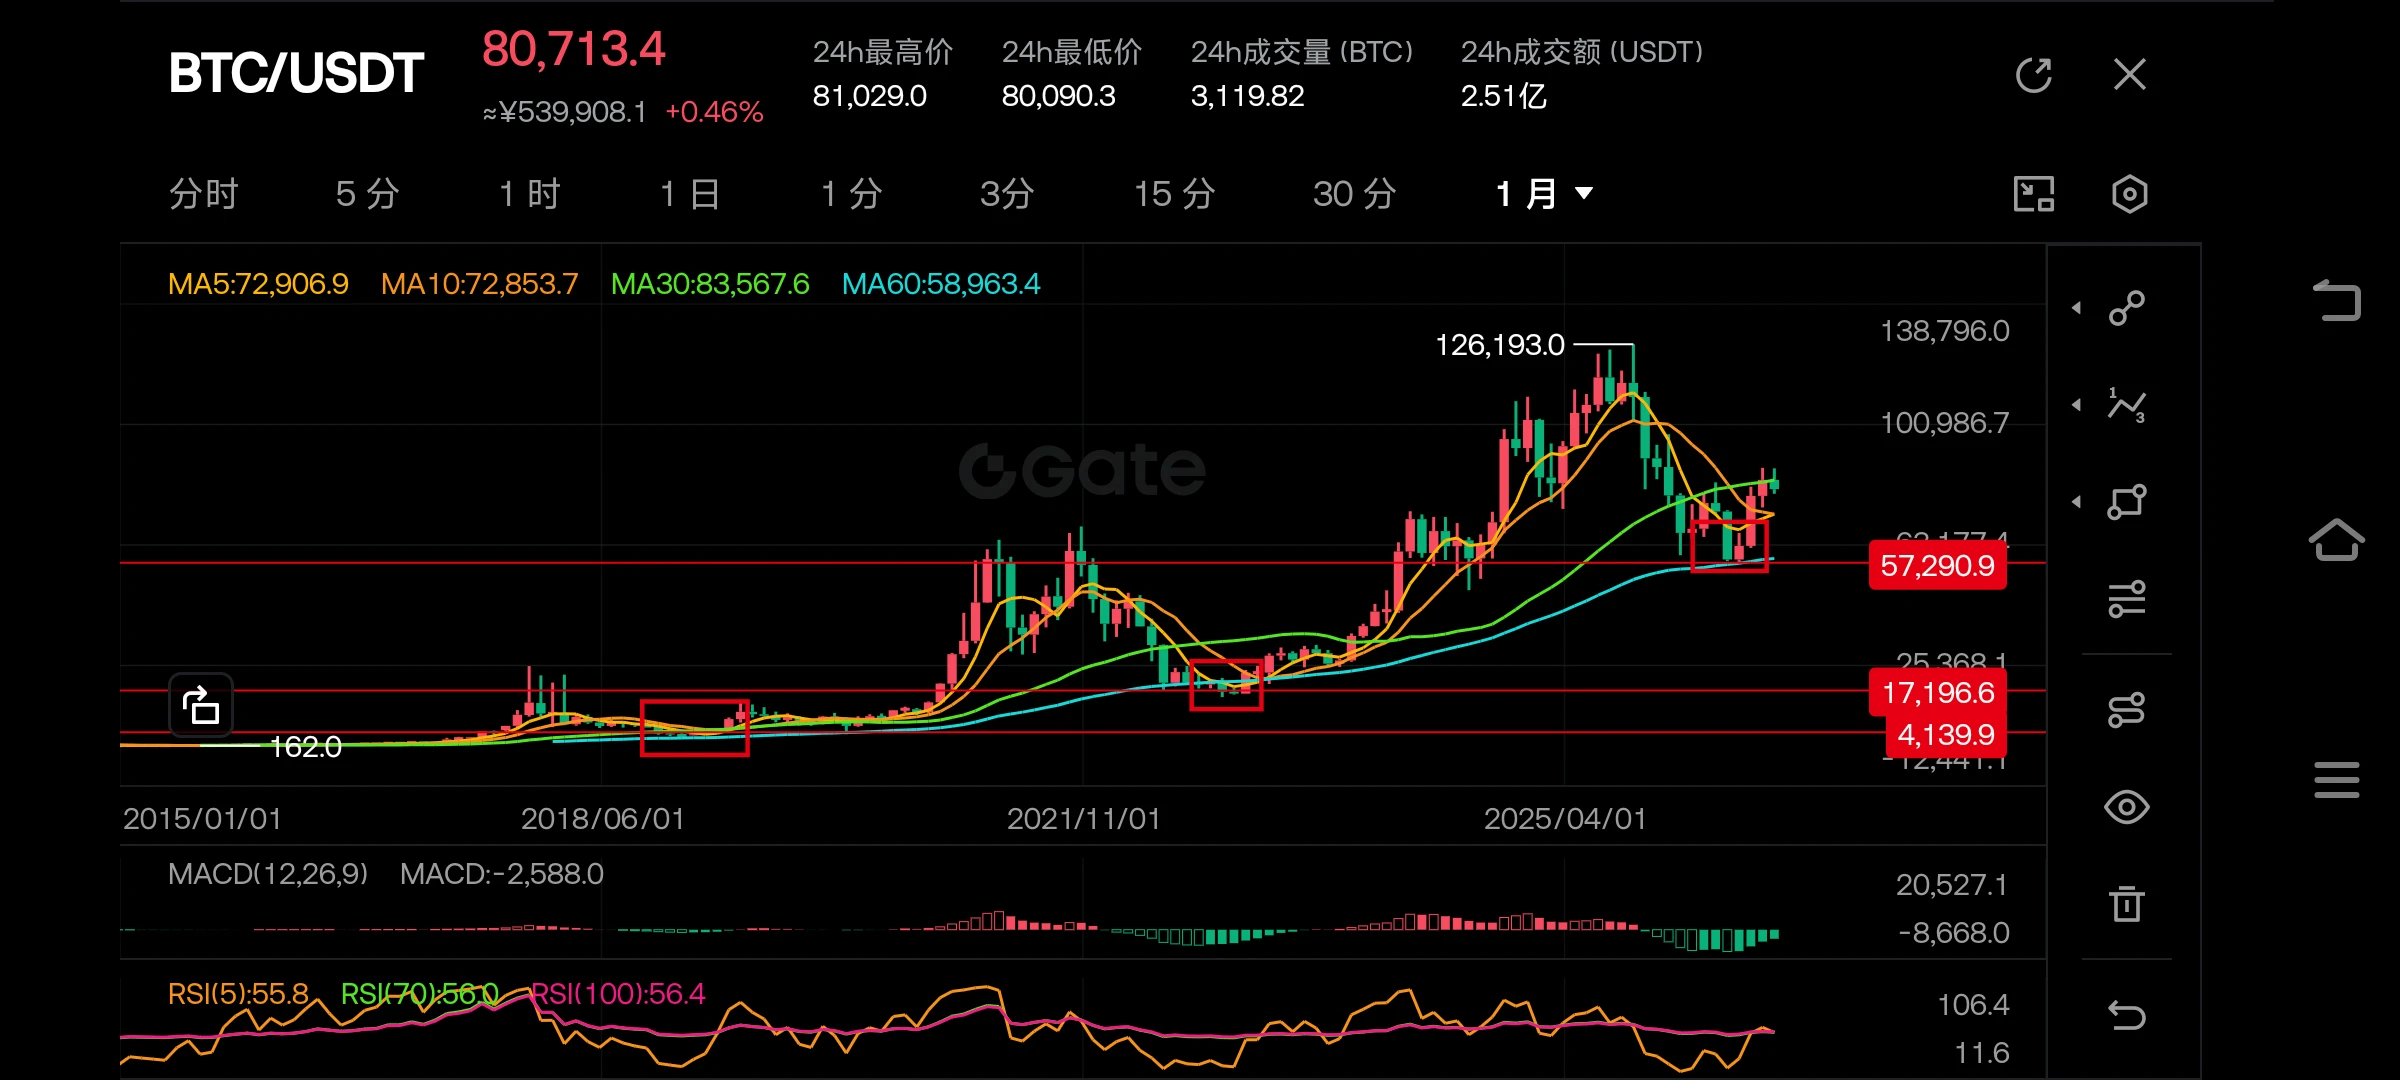
Guys Open Small Swimg Trade on $BTC
Entry Price - 80K 81K
{future}(BTCUSDT)
Guys Open Small Position & Hold. According to my Expereince $BTC Will Dip Again & we will buy in spot then.
I can be wrong - crypto is highly volatile. Dyor & open position with amount you aford to loose
post-image
BTC+0.21%
  • 1
Load More

Join 40 M users in our growing community

⚡️ Join 40 M users in the crypto craze discussion

💬 Engage with your favorite top creators

👍 See what interests you

View More