Square
Following
Hot
News
Profile
Share your thoughts
placeholder
Article
$BTC — Bitcoin Is Building Its Next Opportunity, And I'm Watching One Critical Zone Before Making My Move.
The Bitcoin market is giving us an interesting setup right now. After experiencing selling pressure, BTC is attempting to stabilize around the $77,800 region.
What caught my attention is that buyers are trying to defend the recent support area instead of allowing another aggressive breakdown.
But I'm not here to chase a green candle. I want a calculated entry with a clear invalidation level.
Looking at the latest market data, BTC is trading near $77,800, with a recent 24-hour high around
post-image
BTC-0.67%
  • 5
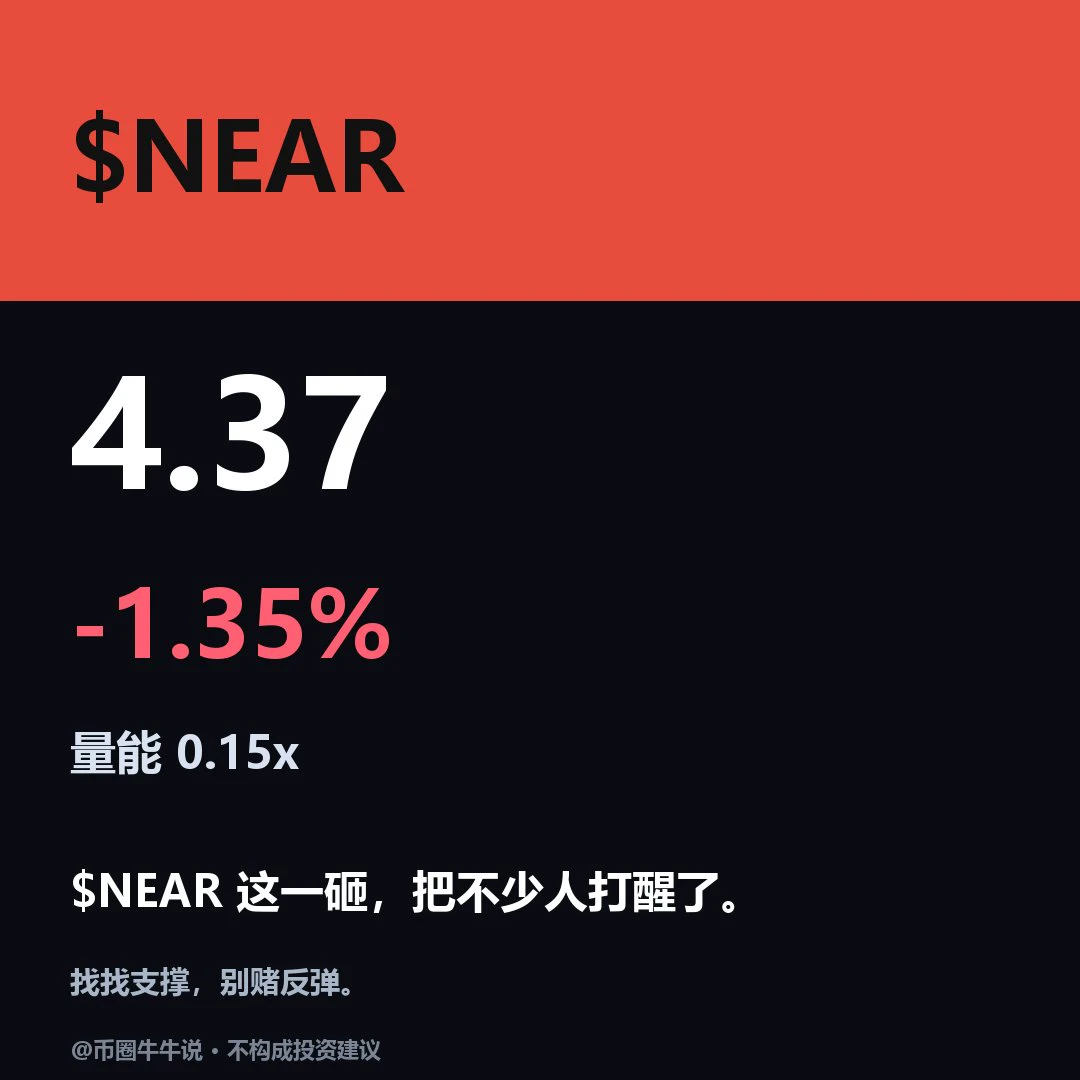
$NEAR is currently at 4.372, down 1.35% over 24H. Weakness on the 1H (RSI 25) and 4H (RSI 63) timeframes is aligning to the downside. If it holds above the 4.569 resistance level, a rebound may be worth watching; if it breaks below the 4.351 support level, it could move lower. Trading volume is insufficient. Going forward, watch whether it can hold above resistance and recover after losing support. The market is highly volatile; for observation only.
post-image
Trenches
ZIG
Z
bade
b
ZIG
0x8c...1145
Market Cap
$.
Change
.
24h Vol
$.
Holders
.
KIM
K
bade
b
KIM
8pjf...pump
Market Cap
$.
Change
.
24h Vol
$.
Holders
.
BTC
B
bade
b
BTC
C5xp...pump
Market Cap
$.
Change
.
24h Vol
$.
Holders
.
Anakin
A
bade
b
Anakin
Exxz...pump
Market Cap
$.
Change
.
24h Vol
$.
Holders
.
IDOL
I
bade
b
IDOL
0x3b...ab07
Market Cap
$.
Change
.
24h Vol
$.
Holders
.
ETH Technical Outlook: Ethereum Breaks Below Key EMAs as Bears Pressure $2,265 Support
Ethereum is currently trading around $2,269, facing renewed selling pressure after failing to sustain its recovery toward the $2,475–$2,500 resistance zone. ETH has pulled back from its recent highs and is now testing the important $2,265–$2,267 support area, close to the 0.236 Fibonacci level.
The short-term structure has weakened significantly, with ETH trading below all four major EMAs. RSI has also dropped to 33.92, indicating strong bearish momentum. Buyers need to reclaim the $2,311–$2,370 resistance r
ETH-1.23%
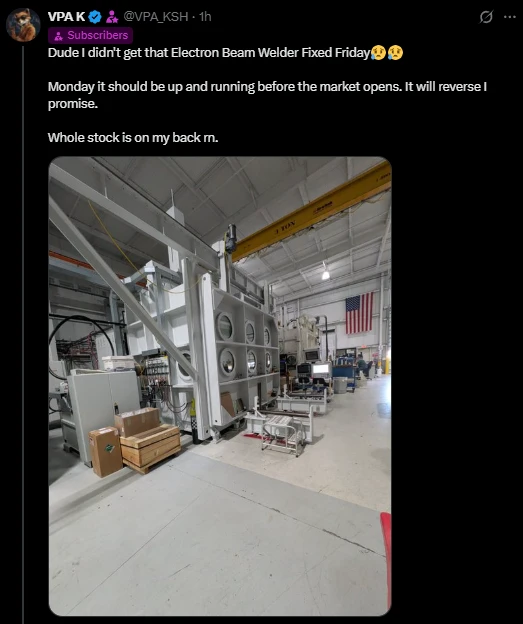
This is what I love about America. It's the people, the culture, and the work ethic.
Americans I know work hard, whether they're lawyers or technicians, bartenders or finance professionals.
That American flag hanging there is a 10/10. The patriotism is incredible.
A quote from me that my friends love "If you don't celebrate your own traditions, then eventually you'll have to celebrate somebody else's traditions."
post-image
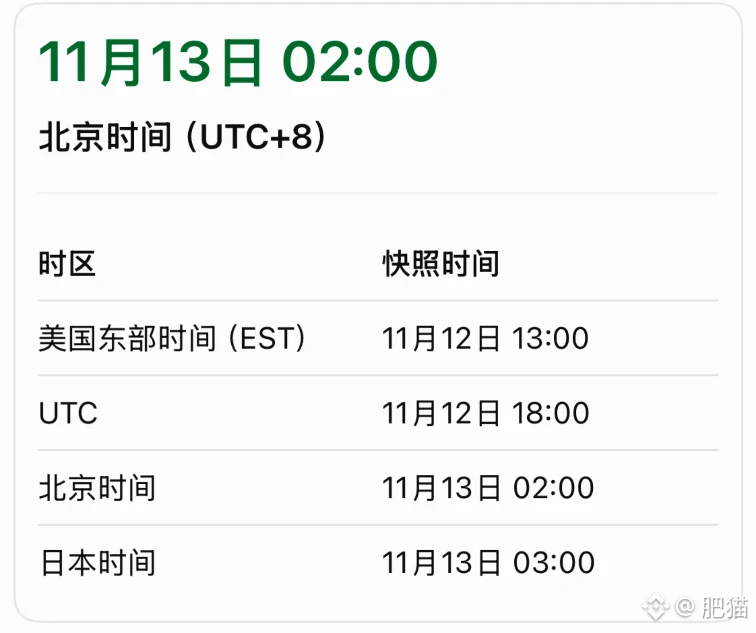
Those who didn’t buy turmp around 1.5x–1.6x don’t need to chase it now...
This is probably because of the November “dinner” snapshot. The pump is much slower this time than before...
There’ll still be selling pressure after the snapshot ends, so don’t get too attached...
post-image
  • 5
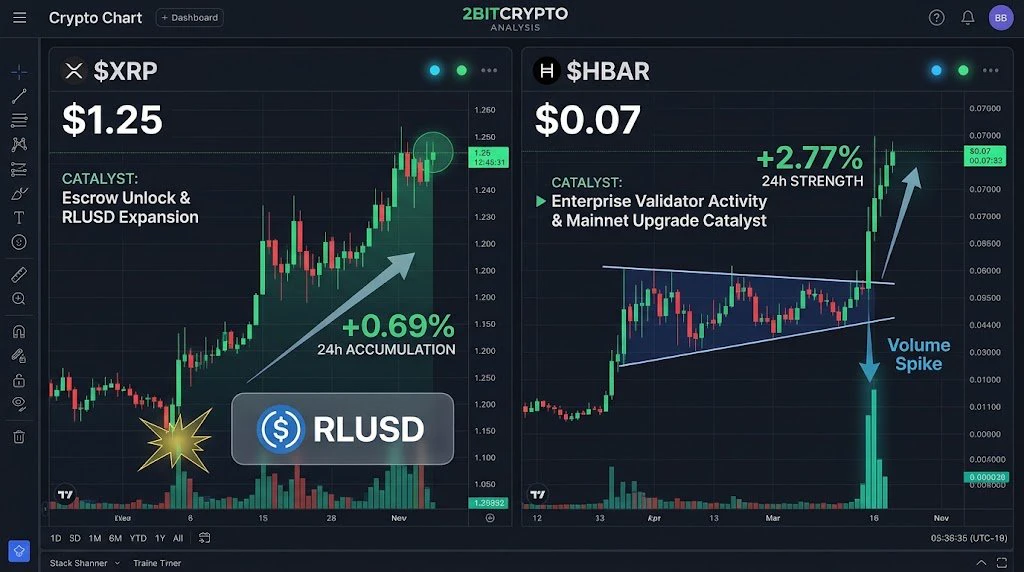
Retail is getting chopped up on the 15-minute charts, but the on-chain accumulation footprint is the only chart you need to see today.
We are tracking a massive divergence in order flow: $XRP ($1.31) is seeing heavy bank-side spot buying driven by the $RLUSD rollout
Then $HBAR ($0.076) just printed a massive spike in institutional RWA tokenization volume on the mainnet.
Stop trading the noise. This week is about to get good !
post-image
XRP-1.15%
RLUSD+0.00%
HBAR-1.36%
RWA-0.39%
$INJ network continues to grow its real-world asset (RWA) footprint, featuring partnerships like BDACS (making the KRW1 Korean won-pegged stablecoin an exclusive RWA settlement asset) and native USDC integration via Circle CCTP.
Price Range: ~$8.00 – $9.60 USD
Circulating Supply: ~99.97M – 100M tokens (fully unlocked)
INJ-1.67%
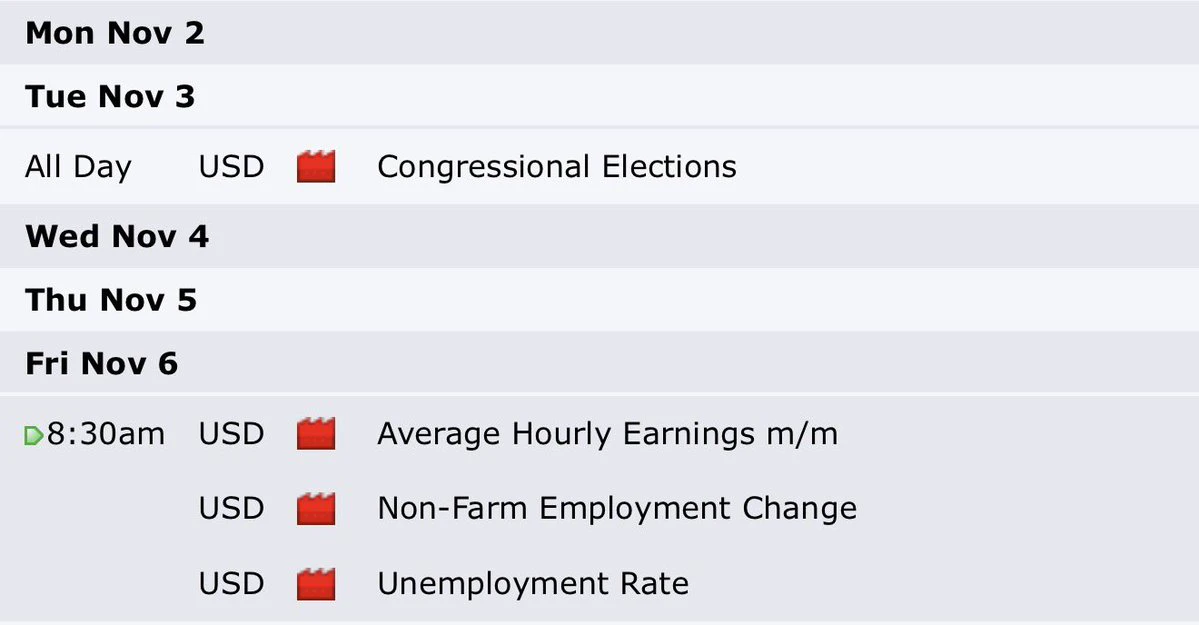
Economic Calendar Outlook👁️
𝗠𝗼𝗻𝗱𝗮𝘆: Trade Day (wait for 9:30am) ✅
𝗧𝘂𝗲𝘀𝗱𝗮𝘆: Trade Day (wait for 9:30am) ✅
𝗪𝗲𝗱𝗻𝗲𝘀𝗱𝗮𝘆: Trade Day (wait for 9:30am) ✅
𝗧𝗵𝘂𝗿𝘀𝗱𝗮𝘆: Trade Day (wait for 9:30am) ✅
𝗙𝗿𝗶𝗱𝗮𝘆: Trade Day (wait for AFTER NFP) ⚠️
Our Roadmap🗺
post-image
Money is coming this November
post-image
$INIT This 14.56% surge came with 24h trading volume hitting 32.4M, but don’t rush to chase it—the real backdrop today is Nasdaq futures trading sideways on lower volume ahead of the Fed minutes, the Dollar Index stuck near 104.2 without a clear direction, and crude oil held at $82 by the Middle East risk premium. I looked at the data for the past three months: the 30-day rolling correlation between BTC and Nasdaq futures is still 0.68, meaning crypto isn’t moving independently right now—it’s following macro liquidity expectations. $INIT This kind of small-cap pump is essentially in-market cap
INIT-2.53%
NAS100-0.07%
BTC-0.67%
  • 7
  • 1
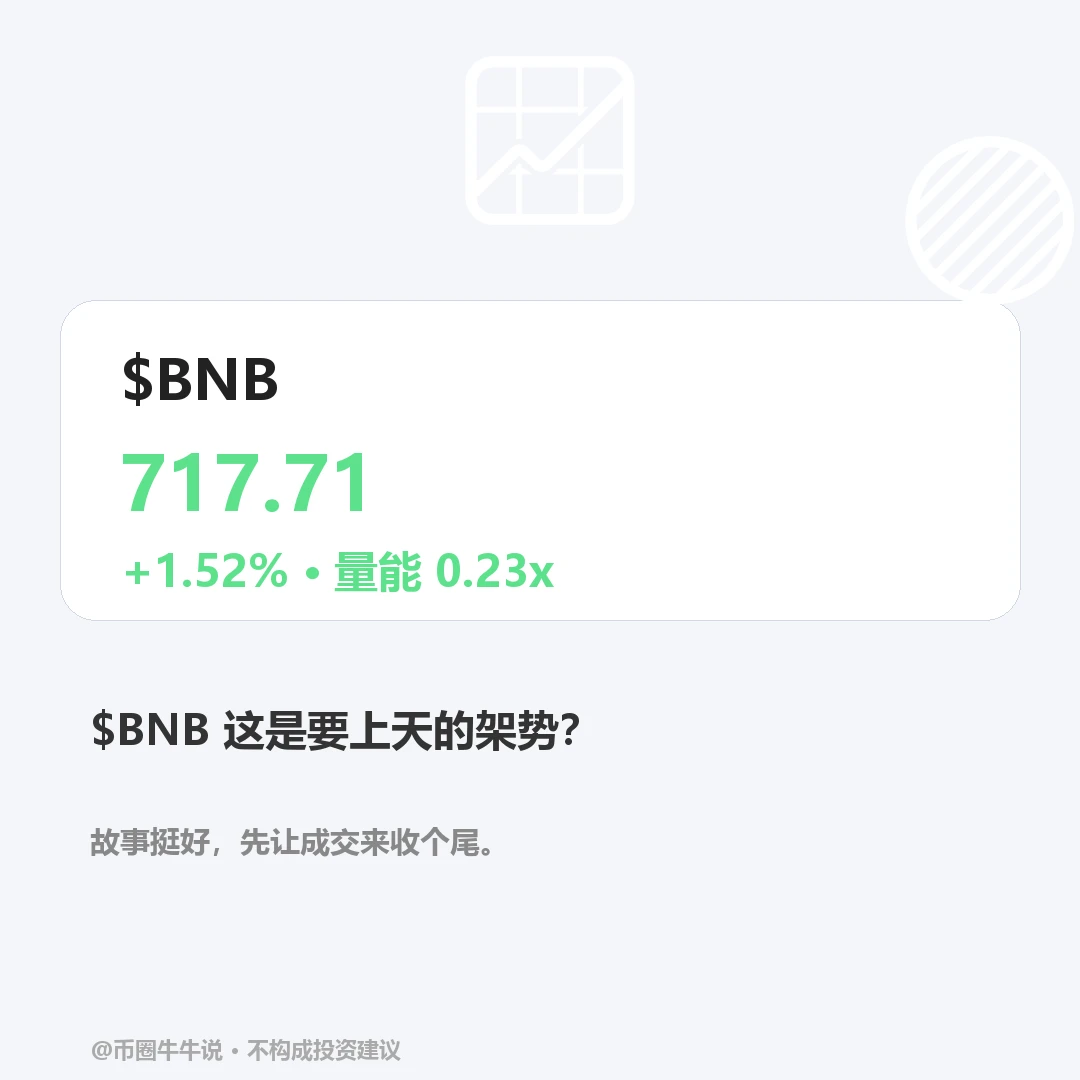
Strong, but crowding at elevated levels is already more concerning than the gains themselves. $BNB is currently at 717.71, with both the one-hour and four-hour trends looking strong, but the price is almost right at intraday resistance, while the short-term chart shows no volume confirmation. If the first pullback can't even hold intraday support, can this rally continue?
The one-hour RSI has entered overbought territory, while the four-hour RSI remains strong but not extreme. Although the price is above the one-hour moving average, volume is less than a quarter of its average, making this str
post-image
BNB-0.76%
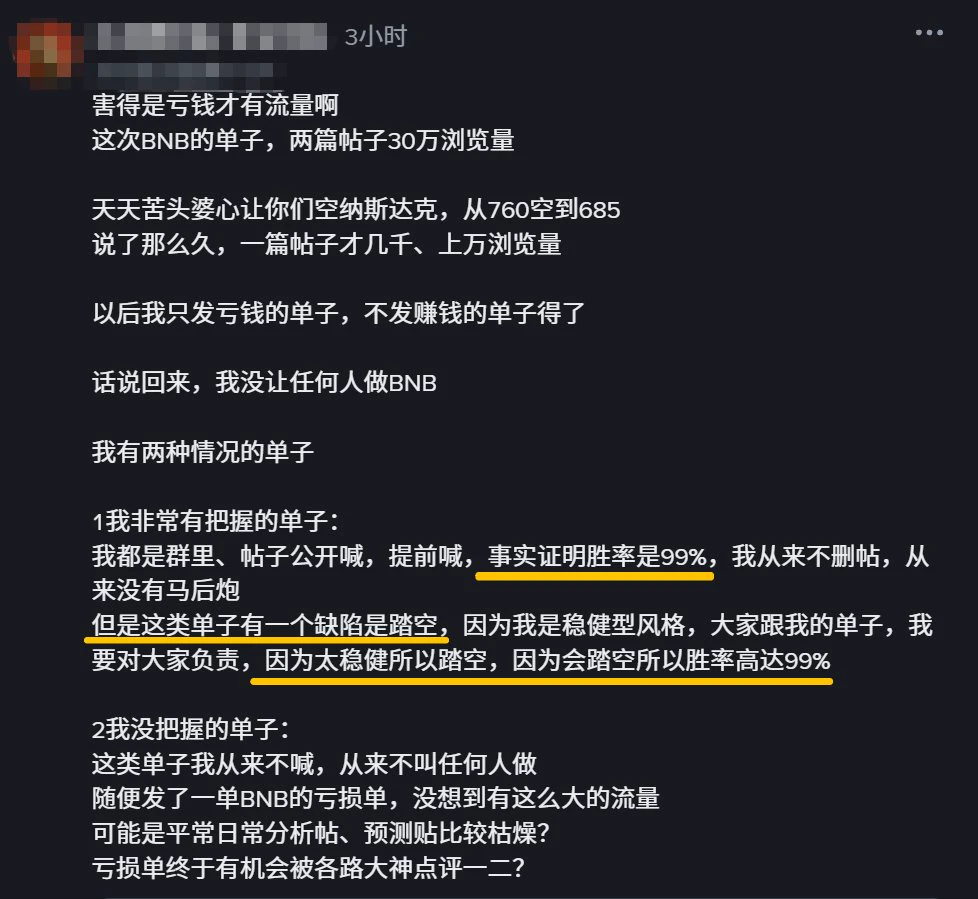
1、People who emphasize their win rate usually have absolutely terrible risk/reward ratios—they’d love to take profit at 0.1% and set a 20% stop loss...
2. Those who emphasize how conservative they are, even saying they often miss the move, are basically “phantom entry” gurus. For example, with Bitcoin at 70k, they call for 50k; at 50k, they call for 30k. When they’re short, it’s 70k calling for 90k, then 80k calling for 100k. The price never reaches their target before reversing, but since they got the direction right, they can still say, “My analysis was fine—I was just too ‘conservative,’ so
post-image
  • 11
  • 1
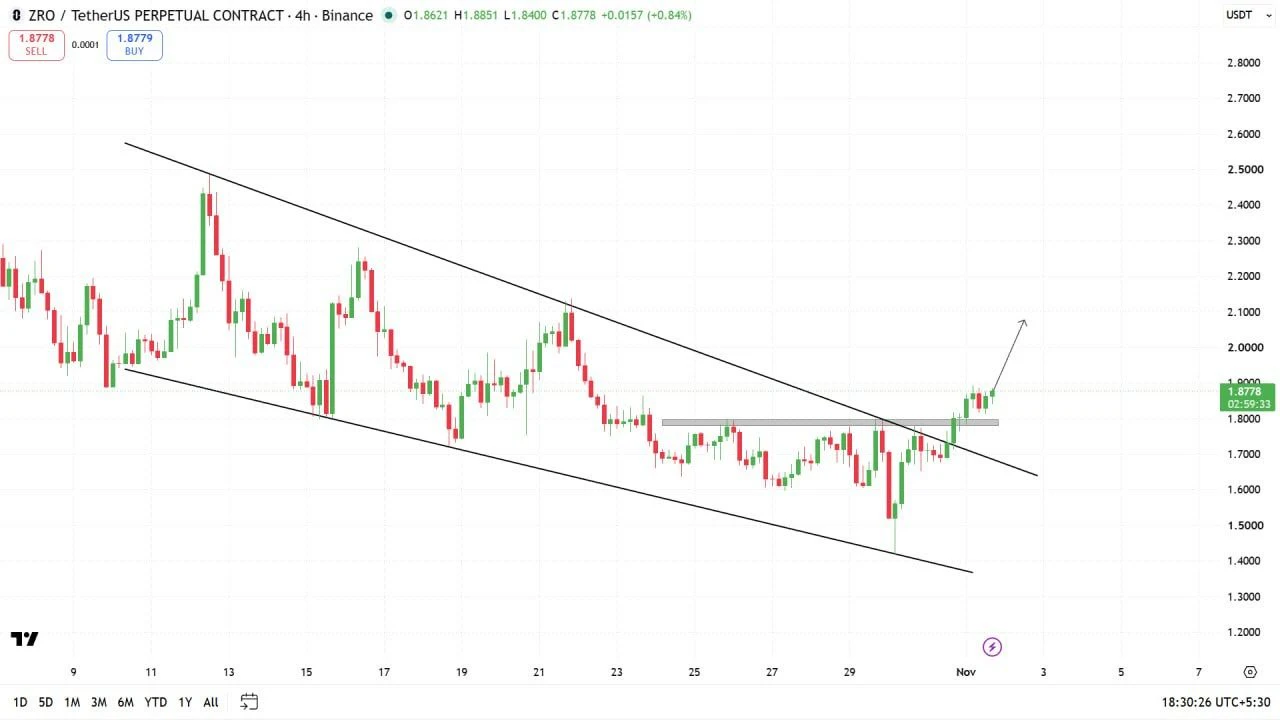
$ZRO is setting up for an exciting move!
After weeks of downward pressure, the chart is finally showing signs of strength.
A clean escape from the falling trendline has opened the door for a fresh upward expansion.
The recent surge toward $1.88 suggests buyers are becoming more aggressive.
The $1.75–$1.80 area is now an important zone to watch for continued strength.
If demand stays strong, price could challenge $1.95 before attempting the $2.10 region.
Momentum is building, and the next few 4H candles could be crucial.
$ZRO might be entering a new bullish phase. Watch closely!
post-image
ZRO-2.59%
  • 1
#Gate广场万圣节 $BLESS The short-term pullback has run its course; now is the best entry point, with a major rally ahead. Go long now!!!
post-image
BLESS-2.00%
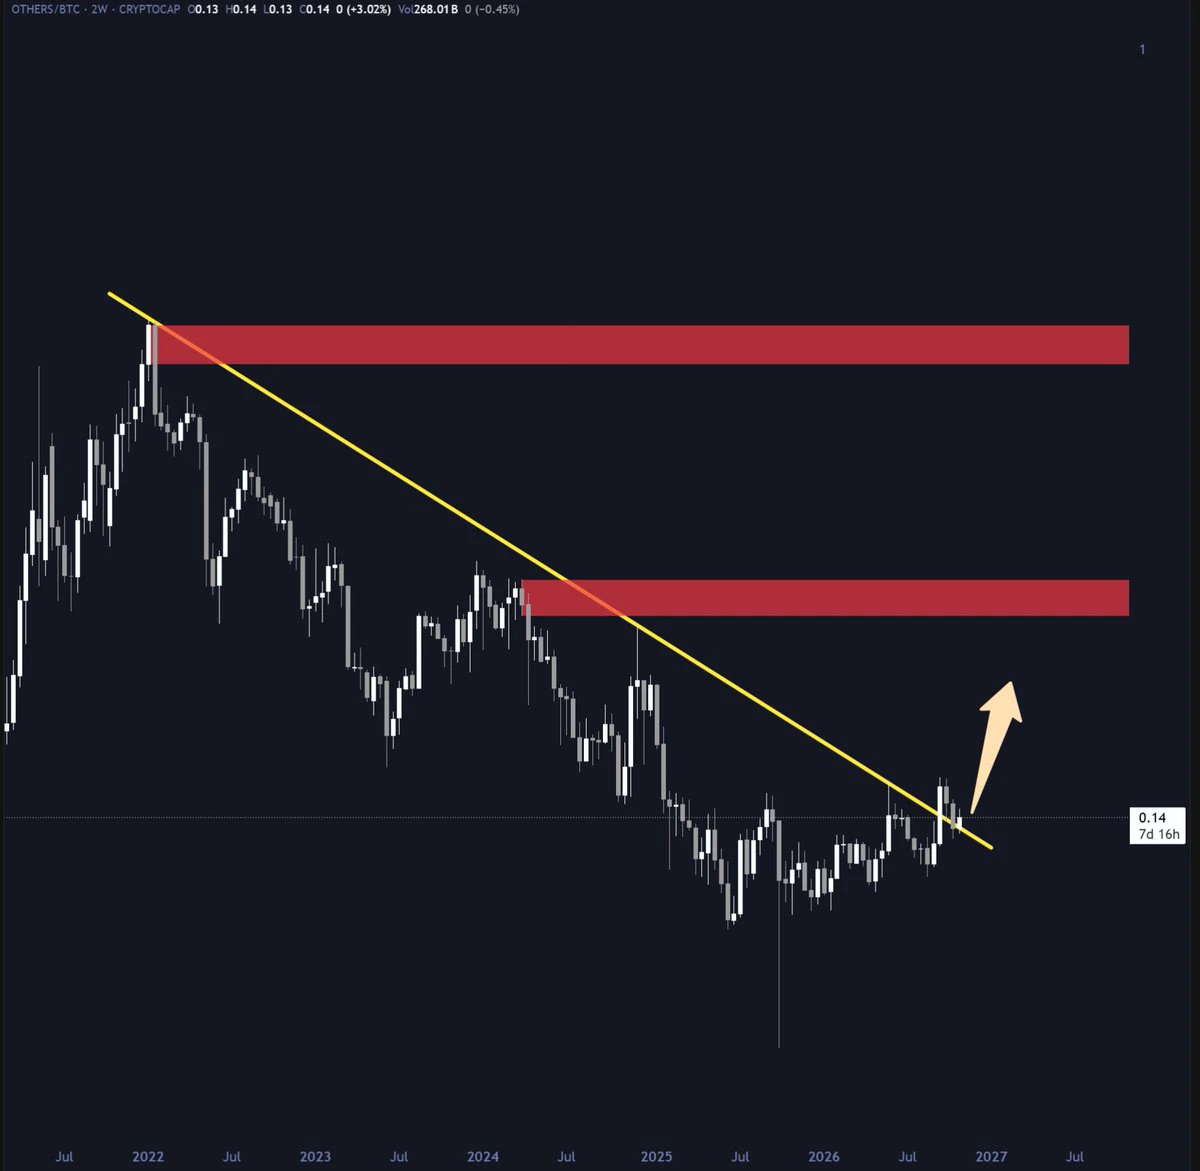
Alt/BTC broke out of its 4 year downtrend and has now flipped that into support
This is not where you get bearish
post-image
ALT-1.40%
BTC-0.67%
Ethereum staking volume hit an all-time high, with the annualized yield falling to 2.63 percent
live-cover
LIVE1,997
🔥 $UNI $Bearish pattern forming!: Uniswap has bounced from its recent low and is approaching a key resistance zone. Despite a recent 4.84% rebound, the price is still facing selling pressure around the 7.30–7.50 range. A rejection here could present another downside opportunity.📉Trade idea: Short $UNIEntry: 7.300 – 7.500Take-profit 1: 7.100Stop-loss: 7.800Take-profit 2: 7.000Take-profit 3: 6.885Trade here $UNI : 👇
post-image
UNI+3.05%
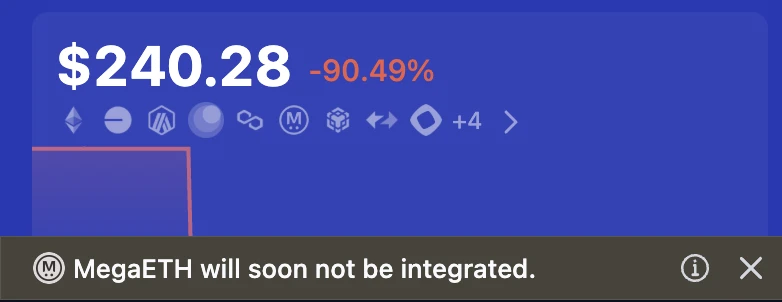
Rabby is removing MegaETH from the supported blockchains.
[Insert the oof meme] because this must hurt.
post-image
MEGA+0.26%
Load More

Join 40 M users in our growing community

⚡️ Join 40 M users in the crypto craze discussion

💬 Engage with your favorite top creators

👍 See what interests you

Trending Topics

BTC大跌

478.6k Views39.86k Discussing

$BTC briefly fell below $77,000 and remains under pressure around the $77K zone, with its 24-hour decline still above 4%. With risk appetite weakening and Fed uncertainty rising, where is the next key support after losing $80K?

IntelBeatsEarningsButStockPlunges

43.38k Views1.06k Discussing

StrategySTRCNears100ParValue

51.71k Views4.21k Discussing

View More