




Square
Following
Hot
News
Profile
Share your thoughts
placeholder
Article
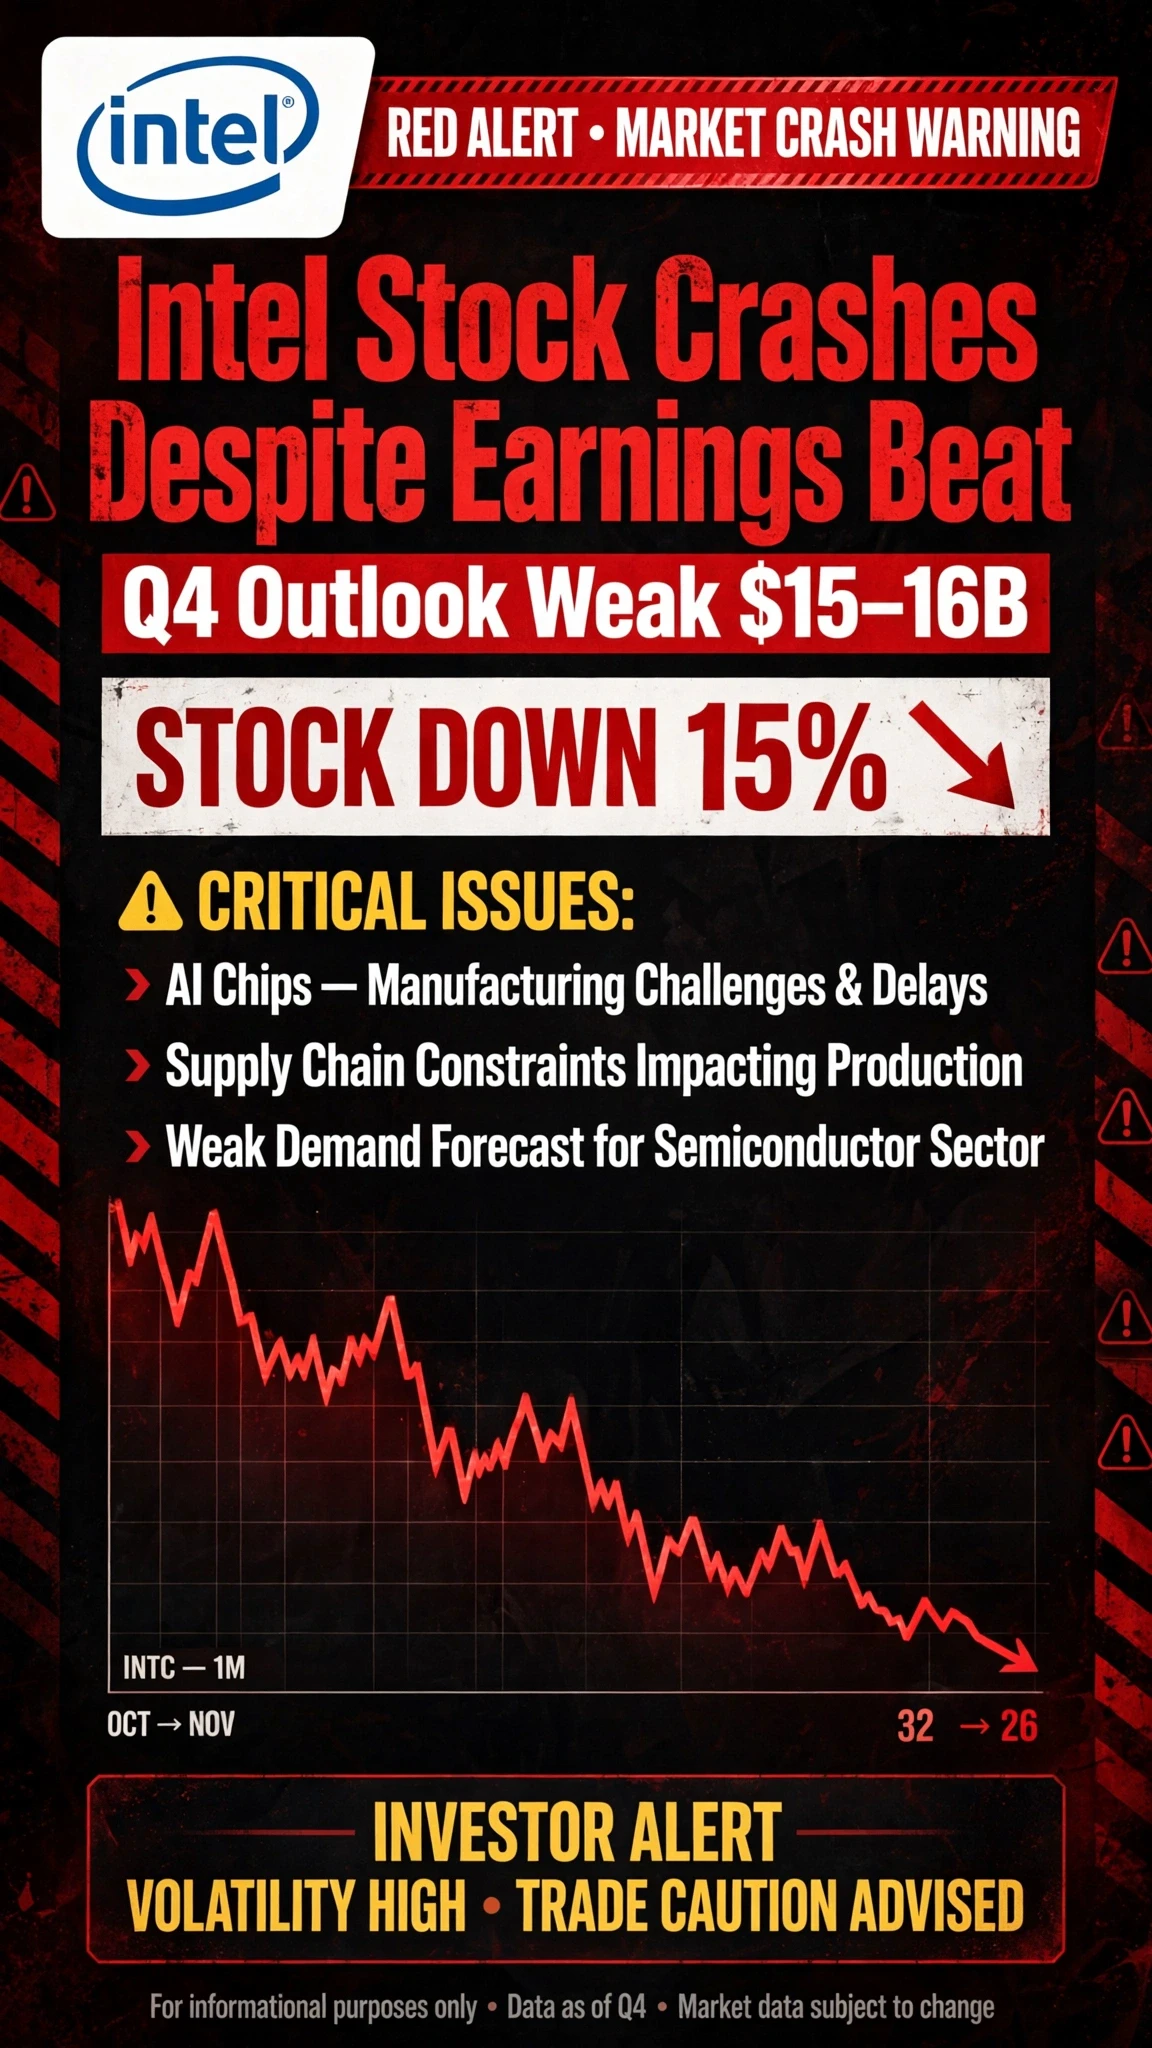
#IntelBeatsEarningsButStockPlunges🚀 Intel Beats Earnings But Stock Plunges – What Happened?
Intel has surprised the market with stronger-than-expected quarterly earnings, but its stock price has faced a massive decline. This situation shows that good financial results do not always guarantee a positive reaction from investors.
In the third quarter of 2026, Intel reported revenue of approximately $16.5 billion, representing 21% growth compared with the same period last year. Adjusted earnings reached $0.52 per share, beating market expectations of $0.40.
Despite these positive results, investo
post-image
INTC-28.49%
#USEarningsSeason $XRP is the infrastructure and RLUSD is the value itself, then why does XRP itself need value? Why would the price of $XRP need to reach $1,000 or $10,000? Is it because its on-demand liquidity does not require upfront capital investment? If so, with a total supply of 100 billion XRP and SWIFT's daily transaction volume of $5 trillion, if XRP handles all of these transactions, would the price of XRP only be $50?
If we assume that global transaction volume will double over the next 5–10 years, or that Ripple might withhold half of the total XRP supply from the market to create
XRP-1.15%
RLUSD+0.00%
ETH-1.26%
  • 1
Trenches
ZIG
Z
bade
b
ZIG
0x8c...1145
Market Cap
$.
Change
.
24h Vol
$.
Holders
.
IDOL
I
bade
b
IDOL
0x3b...ab07
Market Cap
$.
Change
.
24h Vol
$.
Holders
.
SAFU
S
bade
b
SAFU
0x7c...7777
Market Cap
$.
Change
.
24h Vol
$.
Holders
.
Q
Q
bade
b
Q
0xc0...0589
Market Cap
$.
Change
.
24h Vol
$.
Holders
.
STONK
S
bade
b
STONK
6GmA...UNgx
Market Cap
$.
Change
.
24h Vol
$.
Holders
.
10.31 BTC Analysis
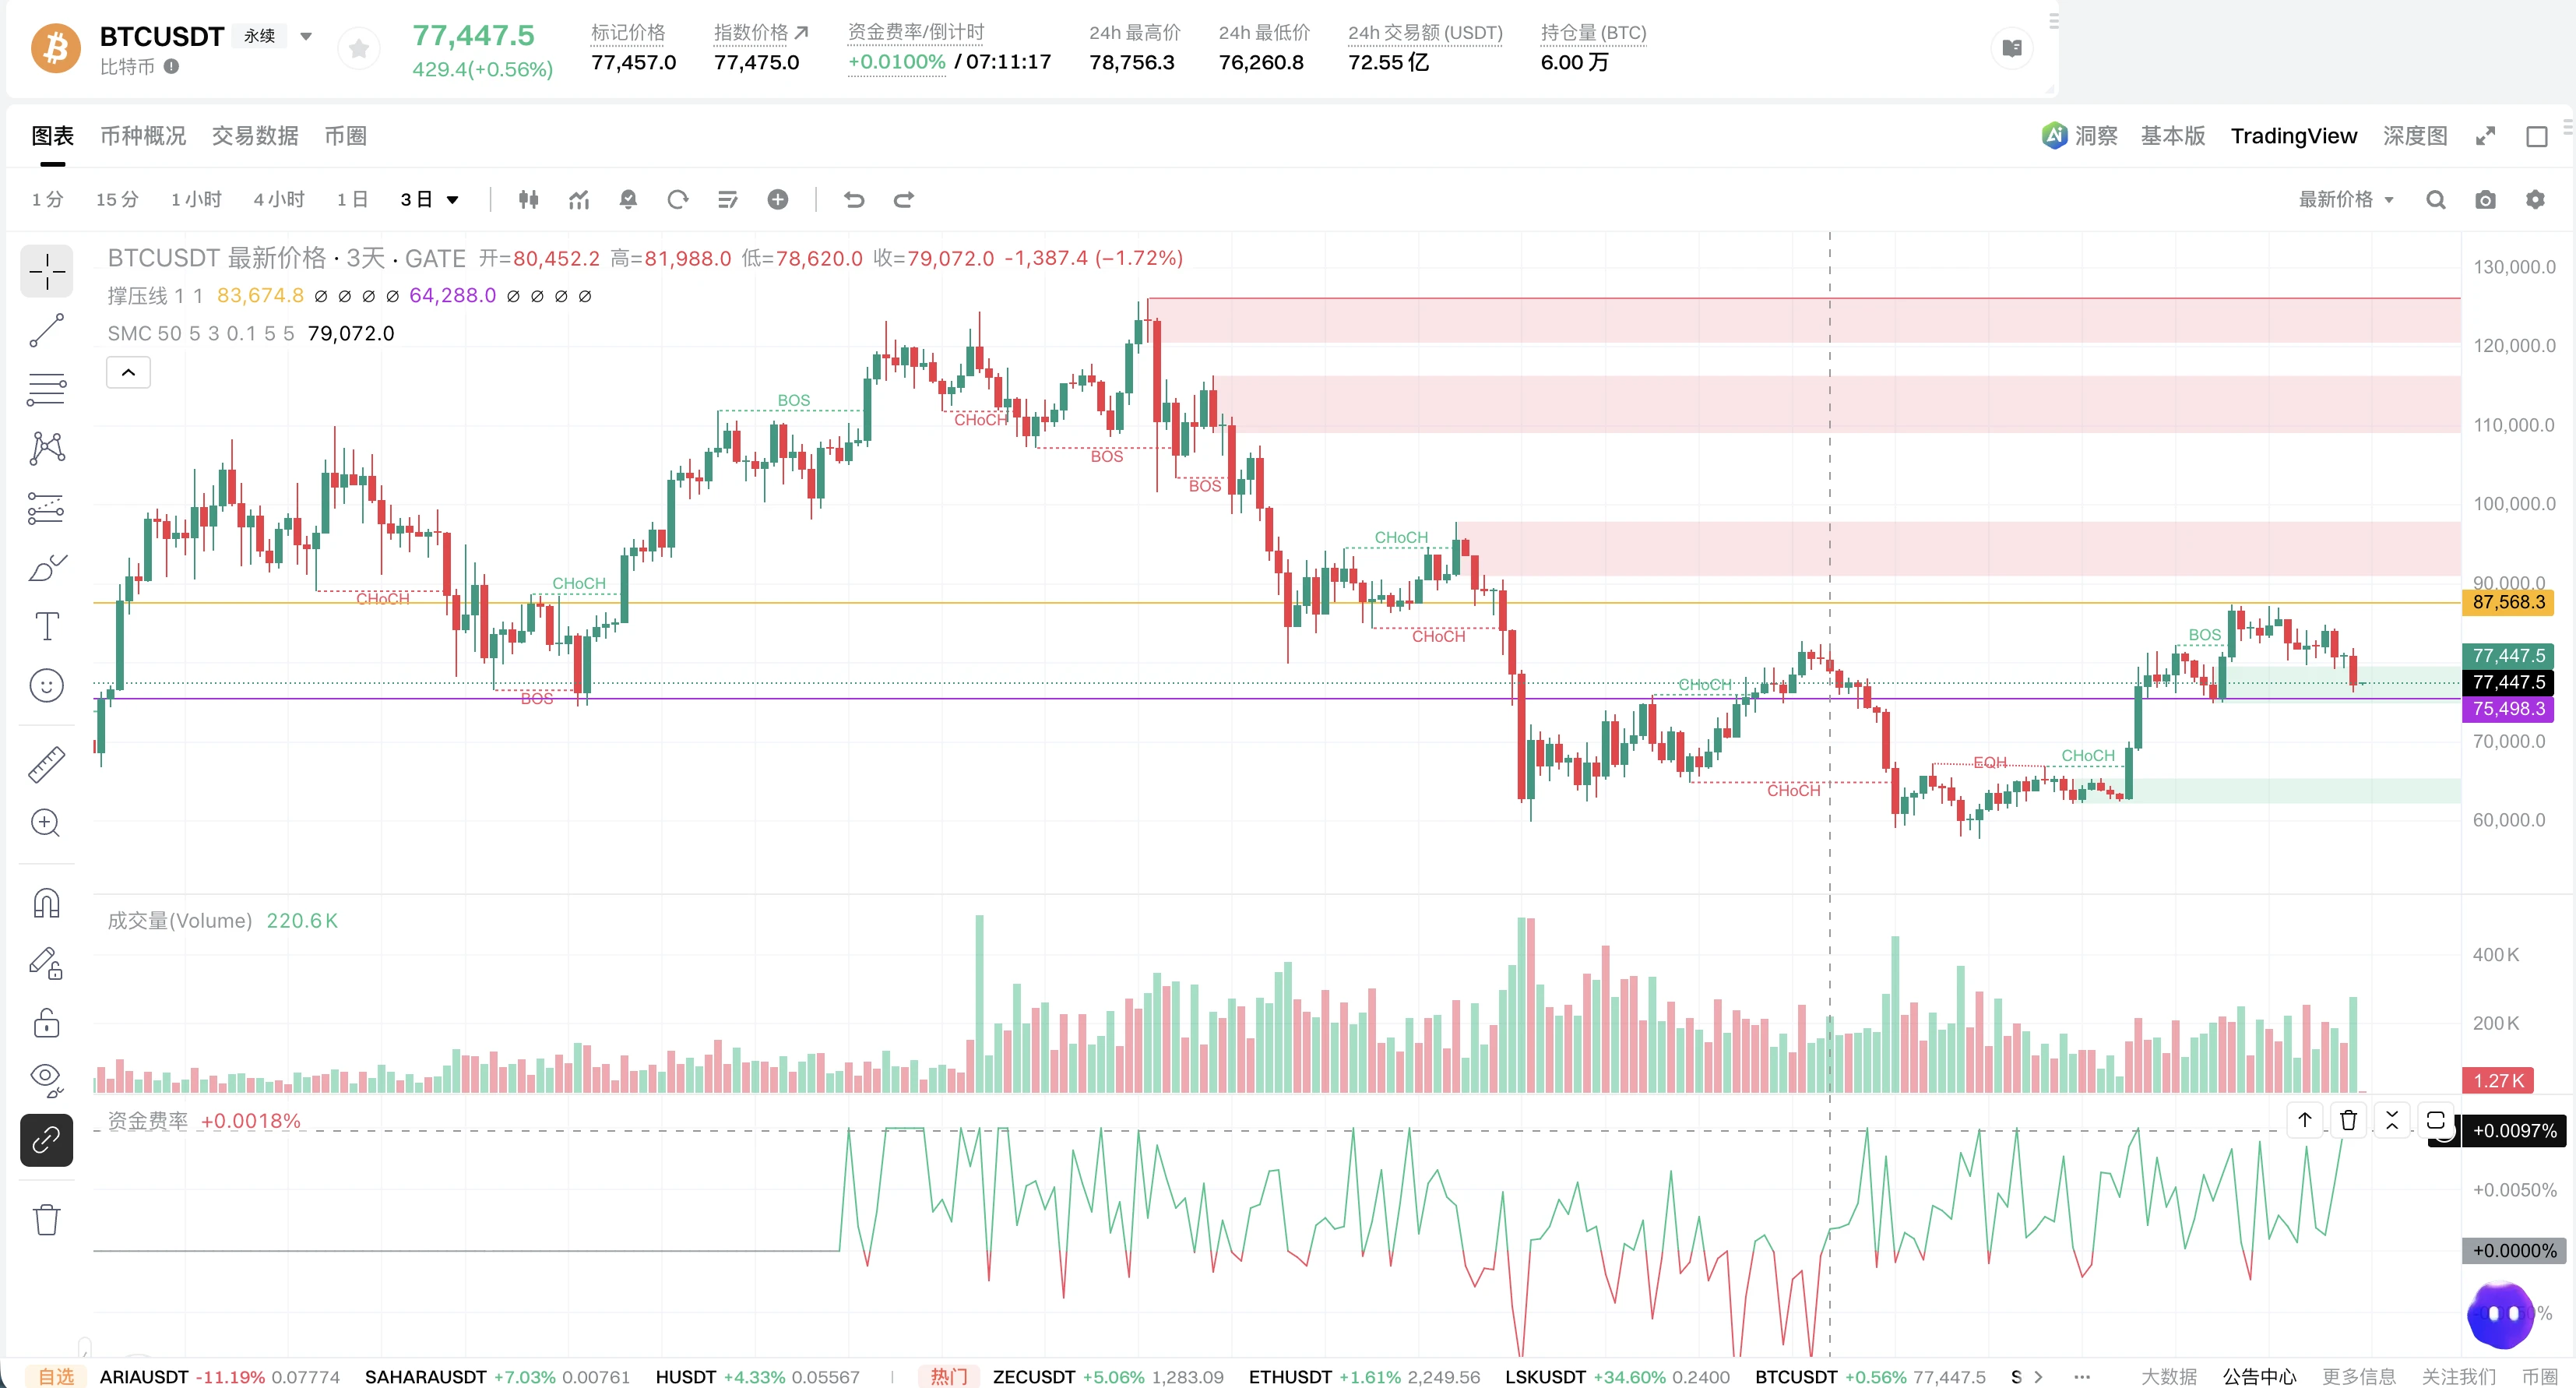
The market is in a weak, choppy bottoming phase following a sharp decline. With liquidity scarce over the weekend, trading has been subdued. As the monthly candle closes today, both bulls and bears are becoming more cautious, and the market is showing a typical low-volume recovery pattern. After plunging from a high of 81953 to 76270, bearish momentum has largely been released, and the price is now staging a weak rebound near 77535. Technically, the 1-hour candlestick has barely stabilized above the middle Bollinger Band, but the moving averages remain under pressure and the
post-image
BTC-0.67%
~ $BTC ~
GM Folks! ☀️
WHO BROKE THE MARKET?! 😂
I'm away for just TWO days, and #BTC decides to take a dive!
Can't leave you lot unsupervised for a minute!
Bugger! 🤣🔥🔥🔥
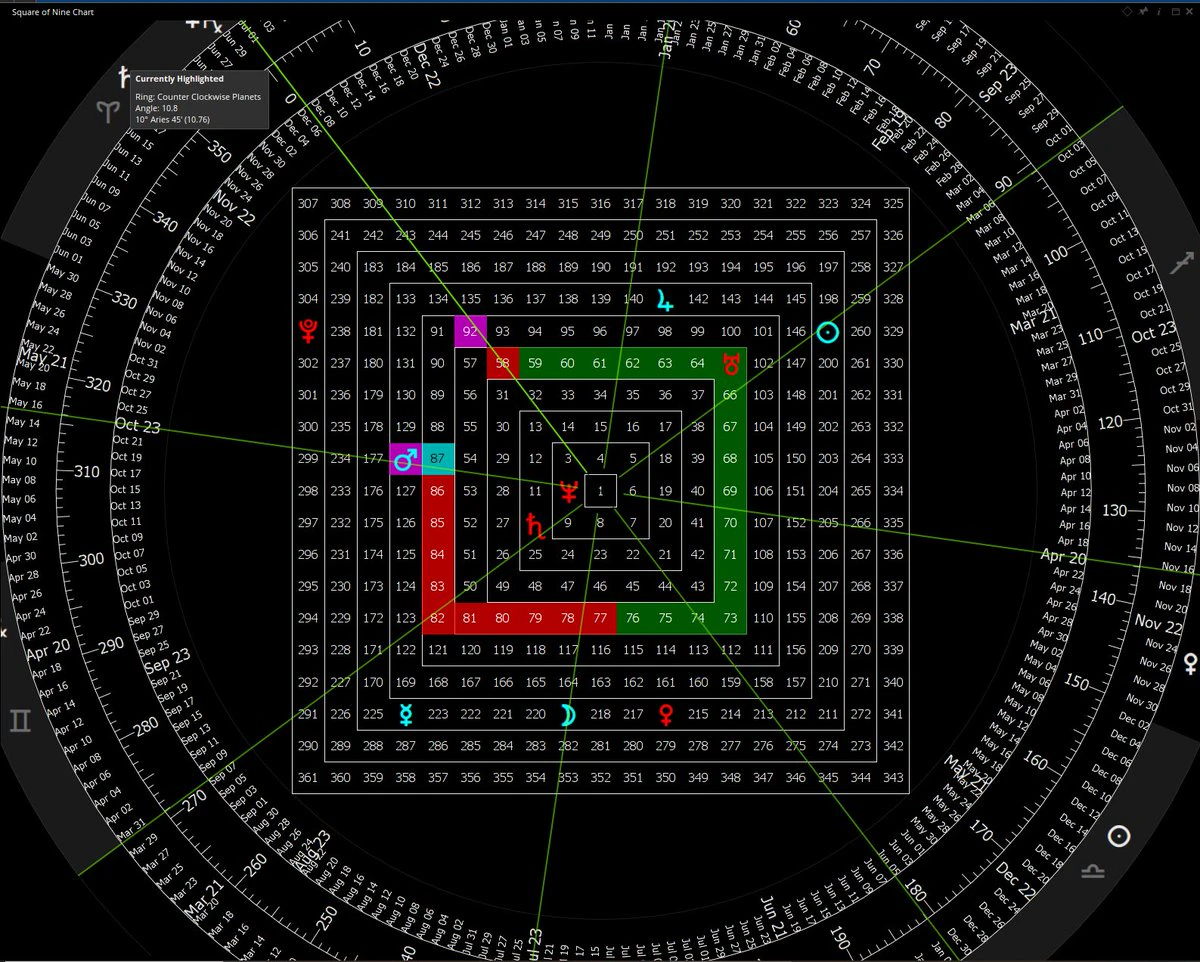
The #SQ9 chart warned us what was on the cards if $82K wasn't reclaimed, straight down to $77K!
Now, here's what I'm watching:
Hold $77K → A bounce back towards $82K again is on the cards. Reclaim that, and my original $92K target comes back into play.
Lose $77K → $74K becomes the next target, followed by $70K.
The levels are there. The market decides which path we take.
Possibilities, not certainties!
Enjoy! 🔥🔥🔥
post-image
BTC-0.67%
Quant, which builds tokenized deposit rails for The Clearing House and 7 UK banks, says a Singapore supplier can be paid once a London bank locks the funds.
Today that can take days.
@quantnetwork
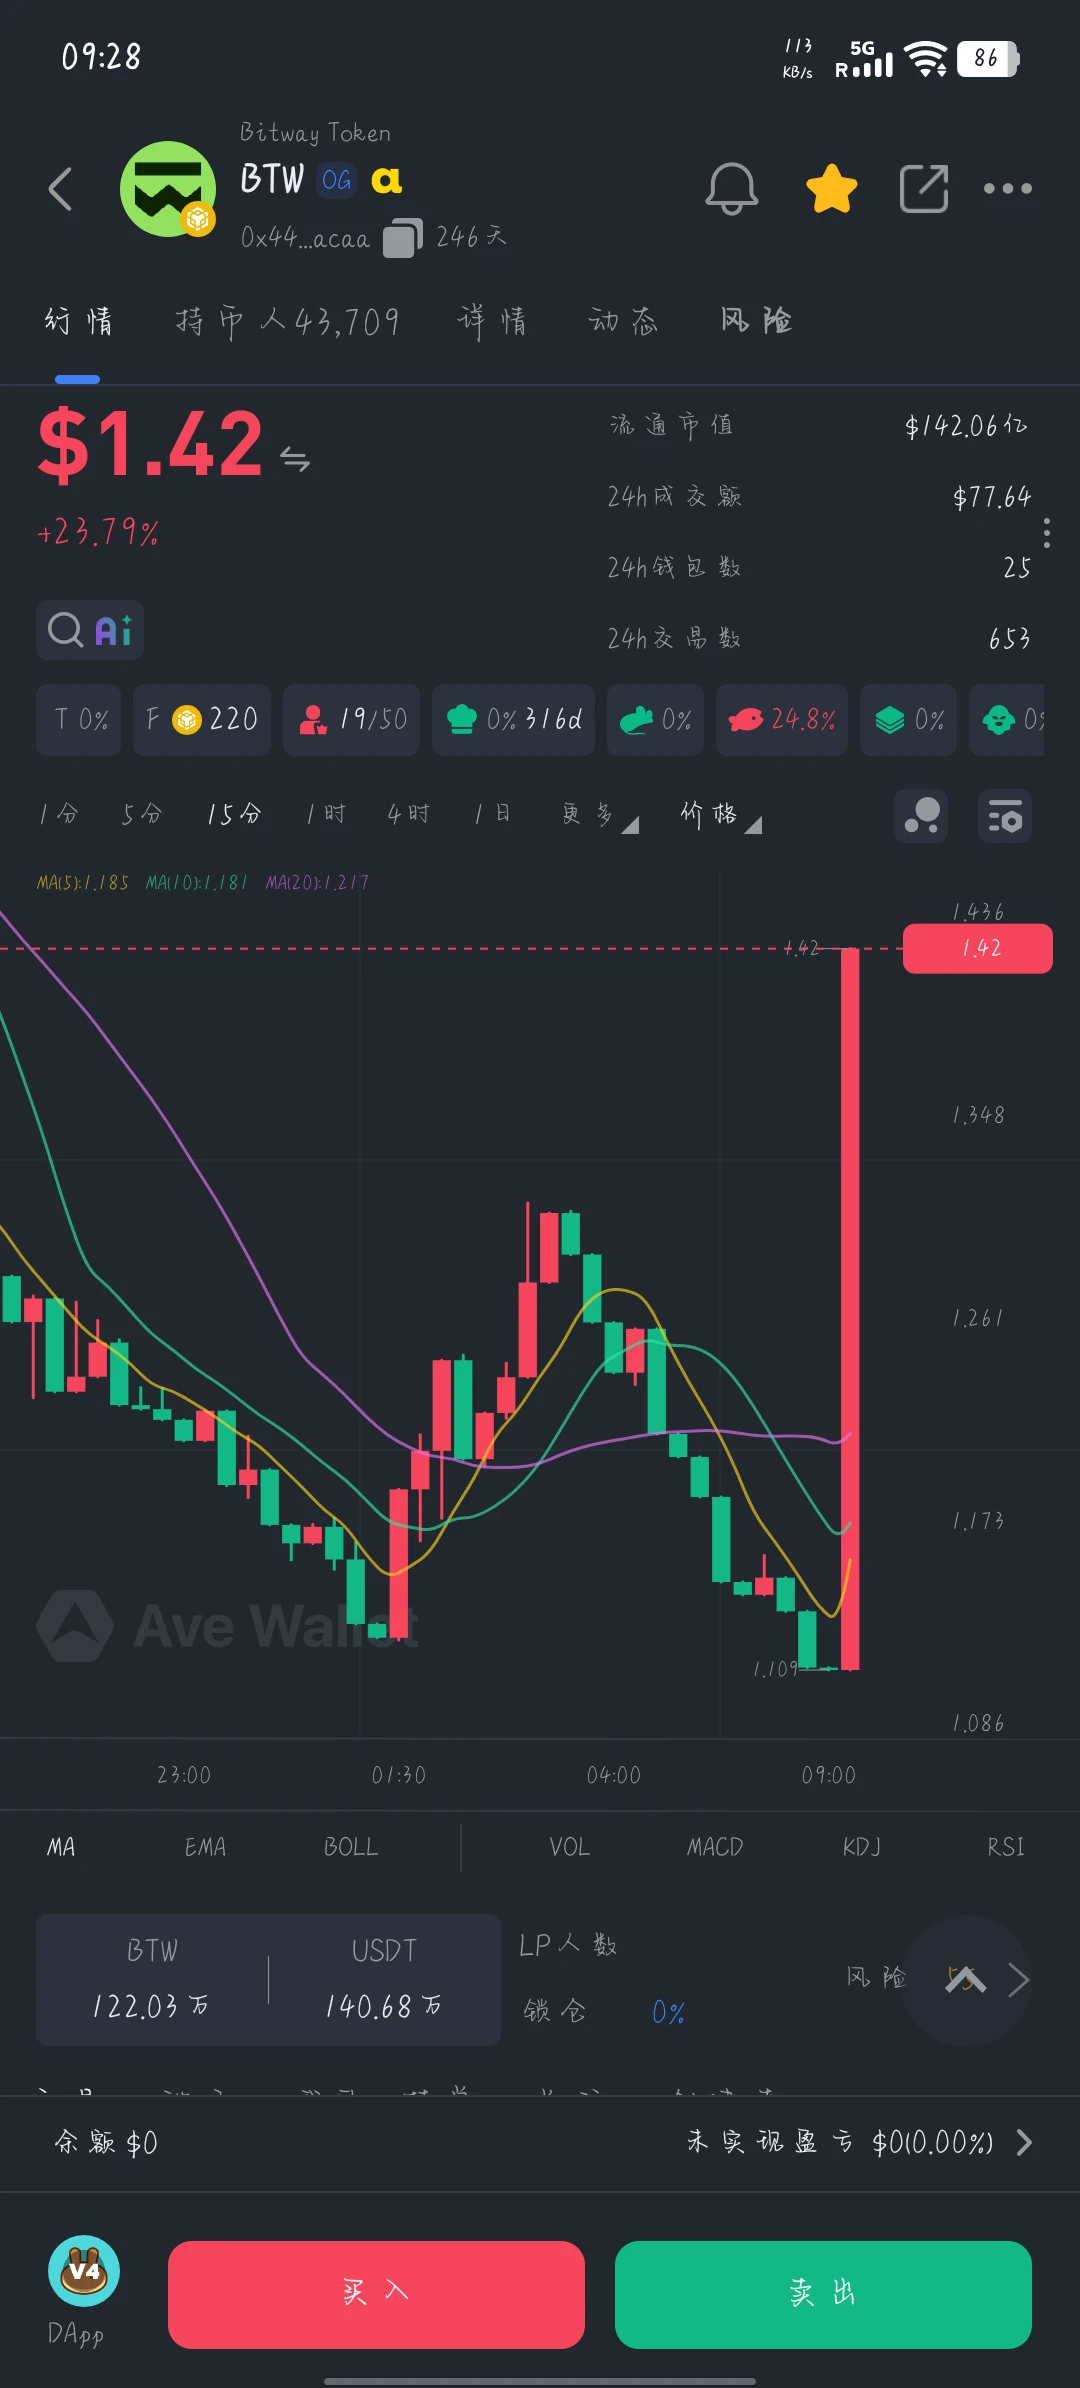
$BTW What is this supposed to mean? Spot has pumped hard, and this one isn't going up? Are these coins from two different worlds?????
post-image
BTW-7.42%
Why Doesn’t Price Necessarily Fall Immediately When MACD Shows Bearish Divergence?
In the crypto market, when prices keep making new highs while the highs on the MACD indicator gradually decline, bearish divergence may be forming. Many traders view this as a short signal, but bearish divergence indicates that upward momentum may be weakening; it does not mean the price will necessarily fall immediately.
First, understand what bearish divergence means.
Bearish divergence usually occurs when price highs keep rising while the corresponding MACD highs gradually decline. This may indicate that upwa
post-image
Woke up from a nap, and the kitty had chewed out the stitches on her belly herself👿
Last night, I saw she’d fallen asleep and worried the cone was bothering her, so I took it off… and then she chewed through her surgical stitches😭
post-image
Good morning, Zuo Zuo has a recap of last night’s U.S. markets for you☕
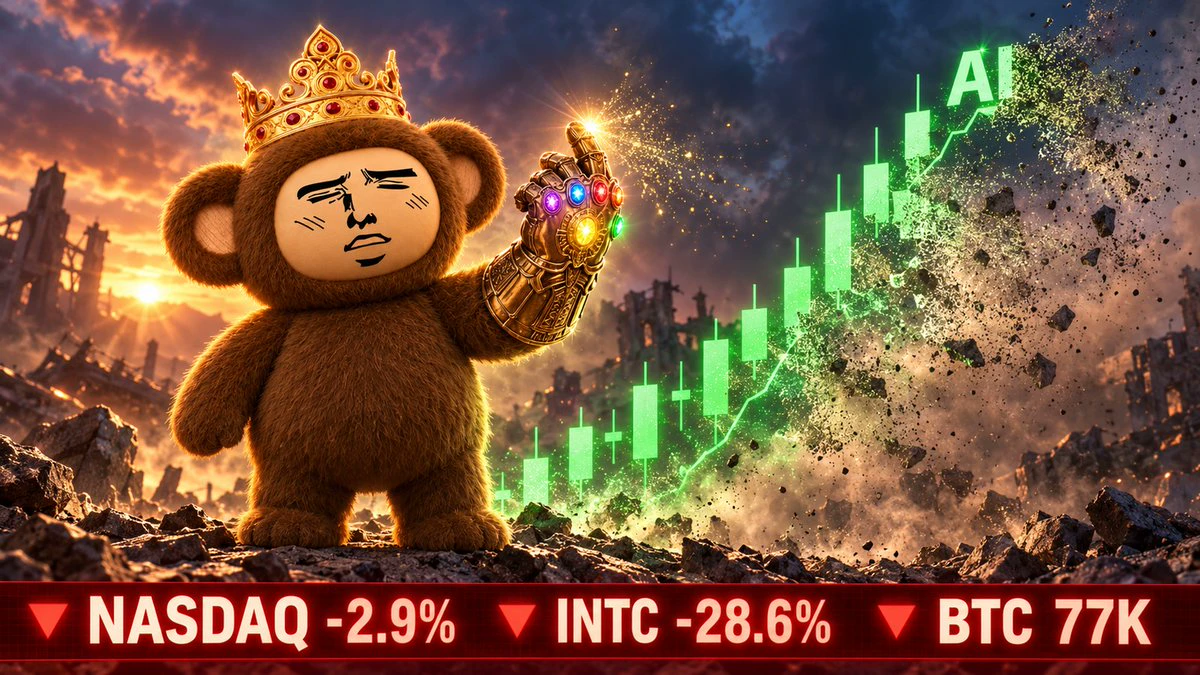
On the last trading day of October, AI giants’ earnings were all tallied up—and the market marked them down across the board📉
At the close:
Nasdaq -2.9% to 25,437, down 5.3% for all of October—its worst month since March last year
S&P 500 -1.8% to 7,580
Dow -1.1% to 51,770
The hardest hit was $INTC:
Down 28.6% in a single day to $65.76. It had surged about 250% at one point this year, then gave back nearly a third overnight
The U.S. government’s 10% stake lost about $12 billion in a day
Nvidia -4.2%, while Amazon and Alph
post-image
INTC-28.49%
AMZN-1.55%
BTC-0.67%
#WCTCS9 #ShareWeekly
My positions for the weekend
Current technical data indicates that Bitcoin is under short-term selling pressure, with daily and weekly signals currently in conflict. I advise against chasing a recovery move until resistance levels are reclaimed.
Support 1 $76,200–$76,600 Initial support level
Support 2 $74,900–$75,200 Secondary support level
Support 3 $71,900–$73,700 Deeper decline zone
Resistance 1 $78,200–$78,600 First hurdle for a recovery
Resistance 2 $79,500–$80,000 Key resistance level
Resistance 3 $80,700–$82,000 Zone for a stronger breakout
Potential BTC trading
BTC-0.67%
XAUUSD-3.63%
AVGO-2.36%
NVDA-4.16%
MU-5.28%
  • 6
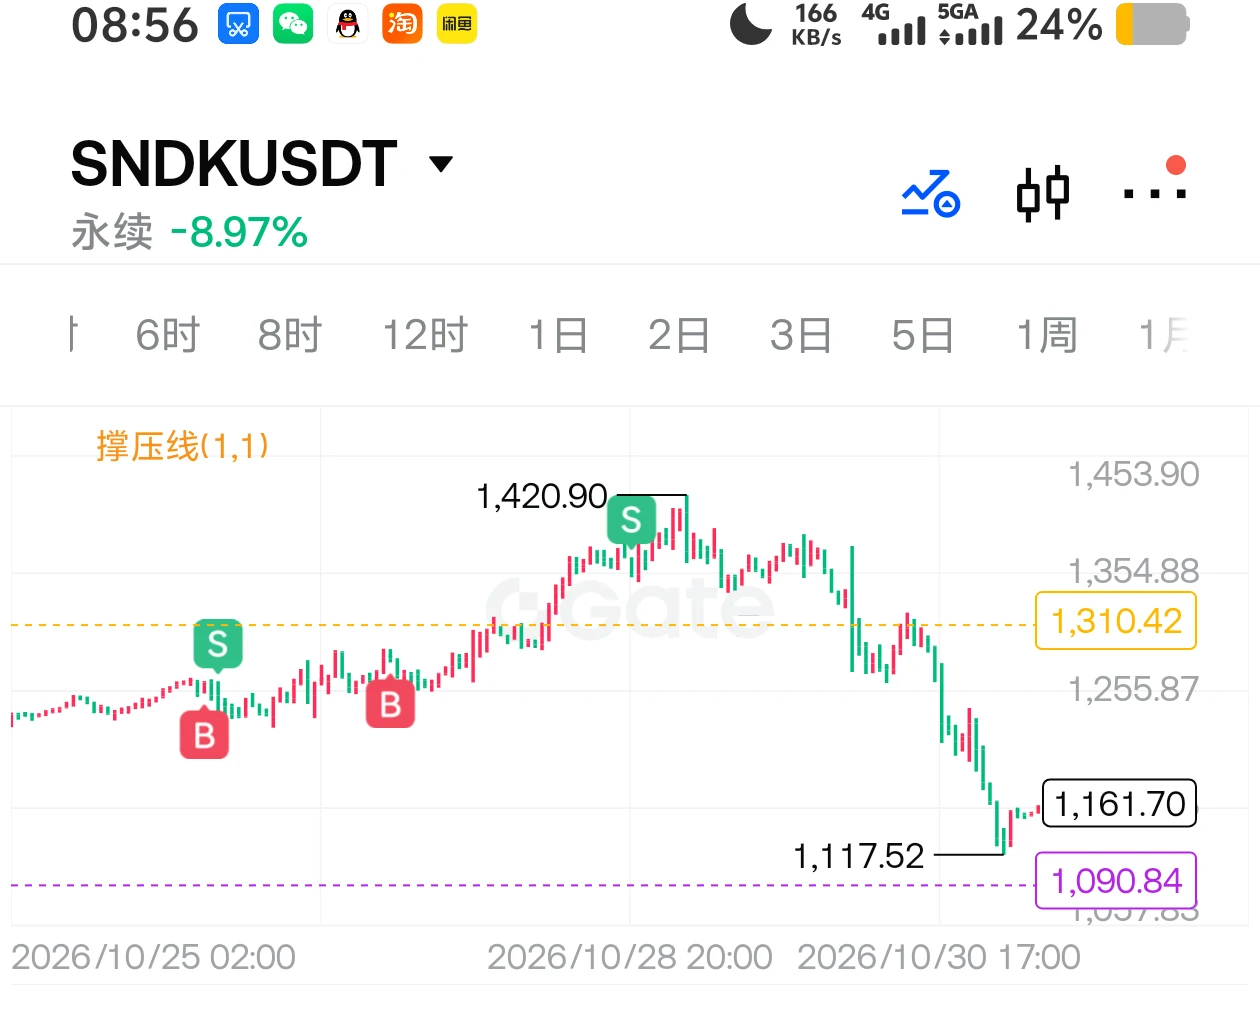
I predicted SanDisk’s move before its earnings report came out. The market always rewards those who know first and check first the most.
post-image
UchihaUltraShort
Although I focus on very short-term trading, I’m also quite good at macro trading. A lot of people don’t understand macro trading and think it’s difficult, but it’s actually very simple. The essence of macro trading is taking advantage of Bitcoin’s high sensitivity to liquidity. Many people want to know whether this bull market is still underway. I can tell you for sure that it is, but it won’t last long,
Let me start with gold. People think that when an economic crisis hits, gold is sure to preserve its value and hedge against risk. That’s only half right. In the early stages of an economic crisis, it’s not just gold—high-quality stocks, such as SanDisk, and other highly liquid assets will all be sold off for cash. The market will reflect that money in the form of stabilization and a rapid rebound. So there will be a significant drop at first, followed by a surge as gold returns to its safe-haven role—in other words, first a drop, then a surge
Bitcoin and Ethereum work the same way. At first, they’ll be priced as risk assets alongside U.S. stocks. Crypto market movements usually lead those of other risk assets, and crypto bear and bull markets tend to arrive earlier than those of other risk assets. Right now, oil prices are high, institutional money is crowded into U.S. stocks, and there’s circular lending within the AI sector. The same thing happened during the 2008 financial crisis and the previous oil crisis: U.S. stocks experienced substantial pullbacks. So Bitcoin and Ethereum will definitely fall too. In the short term, U.S. stocks are in the early stages of a crisis. A crisis is about to unfold, so this bull market won’t last long, but it won’t be over either. Like gold, it will return to its safe-haven role in the medium term. After smart money flows out of U.S. stocks, it will look for new markets in which to grow its value—that means Bitcoin. The rebound after a bottom will be very strong, and in terms of timing and cycle, it should coincide with a mid-cycle rebound in U.S. stocks. So the early phase of this bull market will definitely feature a major bottom and a major rebound, moving in tandem with U.S. stocks. Ethereum could reach above 3,000 in this bull market; its recent low has been around 2,110 to 2,170,
Once it reaches 2,170, there will be plenty of intraday trading opportunities afterward
SNDK-13.60%
[New Streamer] Whales Moves in Sync!
live-cover
LIVE1,897
[NEWSTREAMER] market update
live-cover
LIVE1,270
  • 1
Hold positions over the weekend or stay in cash? Smart traders don’t leave all their chips on the table for Saturday!
Holding positions over the weekend is like taking a trip: the scenery may be beautiful, or a sudden downpour may hit. The key isn’t whether you dare to go out, but whether you’ve brought an umbrella!
My weekend strategy leans toward trimming positions appropriately and keeping cash on hand. BTC can be a core asset to watch, while with ETH I focus on its relative strength. As for more volatile altcoins, if there’s no clear trading thesis, I’d rather sit them out for now.
Reducin
MU-5.28%
  • 53
Is the economy really this bad now?
post-image
$6.3 billion stolen, BTC falls to $76,000! The crypto market has just weathered an epic security crisis, and now it’s betting on a rebound again?
On October 31, $BTC was trading at around $77,380, with a 24-hour low of $76,270 and a high of $78,776.
On the surface, the decline has stalled, but the rebound hasn’t even held above $78,000.
① The hack was worse than initially reported
On October 30, the platform involved issued a second official announcement, confirming that its hot wallet had been attacked, with losses of about $6.3 billion.
About $3 billion worth of related assets have been fro
post-image
BTC-0.65%
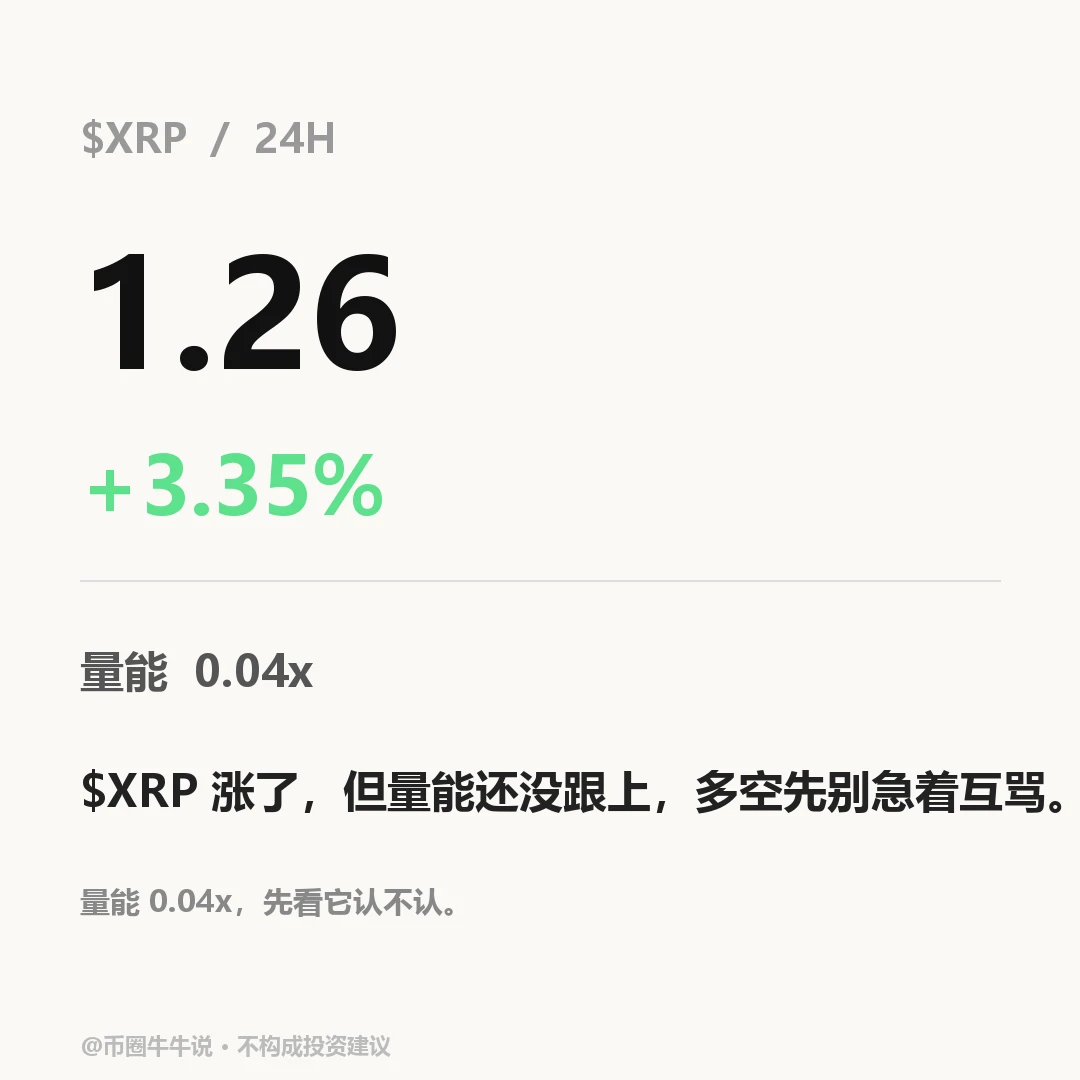
Divergence. $XRP is currently at 1.2595, with strength on the one-hour timeframe and weakness on the four-hour timeframe—the two timeframes are completely opposed. The one-hour RSI has reached 62.74, but volume is only 4% of the constant value. Can this “strength” really be taken seriously without genuine market participation backing it?
Price is hovering right at the 1.274 resistance level, but there isn’t enough volume to drive a breakout. The short-term strength looks more like the market dragging its feet. My view: the direction is not yet confirmed, and the easiest mistake to make now is
post-image
XRP-1.15%
BTC falls below $80k, and I actually start keeping a close eye on these prices!
Bitcoin has fallen to $77k, breaking below the key $80k level, and the market has instantly switched from “the bull market is just around the corner” to “are we heading into a bear market?” I have to say, crypto investors’ emotions are even more intense than Bitcoin’s candlestick chart!
But viewed from another angle, this pullback may not be all bad. The concentrated liquidation of leveraged longs means some irrational positions are being cleared out. What’s really worth watching isn’t how much prices have fallen t
NVDA-4.16%
  • 35
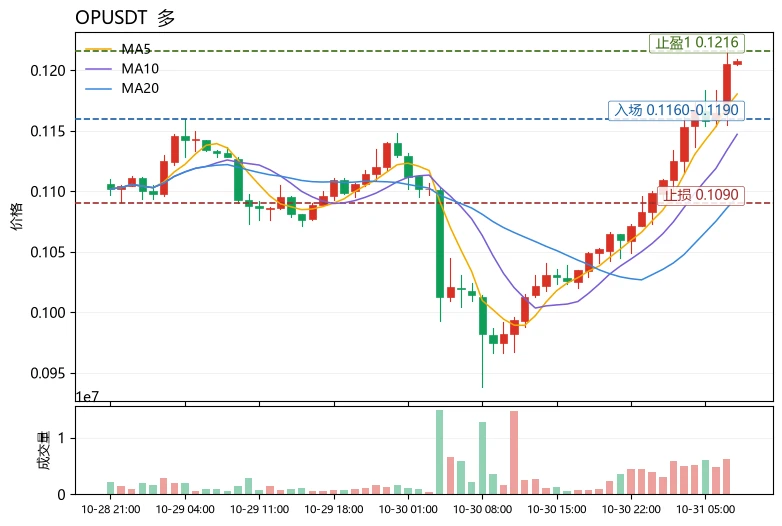
$OP Current price: 0.1208. The first resistance above is the Bollinger upper band at 0.1216; pullback support is at MA5 0.1180, with strong support at MA20 0.1096. These levels mark the current divide between bulls and bears. The conclusion first, then the rationale.
Trend health can be assessed using three checks: “moving average alignment + momentum + sentiment.” First, check whether MA5 is above MA20 and both are rising in tandem: OP’s MA5=0.1180>MA20=0.1096, so the medium-term structure remains bullish. Second, check whether momentum is keeping pace: the MACD histogram at +0.001537 remains
post-image
OP-1.31%
BEAMX+5.82%
Apple has issued guidance to its retail stores and authorized service providers, requiring them to follow standard procedures when handling cracked inner displays on iPhone Duo devices.
Apple emphasized that the issue affects only a “small number” of devices, but the fact that it issued specific guidance to standardize the process suggests the problem may be more widespread than officially acknowledged.
$BTC
AAPL-1.18%
BTC-0.67%
Load More

Join 40 M users in our growing community

⚡️ Join 40 M users in the crypto craze discussion

💬 Engage with your favorite top creators

👍 See what interests you

Trending Topics

BTC大跌

195.25k Views39.52k Discussing

$BTC briefly fell below $77,000 and remains under pressure around the $77K zone, with its 24-hour decline still above 4%. With risk appetite weakening and Fed uncertainty rising, where is the next key support after losing $80K?

IntelBeatsEarningsButStockPlunges

13.91k Views736 Discussing

StrategySTRCNears100ParValue

17.57k Views4.03k Discussing

View More