





Share crypto content and earn up to 60% commissions through content mining.
placeholder
gatefun
Tonight at 20:30, keep a close eye on the U.S. August nonfarm payrolls data!
It will directly impact expectations for Fed rate cuts, and Bitcoin volatility will likely intensify.
Data above expectations: Employment remains strong, rate-cut expectations cool, bearish for crypto
Data below expectations: Employment weakens, rate cuts may accelerate, bullish for the crypto market
Data roughly in line with expectations: The market will likely maintain its existing range-bound rhythm
Nonfarm payrolls can trigger sharp volatility. Don’t blindly chase trades; manage risk properly and keep your positio
BTC3.81%
View Original
post-image
  • Reward
  • Comment
  • Repost
  • Share
The market’s mainstream expectation for September is that Solana will challenge $110; a surge to $120 is possible; a pullback below $90 is a secondary risk, while bullish expectations overall remain dominant.
SOL2.68%
View Original
post-image
  • Reward
  • Comment
  • Repost
  • Share
I’ve never decocted traditional Chinese medicine myself
The old Chinese doctor said to decoct it three times a day and drink it three times
I ended up with a whole large basin of it…
My preliminary estimate is that there are three liters of it now
View Original
post-image
post-image
  • Reward
  • Comment
  • Repost
  • Share
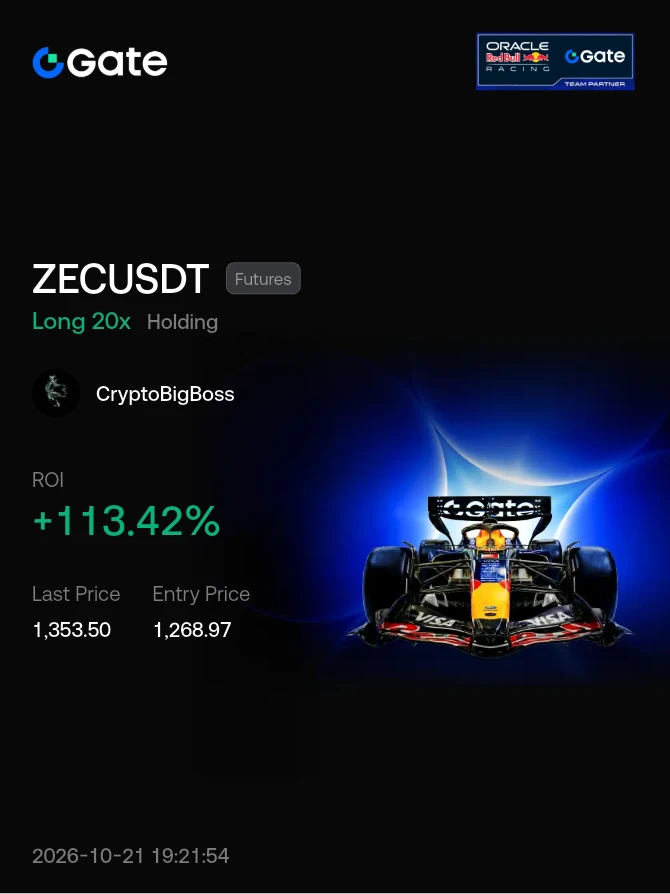
I was just about to go to the forum and rant, but then I saw my balance and thought, forget it—the market daddy is always right. A few days ago, I was still debating whether to stop-loss on $LTC before going to bed. When I got up this morning, I found that the candlestick chart had figured out the direction on its own.
When the sell-off hit early in the session, I watched for a while. The resistance above was obvious, and the rebound was weak. Every push upward fell just short—isn't this a textbook bull trap? While everyone else was waiting on the sidelines, I directly placed a short at 53.67.
LTC1.23%
SNDK2.11%
ZEC15.31%
View Original
post-image
  • Reward
  • Comment
  • Repost
  • Share
The Big Five Leagues This Weekend: Some Straight Talk with a Little Spice
Let me give you the conclusion first: if I could choose only one game to broadcast, it would definitely be Paris Saint-Germain vs Monaco. Beijing time 3:05 a.m. on September 5 (9:05 p.m. local French time on September 4), at the Parc des Princes—this is one you have to stay up for. I’ll go through the leagues one by one below.
Top live pick: Paris Saint-Germain vs Monaco
Time: September 5 (Saturday), 3:05 a.m.
What makes this game interesting? PSG opened with two straight draws, while Monaco have won two in a row without
View Original
post-image
post-image
PSG vs. Monaco
Paris Saint-Germain FC
1.37x
73%
Draw
5.56x
18%
AS Monaco FC
8.33x
12%
$76.39K Vol
  • Reward
  • Comment
  • Repost
  • Share
LIT surges 17.8% to $4.49, hitting a fresh all-time high as it leans into favorable U.S. crypto policy work and tight integration with Robinhood Chain. $LIT
LIT10.94%
post-image
  • Reward
  • Comment
  • Repost
  • Share
I didn’t do anything—just went to the restroom, and when I came back, the candlestick chart had already done the work for me. I had been watching $COLLECT during the repeated intraday swings, and when it held after the pullback, buying pressure was clearly strengthening. I decisively opened a long position around 0.06495, and it has now bounced to 0.07868, +418.05%. The brothers on the ride should be grinning in their sleep. It was truly sluggish at first, but the breakout feels amazing. I’ve closed 75% of the position for now, secured the bulk of the profits, and placed the remaining 25% at t
COLLECT-0.72%
DOGE4.75%
BTC3.83%
View Original
post-image
  • Reward
  • Comment
  • Repost
  • Share
#xauusd #Gold The positive outlook remains intact. Declines appear to be corrections of the uptrend. On the daily timeframe, the correction will be complete when it holds at any of the 4311-4220 levels, and the uptrend may resume.
Buyers at the 4311 level may extend the uptrend as long as this level holds. During the rise, the 4696- 4893-4995-5597 resistance levels can be monitored.
If it remains below 4311 on the daily timeframe during a pullback, we will look for confirmation of a reversal at the support around 4220.
View Original
post-image
  • Reward
  • Comment
  • Repost
  • Share
9.3|Intraday Manual 5️⃣th Order:
4476👉4462 🈳 1.5👋 ➕ 14 points, closed at 2098 🔪。
#黄金 #现货黄金 #BTC收复8万美元 #Gate用户突破6000万
GLDX1.95%
PAXG0.74%
BTC3.81%
View Original
post-image
post-image
  • Reward
  • Comment
  • Repost
  • Share
#GateEventContractTradeSharingChallenge
#$XAU
XAUUSD Gold Market Analysis September 3, 2026
At the time of writing, XAUUSD gold is trading around 4,431, in the middle of a sharp corrective move following one of the year's most volatile periods. Gold fell from a double top near 4,755 in August, quickly broke below the 4,500 and 4,400 support levels, and slid to a low near 4,280 before buyers re-entered. The metal has now reclaimed the 4,400 round-number level and is approaching the 4,430 to 4,465 supply zone, making the current price a genuine decision point for the remainder of the week.
The
XAU0.83%
View Original
post-image
post-image
HighAmbition
#GateEventContractTradeSharingChallenge
#$XAU
XAUUSD GOLD MARKET ANALYSIS 3 SEPTEMBER 2026
XAUUSD gold is trading near 4,431 at the time of writing, sitting right in the middle of a sharp correction after one of the most violent swings of the year. Gold turned down from the August double top near 4,755, sliced through the 4,500 and 4,400 supports in quick succession, and slid to a low around 4,280 before buyers stepped back in. The metal has now reclaimed the 4,400 round level and is pressing against the 4,430 to 4,465 supply zone, which makes the current price the true decision point for the rest of the week.
The selloff was triggered by a hawkish shift from the Federal Reserve following Jackson Hole, with markets now pricing a serious chance of a rate hike in September rather than a cut. Higher rate expectations pushed US Treasury yields to a nineteen month high and strengthened the dollar, and since gold pays no income, both forces hit it hard at the same time. Several major banks also trimmed their year end gold targets after removing 2026 rate cuts from their models, which gave the correction extra momentum.
The structural bid underneath is still intact. Central banks bought a record 288.9 tonnes in the second quarter of 2026, ETF inflows have continued, and the unresolved Strait of Hormuz crisis keeps a geopolitical risk premium in the metal. This is exactly why dips below 4,400 have been bought quickly instead of turning into a full crash. Goldman Sachs still targets 4,900 by the end of 2026 and Wells Fargo sees 4,900 to 5,100, so the medium term narrative is not broken, it is simply repricing around the Fed.
Technically, the bigger picture remains a bull market that is correcting. The 200 day exponential moving average sits near 4,370 and aligns with the March swing lows, making that zone the bull bear dividing line. During the slide, the four hour RSI fell to about 28, a clearly oversold reading, and the rebound has now lifted it back into the neutral 45 to 50 region, with the daily RSI in a similar area. In simple words, gold is no longer oversold but momentum still has room to build. A push above 55 on a confirmed close above 4,465 would signal renewed buying, while another rejection near the 50 level would warn that the correction has one more leg down.
Support levels in order: 4,400 is the first line and a daily close below it brings 4,370 to 4,350 into play, where the 200 day EMA and earlier lows cluster together. Below that, 4,300 is the psychological floor and 4,280 is the swing low of this correction. A daily close under 4,280 opens 4,230, which is the 61.8 percent retracement of the recent rally, and then the deeper 4,105 to 4,000 zone where the structural buyers are expected to return.
Resistance levels in order: 4,445 to 4,465 comes first and it has rejected every bounce so far. A clean close above that zone targets 4,500, then 4,600 to 4,660 where the 50 day average and previous breakdown levels meet. The real barrier is 4,755 to 4,800, the August double top; a sustained break above it would confirm that the correction is finished and open a move toward 4,900 to 5,000.
So how high can gold go? Over the next two to four weeks, a successful defence of the 4,400 to 4,370 support combined with a soft US jobs report could carry price back to 4,600 and then toward the 4,755 to 4,800 resistance, and the year end institutional targets of 4,900 to5,100 remain alive if the Fed backs away from hiking. If yields keep climbing and the dollar strengthens further instead, gold can still slip to4,230 and even4,100 before dip buyers return. The single most important catalyst is Friday's US Non-Farm Payrolls report: a weak number would rapidly unwind the rate hike narrative and likely spike gold higher, while a strong number could extend the slide.
Trading plan. Plan A, the bullish setup which is preferred while price holds above 4,400: look for a confirmed close above 4,465 or a defended retest of the 4,415 to4,430 zone for longs. Place SL1 at4,395, SL2 at4,365 and SL3 at4,335. Take TP1 at4,500, TP2 at4,600 and TP3 at4,660. Plan B, the bearish setup: if price is rejected at the4,445 to4,465 resistance or breaks and closes below4,350, shorts can target4.300 and then4,280. Use stops at4,375, 4,400 and4,445 as SL1, SL2 and SL3, with TP1 at4,300, TP2 at4,280 and TP3 at4,230. Keep position sizes small, respect the stops, and remember that volatility around the jobs report can spike both ways within minutes. Market sentiment right now is cautious and two sided: leveraged traders are leaning bearish on the Fed narrative, while central banks, ETF investors and long term holders are quietly accumulating on weakness. This analysis is for educational purposes only and is not financial advice; leveraged products carry a high risk of loss, so trade only with capital you can afford to lose.
$XAU ‌
repost-content-media
  • Reward
  • Comment
  • Repost
  • Share
JUST IN: Robinhood reports Trust Accounts driving deposits past $150M with an average account size around $500k, signaling growing high-net-worth onboarding alongside first-time investors. $HOOD
HOOD16.53%
post-image
  • Reward
  • Comment
  • Repost
  • Share
$BTC # Waller: August inflation will determine whether rates are raised in September; personal view
Federal Reserve Governor Waller gave a clear conditional statement, largely tying his September voting decision to the August inflation data. This marks a subtle divergence from the hard-line hawkish stance Waller took at Jackson Hole, while market expectations for a September rate hike quickly fell to around 50%, Sina Finance. In his view, employment is already close to full employment, so the weight of the jobs report has declined; inflation is now the core benchmark for policy.
If August CPI
BTC3.81%
View Original
post-image
  • Reward
  • Comment
  • Repost
  • Share
BTC returns to $78,000! The market rebounds after finding support, is it time to buy the dip or wait
gate liveLIVE
2,001
live-coin
  • Reward
  • Comment
  • Repost
  • Share
#AugustNFPReportComing
🔥 August NFP Report Coming The Market Is Waiting for a Major Catalyst
The August U.S. Nonfarm Payrolls report is set to become one of the most important economic events for financial markets, with the official release scheduled for September 4, 2026, at 8:30 a.m. ET. Traders are watching closely because the employment report could influence expectations for the Federal Reserve’s next policy decision and trigger significant moves across Bitcoin, stocks, gold, Treasury yields and the U.S. dollar.
The current consensus expects the U.S. economy to have added around 56,000
BTC3.81%
post-image
post-image
  • Reward
  • Comment
  • Repost
  • Share
The US 30 year Treasury yield has risen 0.37 points over the past year, to 5.27% from 4.90%.
  • Reward
  • 4
  • Repost
  • Share
SwingFisher:
With long-term interest rates moving this way, mortgages and corporate bonds are under enormous pressure.
View More
$meme The stock-coin meme organized by foreigners is fierce; the sentiment is now as frenzied as it was during the SOL craze.
Even AMC has voiced its dissatisfaction—the Robinhood-related concept
$eth Settlement layer
ethereum:0xb50721bcf8d664c30412cfbc6cf7a15145234ad1 Technical rent-collection layer
$uni Swap layer
$ink Oracle

How can it fall in the short term? Embrace the bubble.
MEME0.90%
SOL2.68%
AMC-1.53%
HOOD16.53%
ETH4.10%
View Original
post-image
  • Reward
  • Comment
  • Repost
  • Share
I just casually tapped refresh, and it went up on its own, putting me in a very passive position. When I opened the chart this morning, this trend required no brainpower from me at all—the account was dancing on its own. $SPCX It had moved sideways at the bottom for several days, with volume continuously shrinking, yet it simply wouldn’t break below the key level. I figured the consolidation would eventually lead to another move up, so I entered directly. Now it has climbed from 140.56 to 150.84, with a return of +680.33%—that was one delicious bite. 😎
Take 80% of the profits off the table fi
SPCX6.94%
ZEC15.31%
ADA7.85%
View Original
post-image
  • Reward
  • Comment
  • Repost
  • Share
ETH Market Outlook and Trading Recommendations

At the current price of 2507, ETH has seen a strong rally over the past 24 hours, with bullish sentiment running high.

On the four-hour timeframe, the price has broken through the previous resistance level, the moving averages are in a bullish alignment, the Bollinger Bands are opening upward, and the MACD red bars continue to expand, indicating strong bullish momentum. RSI has moved into the high range, creating a short-term need for a pullback and consolidation, but the broader upward trend remains intact, so blindly chasing the rally at hig
ETH4.13%
View Original
post-image
  • Reward
  • Comment
  • Repost
  • Share
$DASH Technical Update
$DASH is showing strong momentum today, currently trading at $49.66 (+4.79%) after testing a 24h high of $52.94.
Key metrics to watch:
24h Range: $42.33 – $52.94
7-Day Gain: +28.98%
30-Day Gain: +60.24%
180-Day Performance: +63.14%
After hitting local resistance at $52.94, the chart shows a short-term cool-off and consolidation around the $49.50–$50.00 region.
A bounce back above $51 could reignite another leg up toward fresh highs, while holding above $48 keeps the bullish setup intact.#Gate60MillionUsers #GateTops7DayNetInflowsGlobally
DASH18.39%
post-image
  • Reward
  • 5
  • 1
  • Share
ThreeCrowsKeeper:
The consolidation phase is the most grueling. Holders, stay steady and don’t get shaken out.
View More
Load More

Join 40 M users in our growing community

⚡️ Join 40 M users in the crypto craze discussion
💬 Engage with your favorite top creators
👍 See what interests you
  • Pinned