




Square
Following
Hot
News
Notifications
Profile
Share your thoughts
placeholder
Article
Bitcoin ETF Investors Can Hedge During Thanksgiving’s 40+ Hour Trading Gap
NYSE Arca-listed spot Bitcoin ETFs will miss a full core trading session this Thanksgiving as the exchange closes Thursday for the holiday.
The closure creates a 41.5-hour gap between core sessions. Arca’s core equities session closes at 4 p.m. ET on Wednesday, Nov. 25, and does not reopen until 9:30 a.m. ET on Friday, Nov. 27, according to the NYSE holiday calendar. Friday’s schedule features an early session starting at 4 a.m. ET, a core session closing at 1 p.m. ET, and a late session running through 5 p.m. ET.
⚠️ Pe
post-image
BTC-5.94%
  • 2
Weekend news:
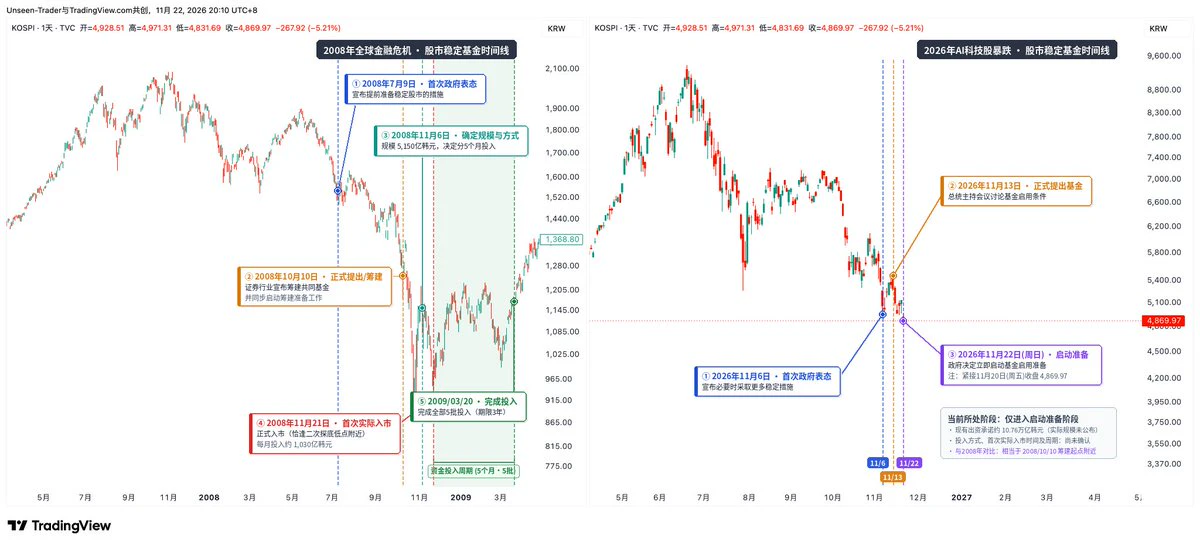
The South Korean government has decided to begin preparations for a stock market stabilization fund.
The last time South Korea deployed a stock market stabilization fund was November 21, 2008.
A comparison of the 2008 timeline with this time is listed; the K-line chart offers a clearer view.
Looking at 2008, the government’s signal that it was preparing to stabilize the market and its announcement that it would establish a stock market stabilization fund briefly boosted the market.
Ultimately, the market bottomed between the first tranche of funds entering the market on November
post-image
Trenches
IDOL
I
bade
b
IDOL
0x3b...ab07
Market Cap
$.
Change
.
24h Vol
$.
Holders
.
PIEVERSE
P
bade
b
PIEVERSE
0x0e...25a9
Market Cap
$.
Change
.
24h Vol
$.
Holders
.
JAGENT
J
bade
b
JAGENT
0x8e...ae15
Market Cap
$.
Change
.
24h Vol
$.
Holders
.
CLAUDIA
C
bade
b
CLAUDIA
2j5S...W2ZM
Market Cap
$.
Change
.
24h Vol
$.
Holders
.
Singularity
S
bade
b
Singularity
7R4M...pump
Market Cap
$.
Change
.
24h Vol
$.
Holders
.
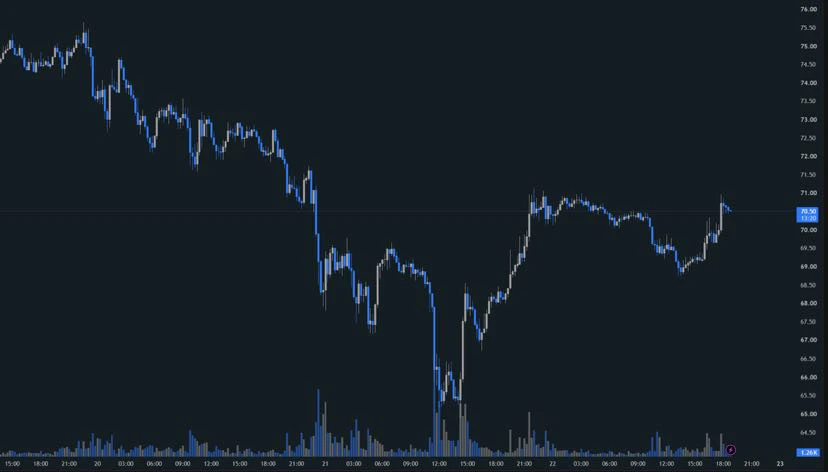
$SOL There’s one detail in the price action over the past few days worth watching👀

It briefly fell to 64.83 over the weekend, then rebounded along with BTC and has now returned to around $70

But a closer look at the 4H candlesticks shows a clear increase in trading volume during the decline, especially on the few candles that plunged sharply to test the lows, which saw heavy trading

By contrast, volume has gradually tapered off during the subsequent rebound

This usually means that panic selling has been partially absorbed, but it’s still too early to say how strong sustained buying really
post-image
SOL-0.74%
  • 1
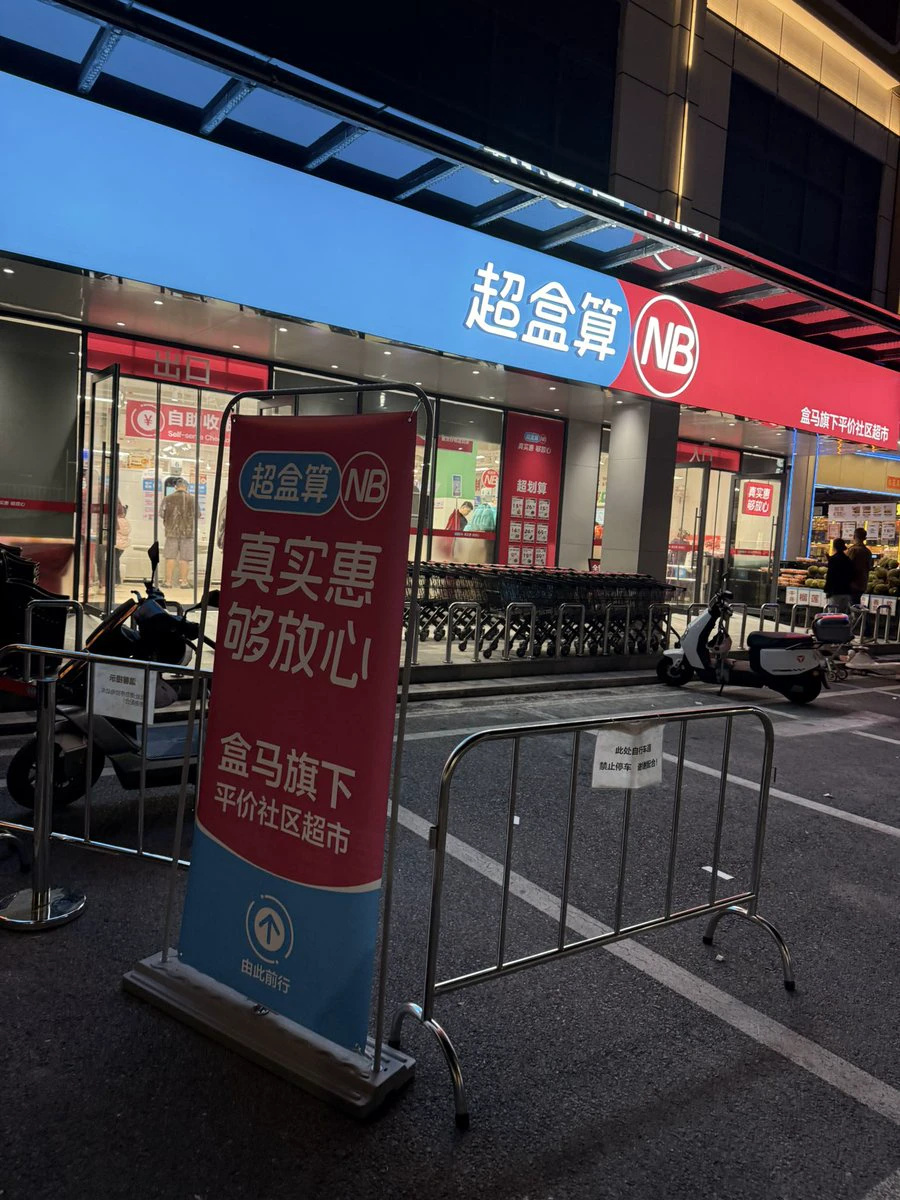
Walmart Neighborhood Market, Hema Super Box, and Meituan Happy Monkey.
Why are they all opening new supermarkets?
By the way, does “NB” just mean “awesome”?
post-image
WMT+1.54%
BTC
live-cover
LIVE1,650
BTC-0.67%
SOL-0.77%
USDC+0.01%
ETH-1.26%
XRP-1.15%
According to COINOTAG, in 2026, 14 publicly listed companies sold or transferred a total of 108,247 Bitcoin (BTC), worth approximately $8.08 billion. Eleven of these companies operate in the cryptocurrency mining sector, with Marathon Holdings (MARA) and Riot Platforms leading in Bitcoin sales this year.
post-image
BTC-0.67%
MARA-18.65%
RIOT-8.51%
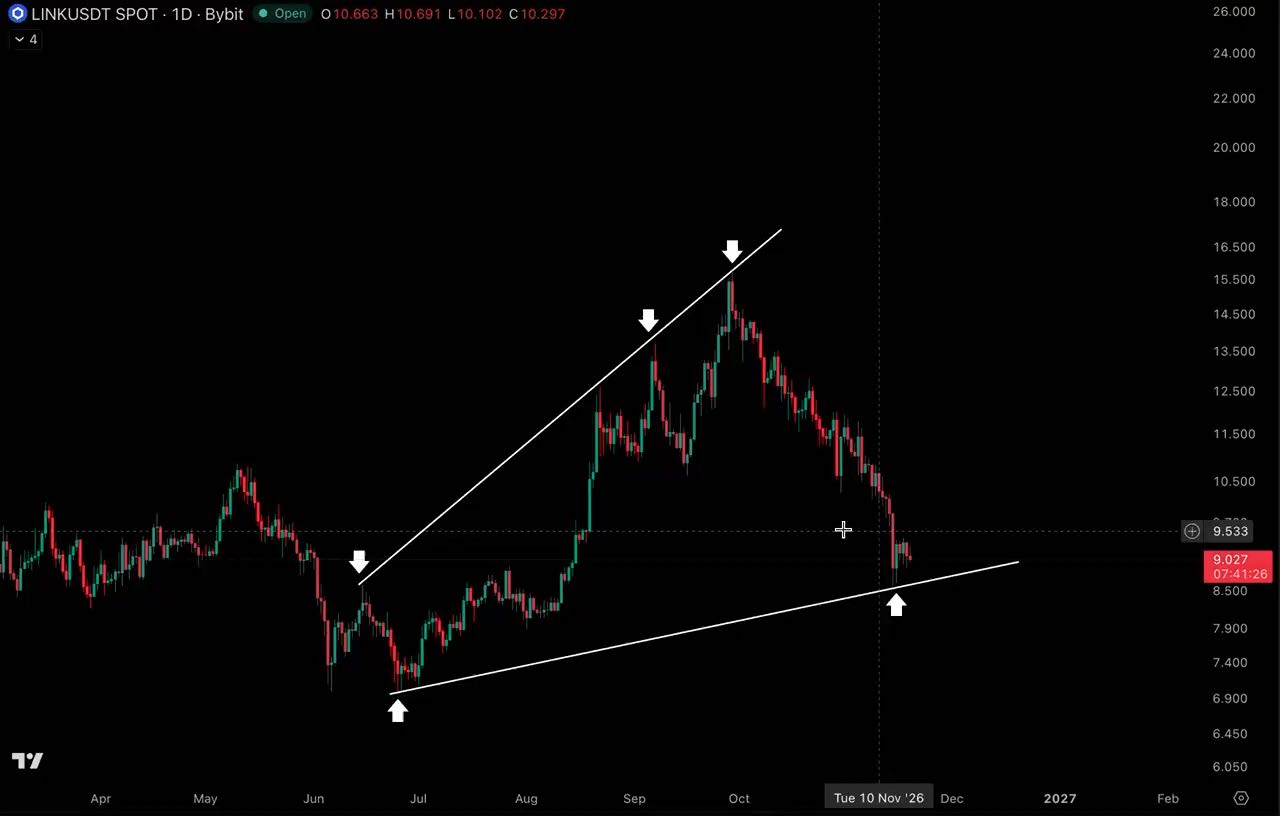
months of higher lows, multiple successful retests, and now $LINK is back at support

would be a shame for bears if buyers defend this one again
LINK-0.18%
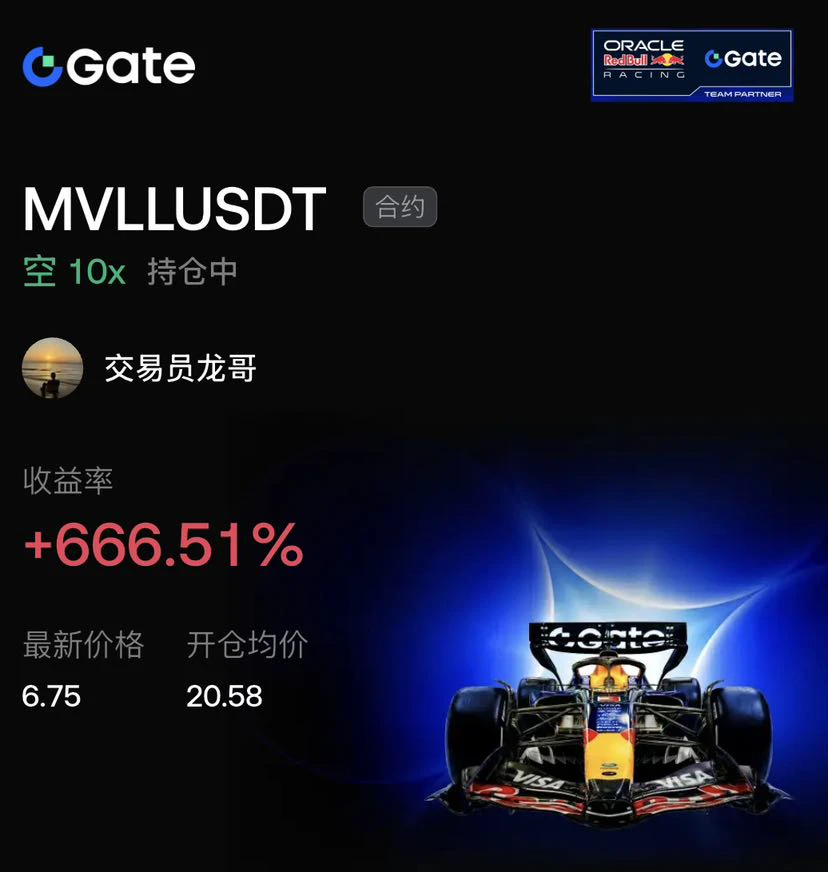
When everyone was buying the dip around 20.58$MVLL , I chose to reverse and go short.

The daily-chart double top was already crystal clear, with every rebound accompanied by declining volume and the moving averages fully aligned bearishly. In this environment, so-called “support levels” looked more like bull traps. Following the trend is far safer than trying to guess tops and bottoms.

Holding the position was no easy ride. From 20.58 to 6.75, there were several high-volume rebounds along the way, and watching unrealized profits pull back under 10x leverage was a real test of discipline. For
post-image
MVLL-1.56%
BTC-0.65%
ETH-1.23%
  • 1
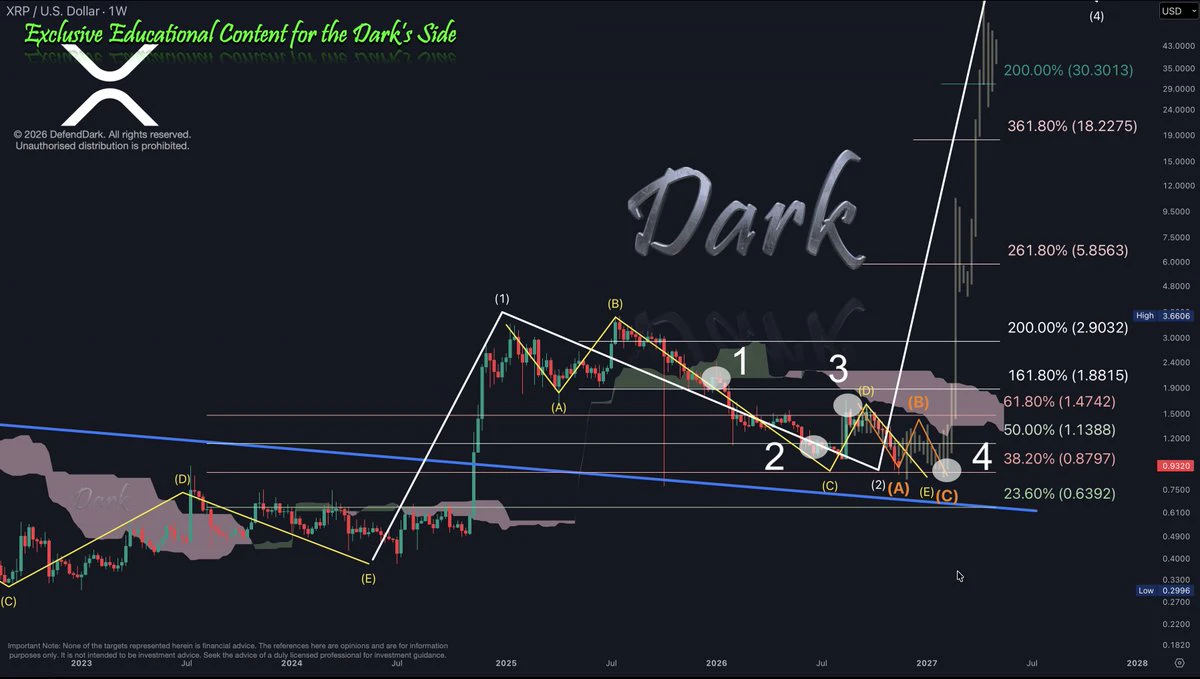
$XRP Weekly – the hardest correction, in four points
1. The flat was complete. ABC Wave from the Wave 1 top, done by the book.
2. The Wave C expanded. The regular flat became an expanded flat, down to $0.9852. Same three letters, a longer last leg.
3. The run to $1.6992. We called it a new wave, on one condition: the pullback had to keep $1.
4. $1 broke. So that run told us ABC wanted to further expand technically. We named our Wave 1 as Wave D when $1 can't hold, and we are now in Wave E.
ABCDE instead of ABC. Two moments that looked like the end, before the real one arrives.
What didn't chan
post-image
XRP-1.15%
After BTC (Bitcoin) successively broke below the two bottoms from the first half of the year at 62,000 and 58,000, there is temporarily no bottom in sight. We can only take it one step at a time, going long when it’s time to go long and short when it’s time to go short, without overthinking it.

A few reference levels below that are suitable for buying dips: the 10-day Bollinger lower band (54155), the 20-day Bollinger lower band (54350, essentially coinciding with the former), the 45-day Bollinger lower band (51666), the quarterly EMA24 (53555), and the monthly Bollinger lower band (49100/488
BTC-0.67%
  • 1
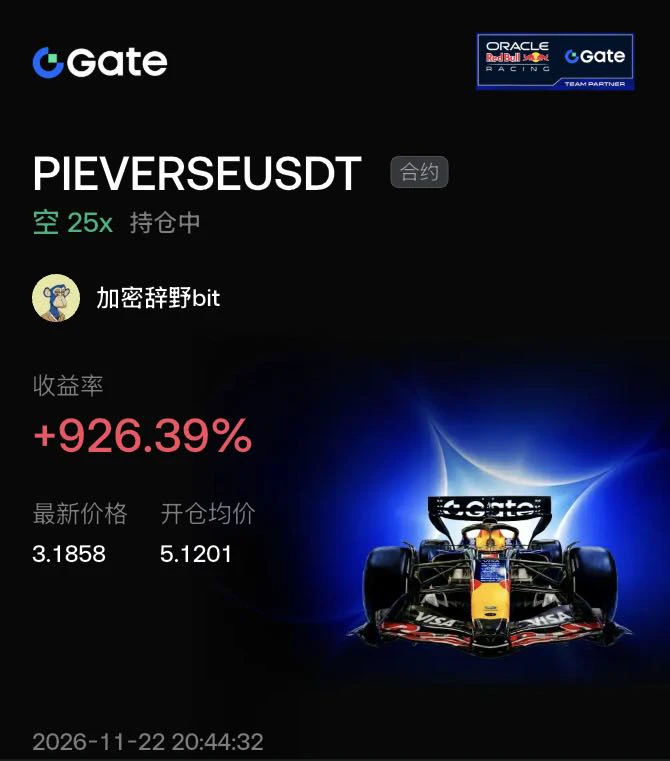
$PIEVERSE Not long after I opened the position, the market crashed. This PIEVERSE plunge was completely expected.

Look at the 15-minute chart: price had climbed to around 5.34. How many people were still dreaming of a push to $6 or even $10? But seeing the massive surge in trading volume and the price’s inability to move higher, I knew the major players were distributing.

Without hesitation, I placed a 25x short order at 5.1201. After I entered, there wasn’t even a decent rebound—price just kept getting hammered in wave after wave, smashing through 4.5, dropping below 4.0, and plunging all t
post-image
PIEVERSE+0.58%
ETH-1.23%
  • 2
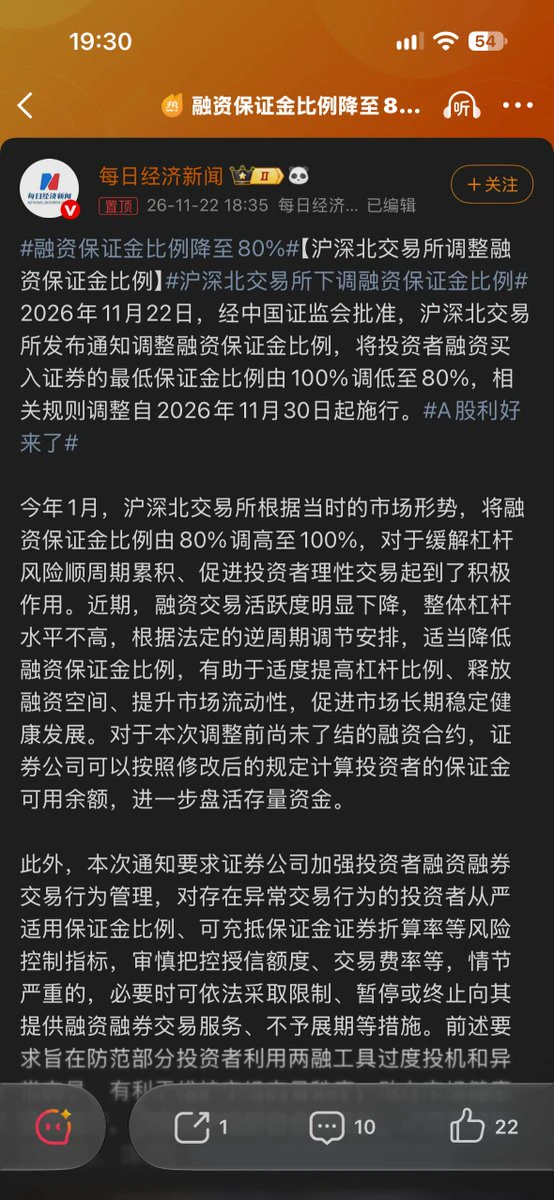
Shanghai, Shenzhen and Beijing Stock Exchanges adjust margin financing ratio
——Financing margin ratio lowered to 80%
Is this a real market rescue or another false alarm? What do you think?
post-image
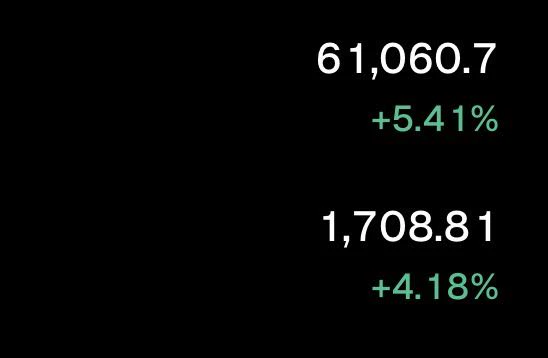
With the current price above 61,000, you can trim the staggered long positions entered near the lows of 55,000–56,500 that Lao Ji gave. Keep a protected core position and continue looking higher.

The next target is around 62,500. If it breaks above 62,000, keep holding!
post-image
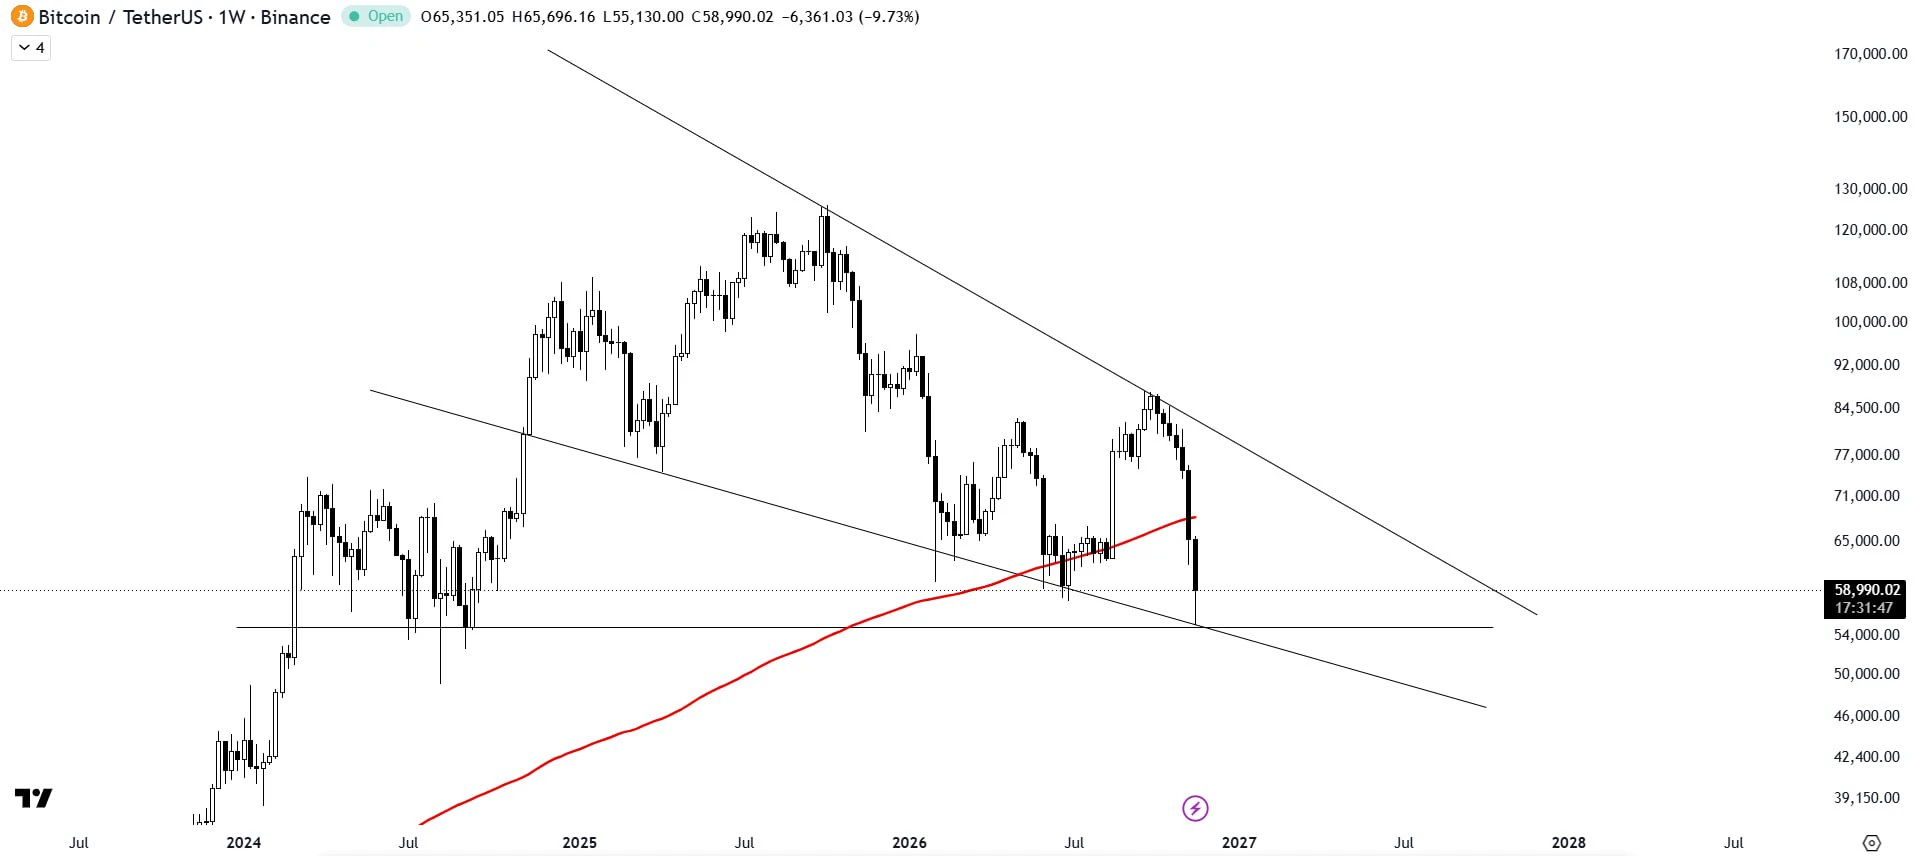
$BTC /USDT ANALYSIS

Bitcoin is bouncing from the falling wedge support trendline, showing signs of renewed bullish strength.

The next major challenge is the 200MA. As long as horizontal support holds, the structure remains bullish. A breakout could spark fresh momentum across the market.

#BTCReboundFaces60KTest
post-image
BTC-0.67%
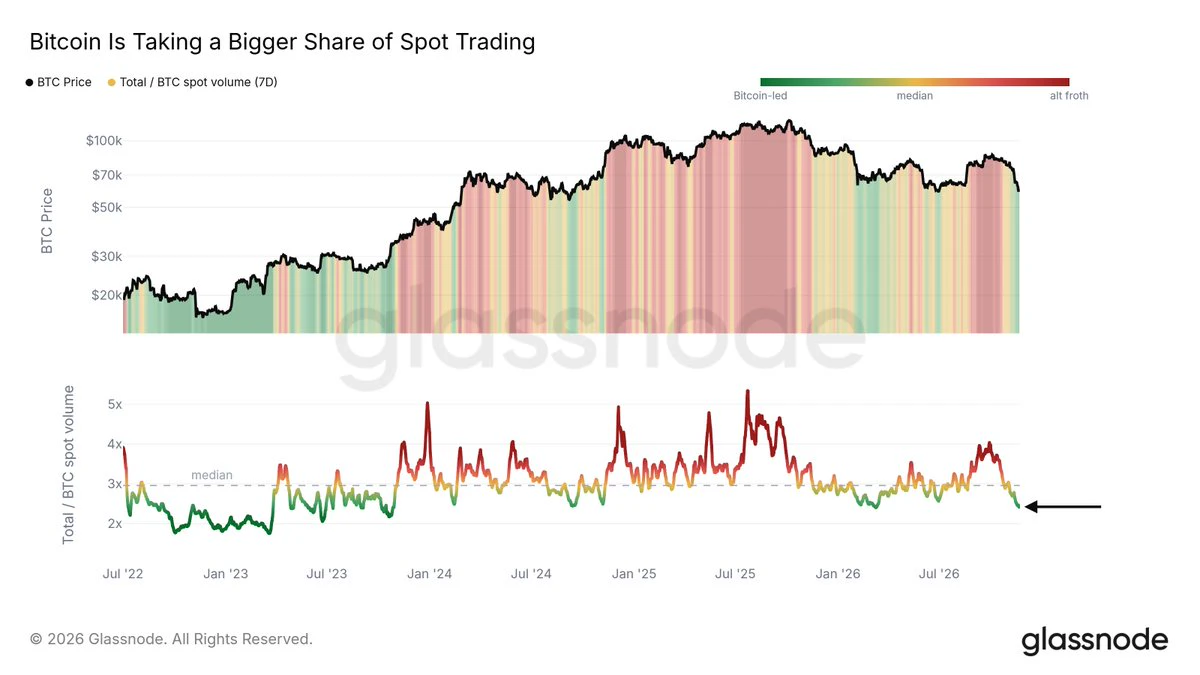
The altcoin froth is gone.
In late September, total spot volume was 4x Bitcoin's. Today that ratio is below the summer lows.
In risk-off markets, capital tends to consolidate into bitcoin:native.
In risk-on markets, this capital moves back into riskier assets.
post-image
BTC-0.67%
  • 2
💰 Gate Square Content Mining Rewards Distributed (Nov 9 – Nov 15)

This week's content mining rewards have been fully distributed. Check your account: Assets → Spot.

Post on Square with trading pair tags or trade cards — earn up to 60% fee rebate when users trade through your content. Keep creating and keep earning.

Check here: https://www.gate.com/social-mining-commission
Event details: https://www.gate.com/announcements/article/49475

‍#ContentMining #GateSquare
post-image
Gate_Square
💰 Gate Square Content Mining Rewards Distributed (Nov 9 – Nov 15)
This week's content mining rewards have been fully distributed. Check your account: Assets → Spot.
Post on Square with trading pair tags or trade cards — earn up to 60% fee rebate when users trade through your content. Keep creating and keep earning.
Check here: https://www.gate.com/social-mining-commission
Event details: https://www.gate.com/announcements/article/49475
‍#ContentMining #GateSquare
repost-content-media
  • 6
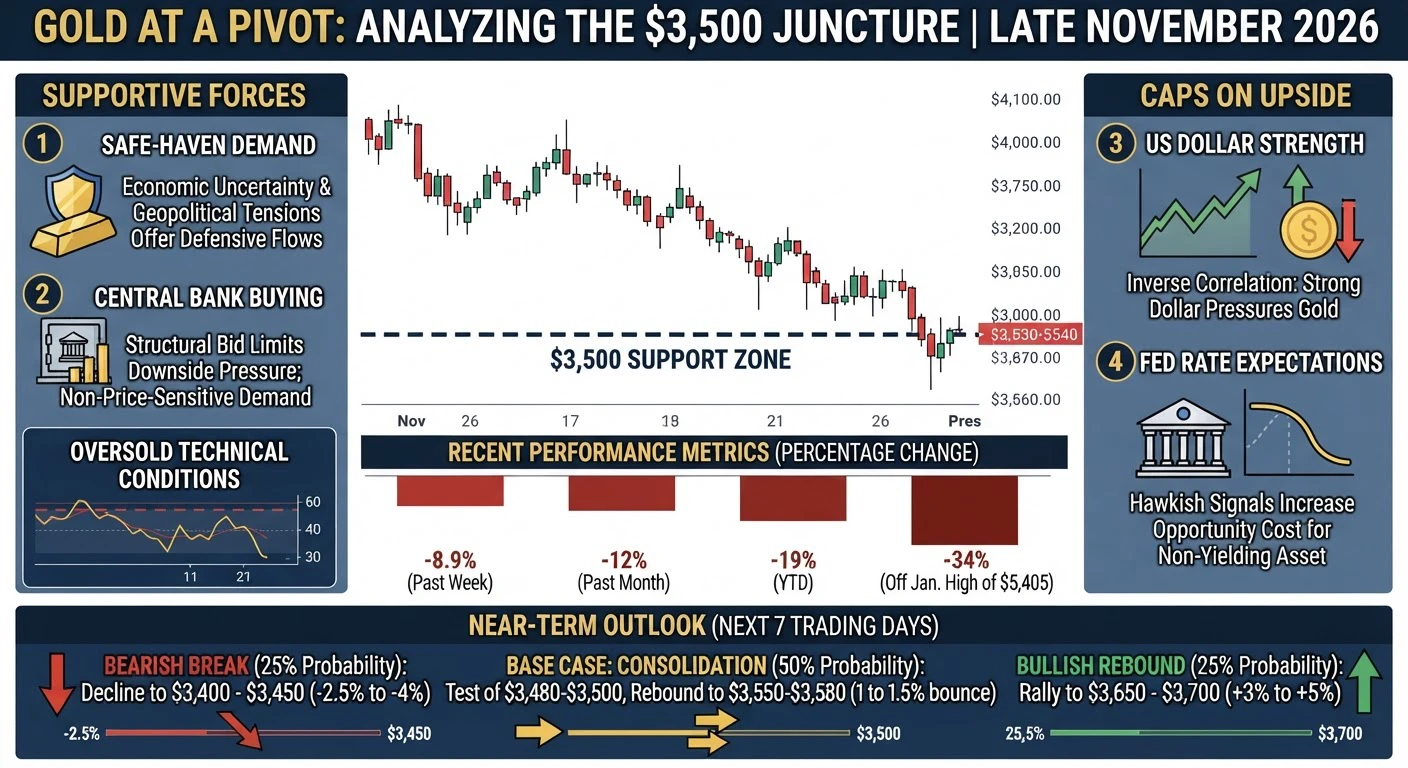
#GoldNears3500 $XAUUSD ‌
Navigating the Overextended Gold Market from Macro to Micro"

The current market presents a classic paradox: price action is heavily overextended, yet momentum remains tantalizing. Trading on the 4-hour and 1-hour charts right now is not about chasing the trend, but about understanding why the market is stretched. We are looking at a scenario where retail traders are caught in the crossfire of institutional liquidity hunting. This analysis breaks down the structural mapping of Gold (XAUUSD), analyzing the flow from a monthly macro perspective down to the 1-hour execu
XAUUSD-2.40%
  • 3
  • 1
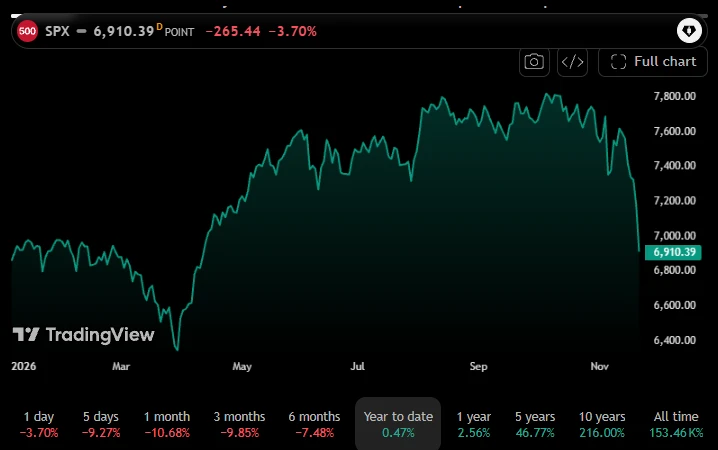
The S&P 500 is about 1% away from wiping out its entire 2026 gain.
BofA's Michael Hartnett says that level could be what stops the Fed hiking. 6,845. Friday's close was 6,910.
Fed Governor Lisa Cook says the Fed urgently needs to raise rates anyway. A bad week for stocks could end up being the fastest way to end rate hikes, right?
Does the Fed blink at 6,845?
post-image
US500-3.01%
BTC Fall below 60k
live-cover
LIVE3,072
BTC-0.67%
#GoldNears3500 #ShareWeekly
Gold stands at a pivotal psychological and technical juncture near the $3,500 per ounce level as of late November 2026, with the spot price hovering in the $3,530 to $3,540 range after a sharp multi-week decline. This area has become the focal point of intense market discussion, as the metal has already shed roughly 8.9 percent over the past week and approximately 12 percent over the past month, while sitting nearly 19 percent lower year-to-date and more than 34 percent below its all-time closing high near $5,405 recorded in late January 2026. The question dominati
post-image
Load More

Join 40 M users in our growing community

⚡️ Join 40 M users in the crypto craze discussion

💬 Engage with your favorite top creators

👍 See what interests you

Trending Topics

BTCReboundFaces60KTest

2.1M Views30.1K Discussing

BTC rebounded from around $55,300 on November 21, briefly reclaiming $60,000 before pulling back to around $59,300. The $60K level is back in focus as traders assess whether the recovery can last. Is this rebound a sign of stabilization or a short-lived recovery? Would reclaiming and holding $60K be enough, or do you need confirmation from trading volume and fund flows?

PCEAndGDPDataNextWeek

259.4K Views2.6K Discussing

GateDirectIPOPhase3ANTAllocates92100Shares

834.6K Views5K Discussing

View More