






Square
Following
Hot
News
Notifications
Profile
Share your thoughts
placeholder
Article
🐋 WHALE WATCH : 175270 traders got liquidated in the last 24 hours.
Same pattern every cycle: 50x leverage chasing green candles no stop losses full exposure on a random Thursday. Leverage doesnt build wealth faster. It speeds up the mistakes.
Spot holders slept fine last night.
Did you survive the flush ?
post-image
gate launches its third ipo access subscription for anthropic at an indicative $70–$78 per share, with subscriptions in usdt open until november 17. allocation is not guaranteed.

\#ANTHROPIC #IPO $GATE
post-image
Trenches
mihao
m
bade
b
mihao
4Cxj...pump
Market Cap
$.
Change
.
24h Vol
$.
Holders
.
AGT
A
bade
b
AGT
0x5d...e274
Market Cap
$.
Change
.
24h Vol
$.
Holders
.
FOOD
F
bade
b
FOOD
FTu5...pump
Market Cap
$.
Change
.
24h Vol
$.
Holders
.
IDOL
I
bade
b
IDOL
0x3b...ab07
Market Cap
$.
Change
.
24h Vol
$.
Holders
.
AI
A
bade
b
AI
2T56...pump
Market Cap
$.
Change
.
24h Vol
$.
Holders
.
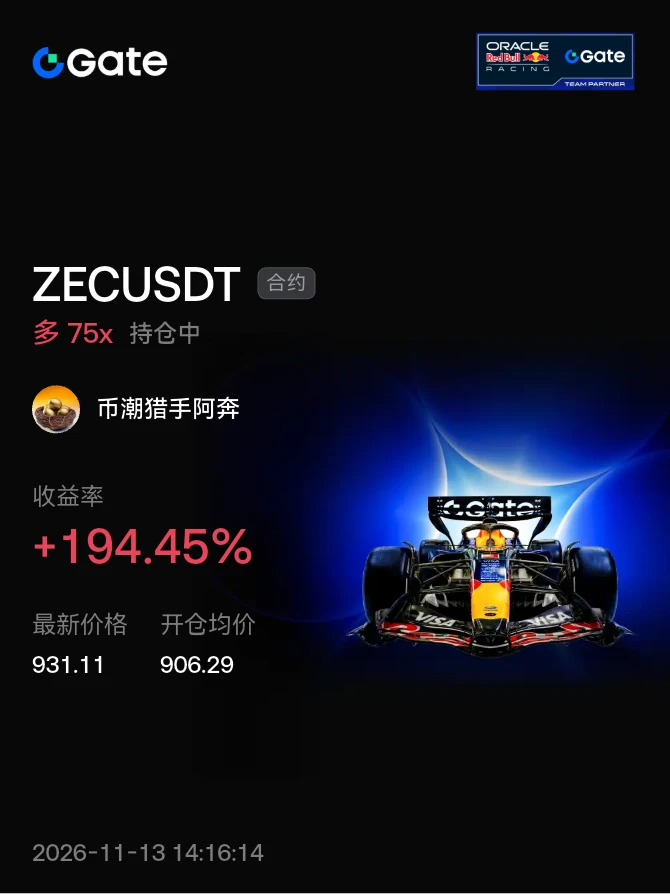
#晒出我的持仓收益 zec, you won't let me down, the gains keep coming
post-image
ZEC+1.29%
What Is Position Sizing? Why Can Oversized Positions Force You Out of the Market Early Even When Your Trading Strategy Has an Edge?

In cryptocurrency trading, getting the direction right is important, but how much capital you put into each trade also determines whether your account can survive in the long run. Even a strategy with positive expected returns can lead to losses that are difficult to recover from if your position is too large and an unexpected price move or a string of losses occurs.

First, what is position sizing?

Position sizing is the process of deciding how much capital to
post-image
So introverted, they don't dare say they're full and can only keep eating🤪
post-image
  • 1
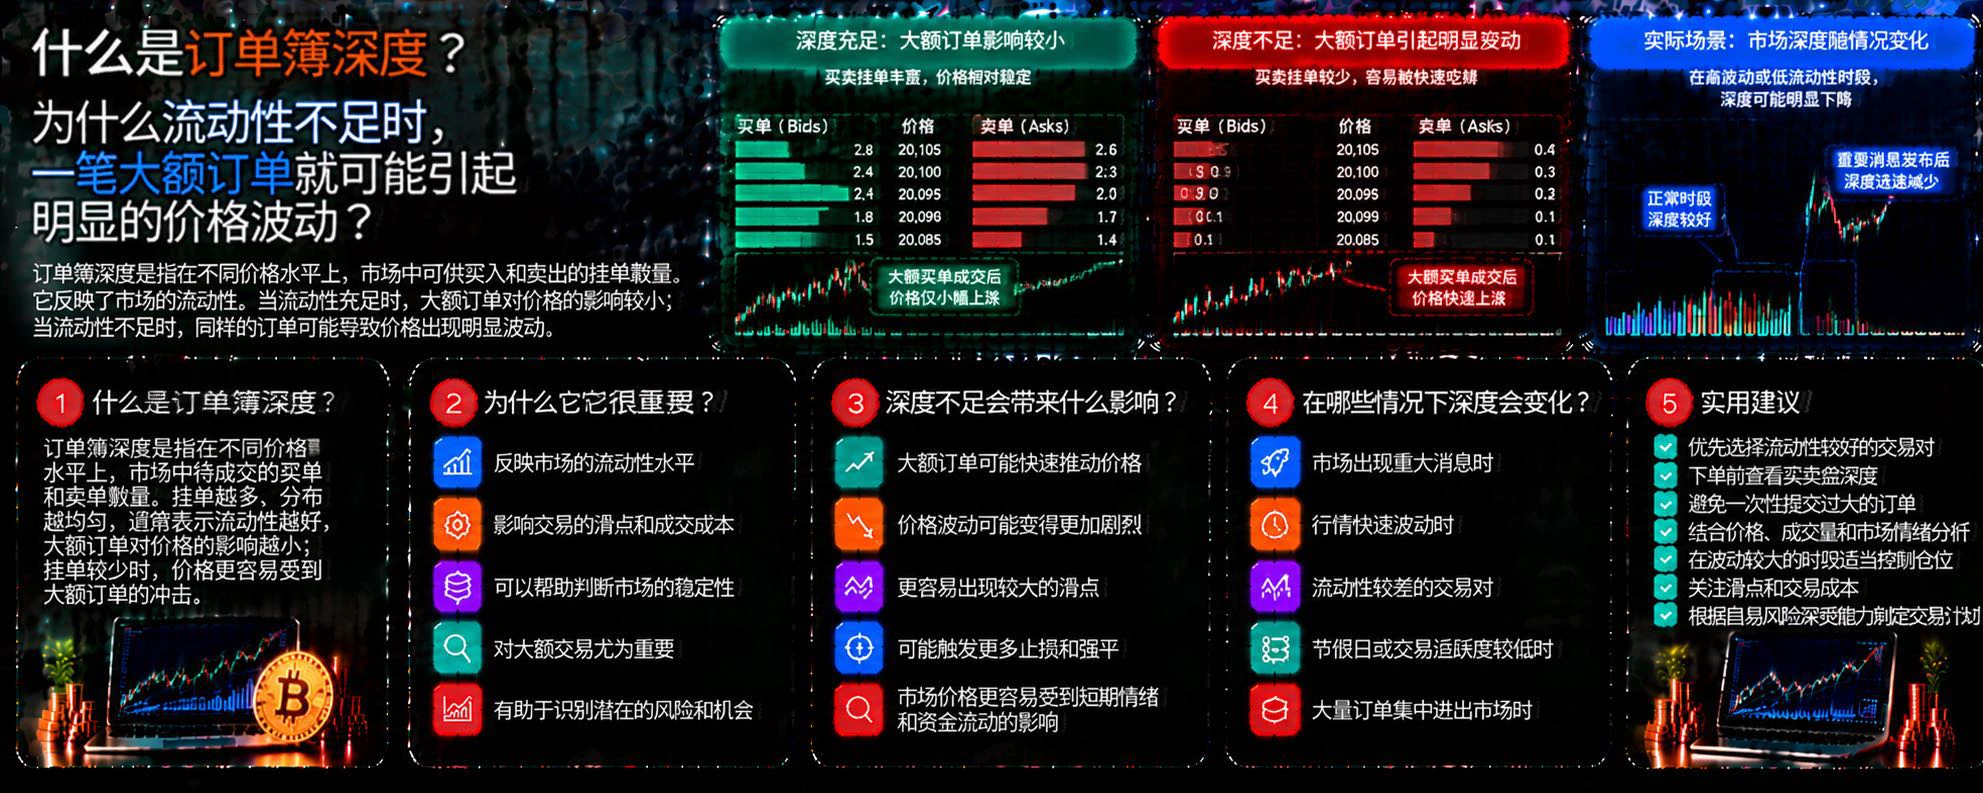
What Is Order Book Depth? Why Can a Large Order Cause Significant Price Swings When Liquidity Is Low?

In cryptocurrency trading, orders of the same size can have completely different execution outcomes in different market conditions. Sometimes a large order enters the market and barely moves the price; at other times, a single order can drive the price sharply up or down. One of the key factors behind this is order book depth.

First, what is order book depth?

An order book shows the limit buy and sell orders traders have placed at different prices. Order book depth reflects the quantity of
post-image
What Is Cross-Exchange Arbitrage? Why Can Price Differences Between Two Platforms Be Offset by Transfer Times and Capital Lockup Costs?

The same crypto asset may be quoted at different prices on different exchanges. Traders can try to buy on the platform with the lower price and sell on the one with the higher price to capture the spread. But this seemingly simple strategy is also affected by fees, transfer speed, and market volatility.

First, what is cross-exchange arbitrage?

Cross-exchange arbitrage involves trading on price differences for the same asset across different platforms. For e
post-image
BTC-0.67%
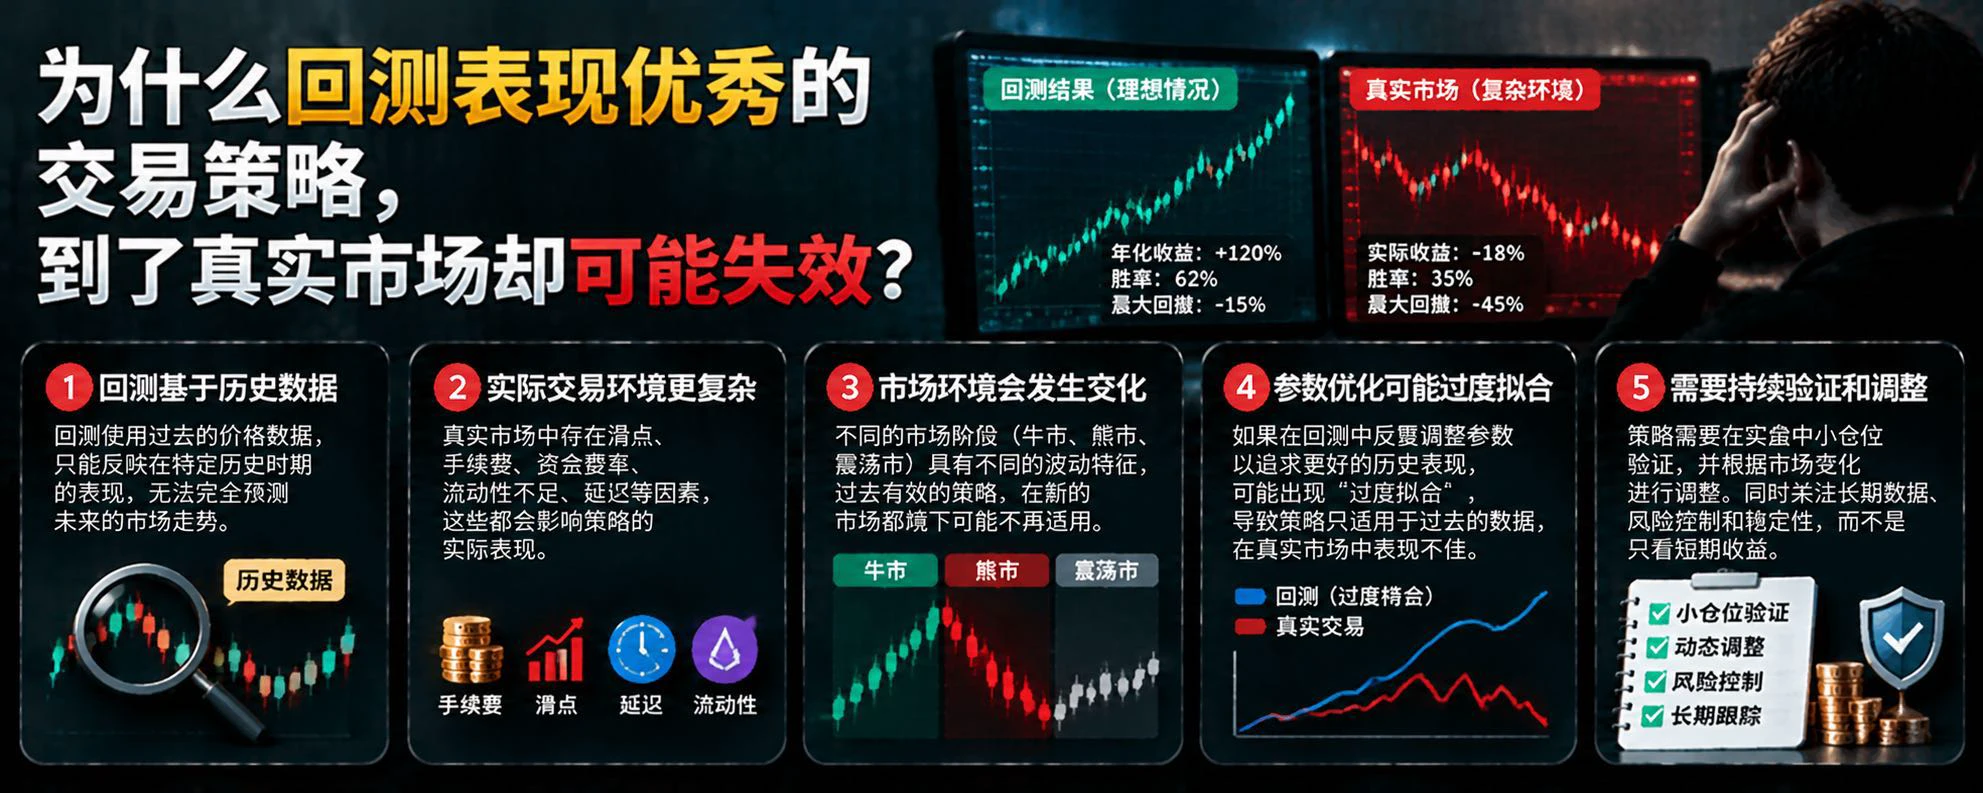
Why can trading strategies that perform well in backtests fail in real markets?

A trading strategy may deliver strong returns, a high win rate, and even a well-controlled maximum drawdown in historical backtests, yet produce entirely different results once deployed in the market. The problem may not necessarily lie with the strategy itself; it may also stem from the gap between backtesting and live trading.

First, historical data does not represent the future. Backtesting can only evaluate a strategy's performance in specific historical market conditions. Market structure, volatility levels,
post-image
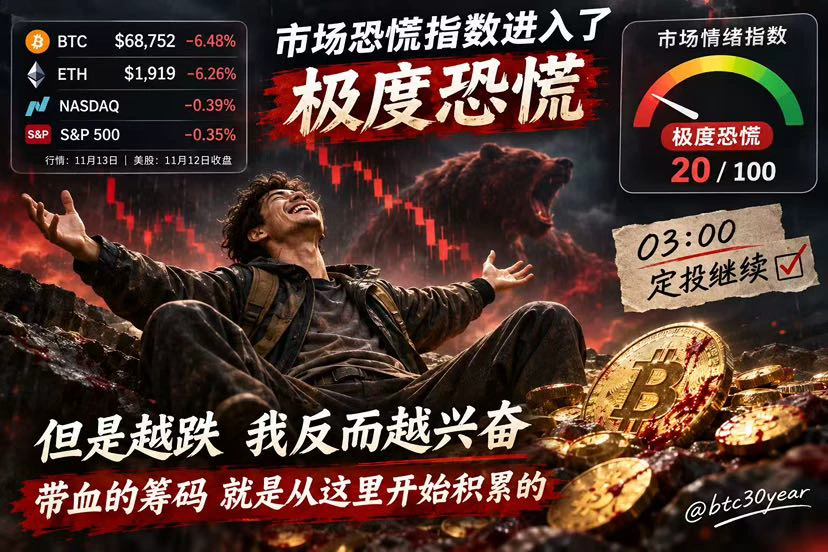
The market fear index has already plunged into the extreme fear zone.

Strangely, the lower it falls, the more excited I get.

Because I know very well:

In a bull market, everyone says they want to stack coins, but when prices really drop, hardly anyone dares to buy.

At 70k, they don't dare buy; at 60k, they fear it could go to zero. When it really climbs back to 100k, they start regretting not getting in.

Blood-soaked chips are never picked up amid cheers. They're slowly accumulated amid curses and despair.

I don't try to call the bottom, and I don't go all in.

Every day at 3 a.m., the a
post-image
BTC-0.67%
  • 2
Gold Market watch
live-cover
LIVE1,890
Does a sudden surge in trading volume signal a strengthening trend or a market reversal?

In crypto markets, a sudden increase in trading volume often catches traders’ attention. Some see it as a sign that capital is flowing in, while others worry that major players are exiting.

With the same surge in volume, why does the price sometimes keep rising, while at other times it suddenly reverses?

The key is that trading volume reflects changes in market activity, but on its own, it cannot show that buyers or sellers necessarily have the upper hand.

First, observe how the price behaves when volu
post-image
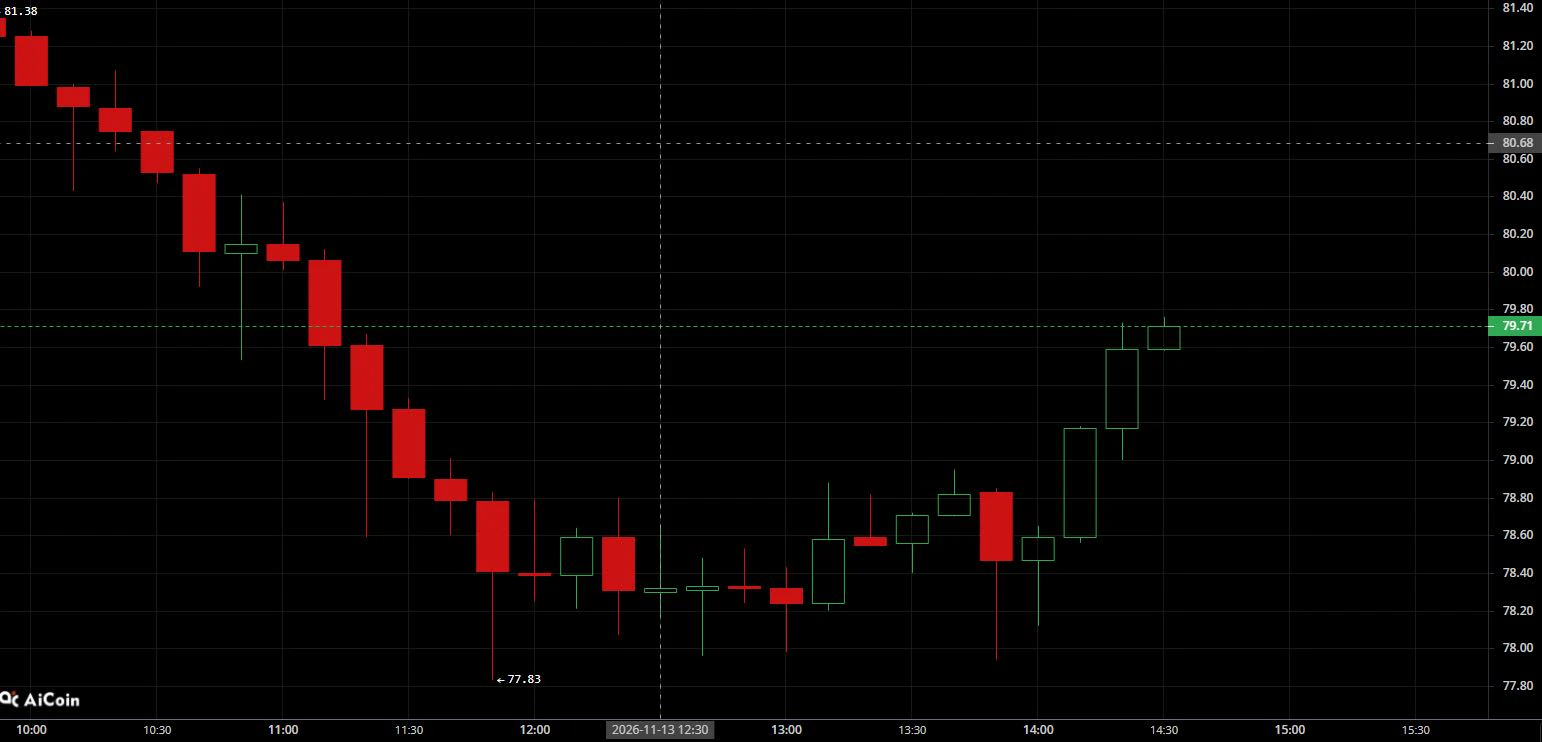
The Solana trade idea played out✅. A short position was entered near 80.50–81.5. Solana weakened in tandem with BTC and ETH, dipping as low as 77.83, and the bearish momentum unfolded in sync as well.$SOL
#美国10月PPI即将出炉
post-image
XiaoXinBit
Xiaoxin | 11.13 Solana outlook$SOL
Short around 80.50-81.5 on a rebound, with a stop above 81.6; target 79.90-79.50. Consider going long if price retests and stabilizes near 79.50.
Solana has weakened in tandem with BTC and ETH. Bears broke below the previous consolidation range on increased volume, and the market’s center of gravity continues to move lower, with the overall downtrend clear. The current slight rebound is a technical correction after the decline. The previous support platform has turned into resistance after the breakdown, while bullish support is weak and buying follow-through is lacking. Bearish sentiment across the broader market is weighing on prices, and selling pressure could resurface if the rebound reaches the resistance zone. Until price regains a foothold above resistance, prioritize following the trend and looking for a pullback under resistance.
#白宫提交CFTC与SEC两党委员提名
SOL-0.77%
Who can use AI to make her wish come true?
post-image
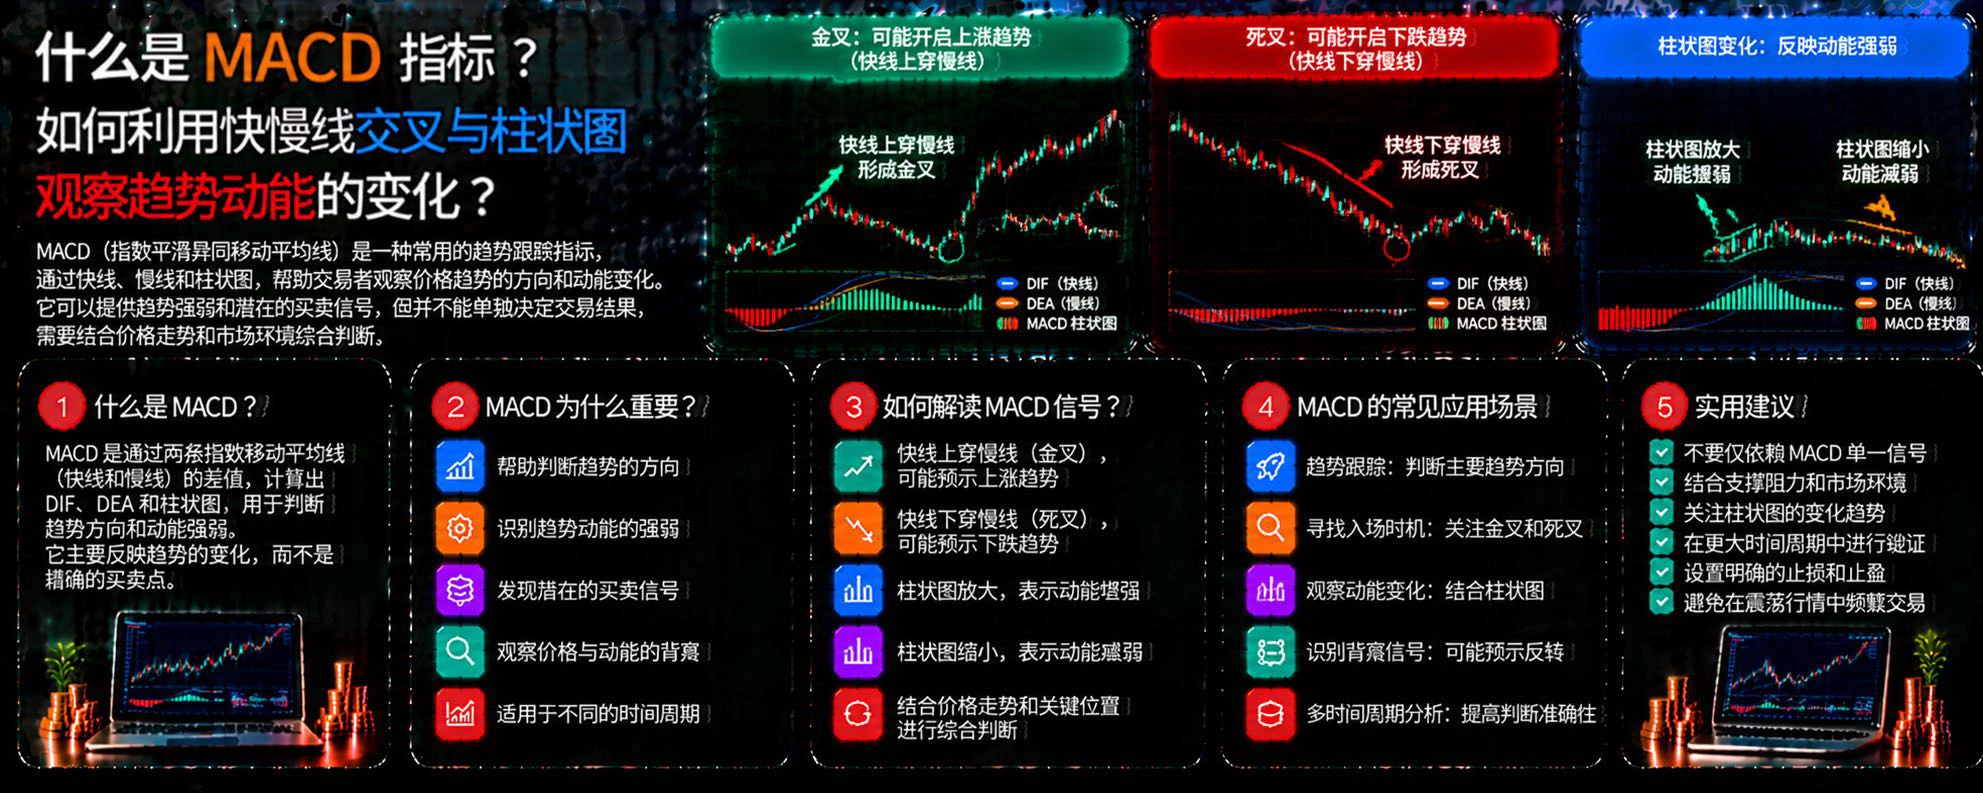
What Is the MACD Indicator? How Can You Use Fast and Slow Line Crossovers and the Histogram to Observe Changes in Trend Momentum?

In cryptocurrency trading, short-term price fluctuations can easily cloud judgment. MACD is a common trend-following indicator that helps traders analyze trend direction and momentum by observing the crossovers of two lines and changes in the histogram. However, it cannot accurately predict every price move and is not suitable for use in isolation from market conditions.

First, what is MACD?

MACD stands for Moving Average Convergence Divergence, and its common se
post-image
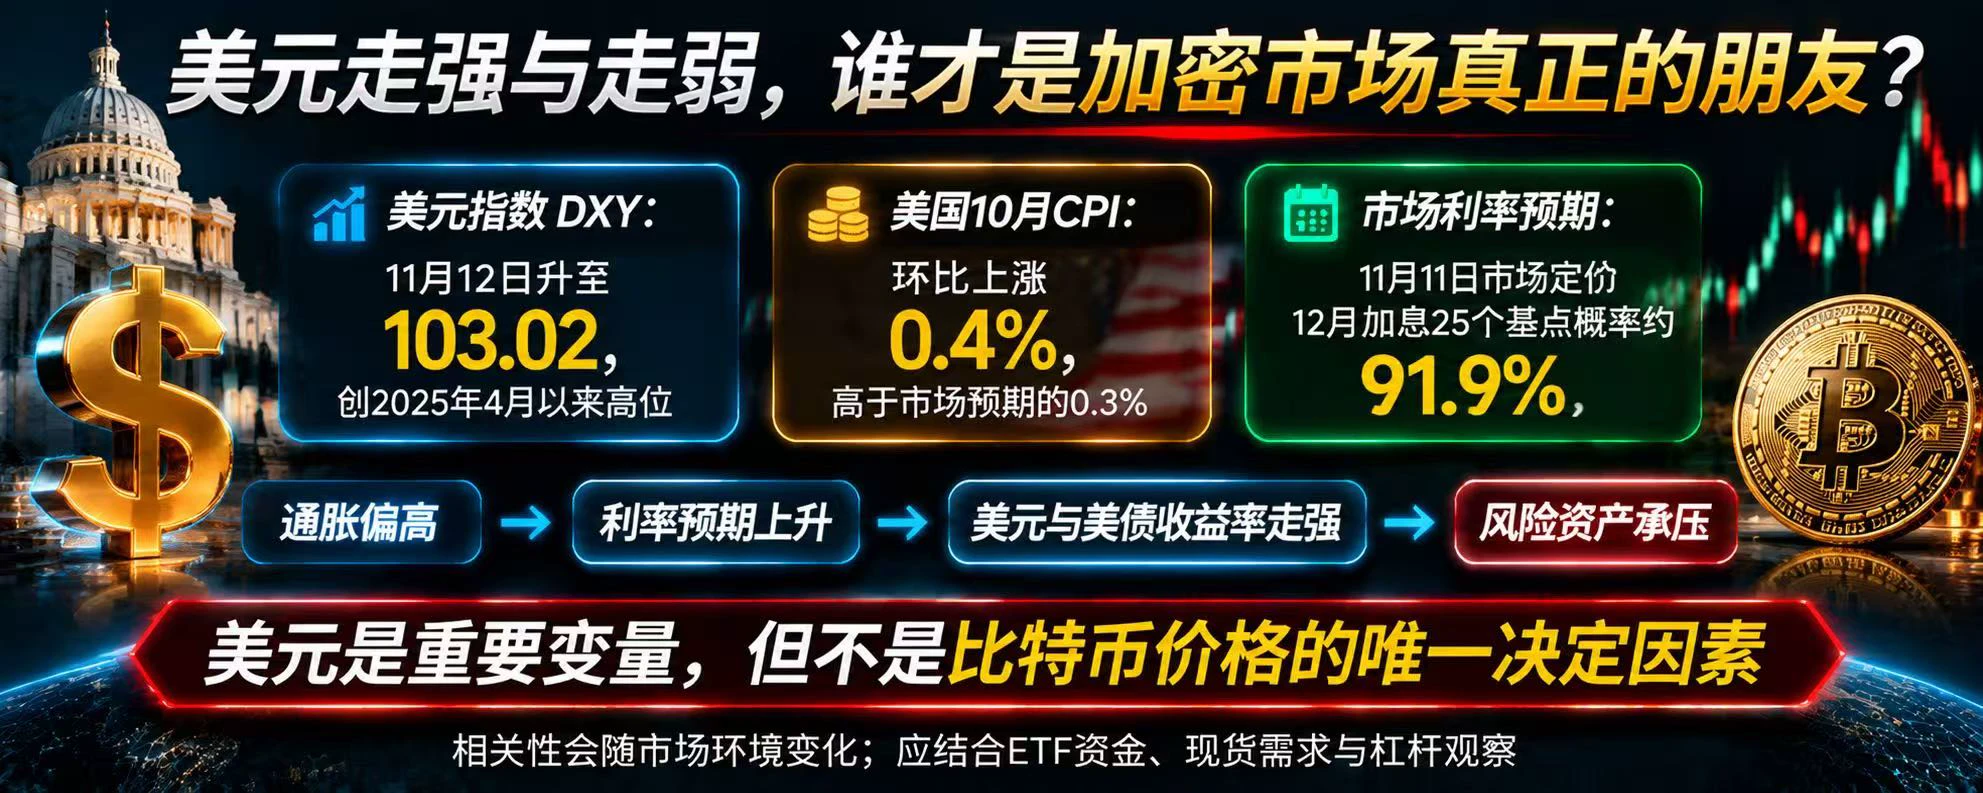
Who Is the Crypto Market’s True Friend: a Strong or Weak Dollar?

Many people believe that when the dollar falls, Bitcoin rises, and when the dollar rises, Bitcoin falls. But real financial markets are far more complex than this simple rule.

The dollar is an important pricing currency in the global financial system. When it strengthens, it often means global capital is reassessing the US economy, interest rates, and risk-return prospects. If expectations for US interest rates continue to rise, dollar-denominated assets may become more attractive, while other risk assets may come under capital
post-image
BTC-0.67%
USIDX+0.00%
BTC falls below $71k, hitting its lowest level since September! The $70k level is under threat—where
live-cover
LIVE4,907
$AKE The bullish signal has been confirmed, and the current structure is worth watching.

Pending order range: 0.003180 – 0.003320, scale into long positions
First target: 0.003500 Second target: 0.003700 Third target: 0.004000 Stop level: 0.002900
Over the past year, this asset has gained +66.07%, and the trend foundation remains intact. If the current price pulls back to the entry zone, the risk-reward ratio is attractive. Consider testing with a small position and scaling in progressively.
Risk warning: The above is solely a personal market opinion and does not constitute investment advice.
post-image
AKE+6.39%
🔥 Share Daily, Earn Daily!
Post on topics and claim up to 10 USDT in Red Packets!

🎁 Rewards
1️⃣ Red Packets: New users 100% win, with 0.01–10 USDT per reward!
2️⃣ Weekly Leaderboard: Win up to 100 USDT!

📢 Today's Hot Topic | Jensen Huang Resigns as NVIDIA CEO
NVIDIA announced Jensen Huang's resignation, sending shockwaves through the market as $NVDA shares plunged.Is this a short-term selloff or a turning point for NVIDIA's long-term valuation?

📌 How to Join
1️⃣ Register: https://www.gate.com/campaigns/6244
2️⃣ Post your views with #ShareWeekly and #JensenHuangResigns

👉 Share Your V
post-image
NVDA-4.49%
  • 5
  • 1
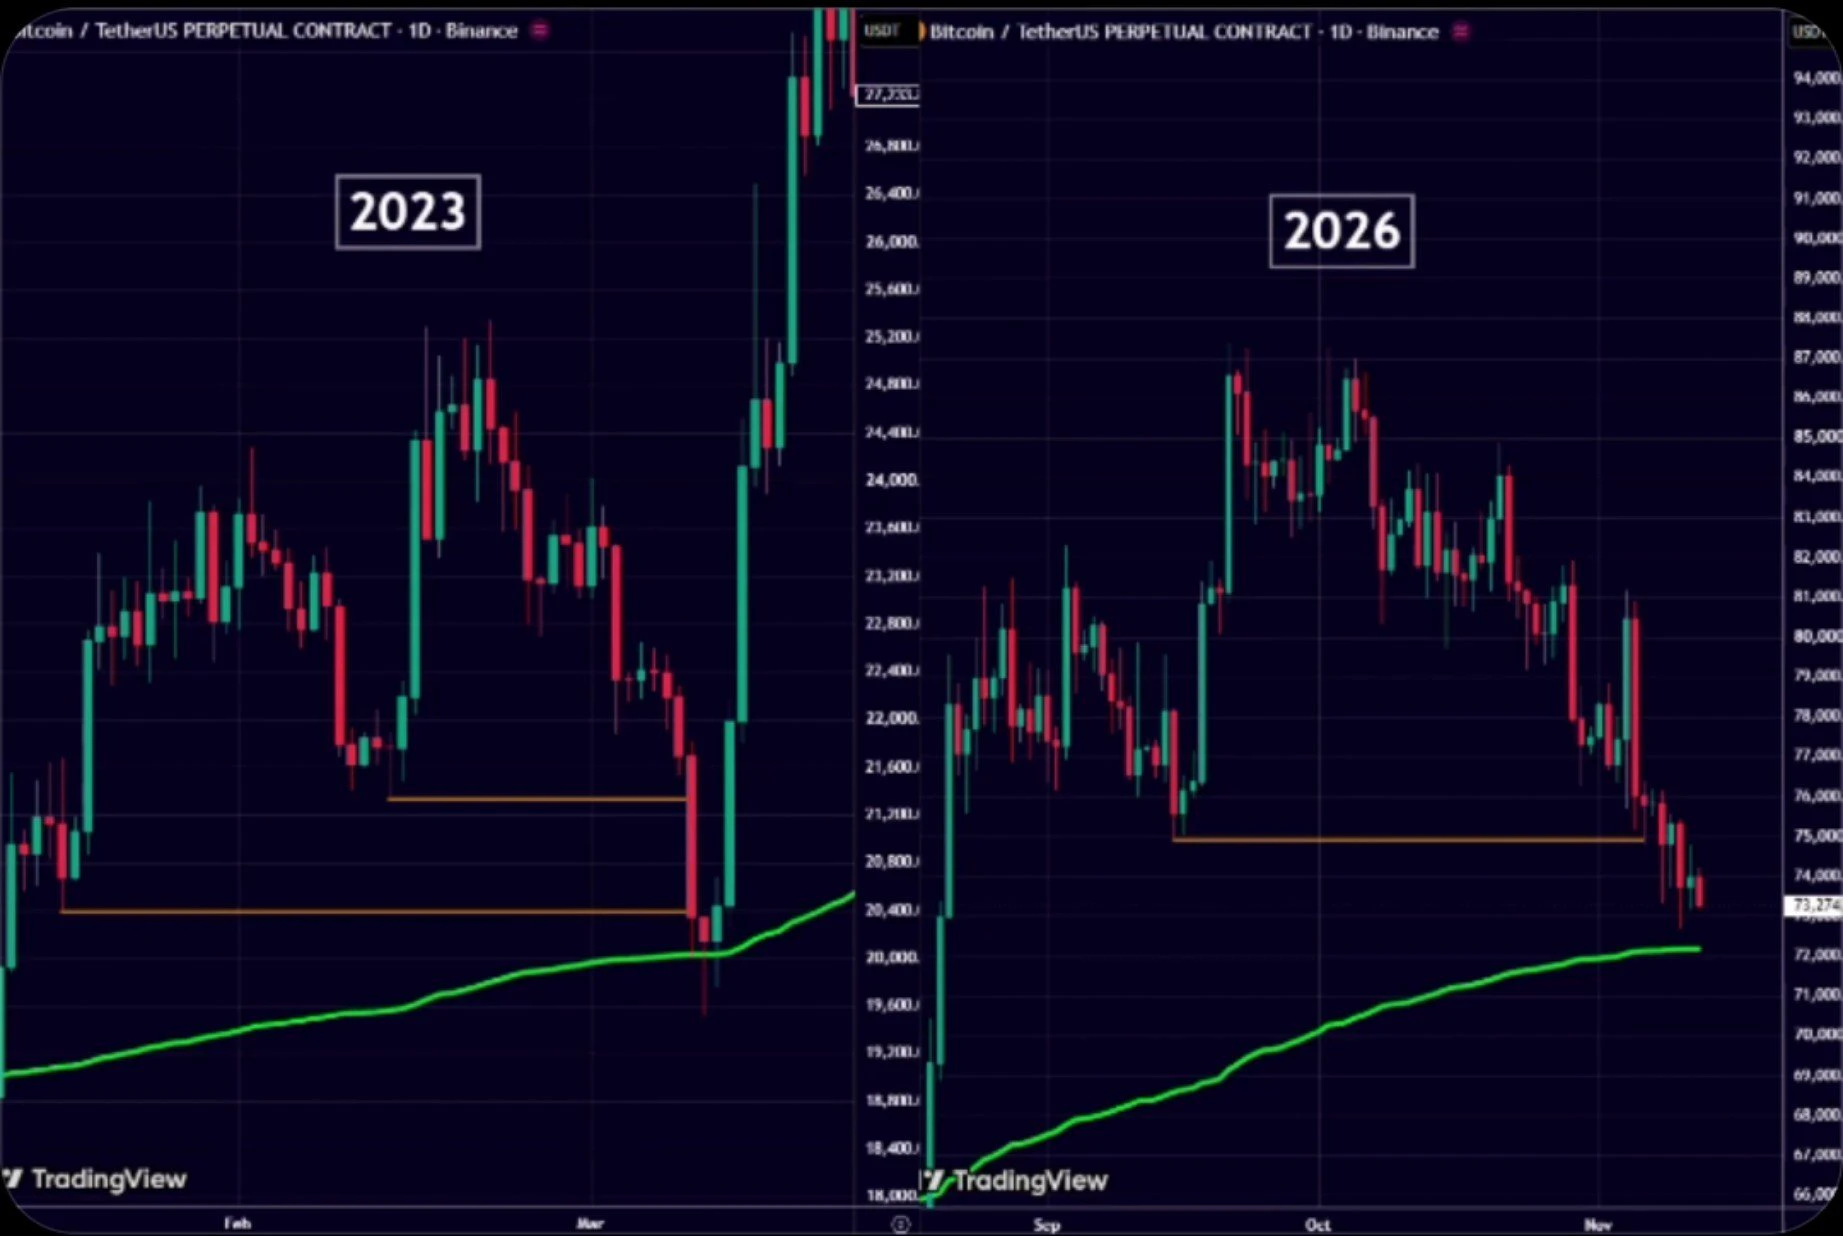
Bitcoin’s current price action looks exactly like 2023 all over again.

The same structure, the same support levels, the same “scare you first, then pump” script.

By the time most people realize what’s happening, the price has already taken off.

Get your position in place while nobody’s paying attention. $BTC ‌
post-image
BTC-0.65%
  • 1
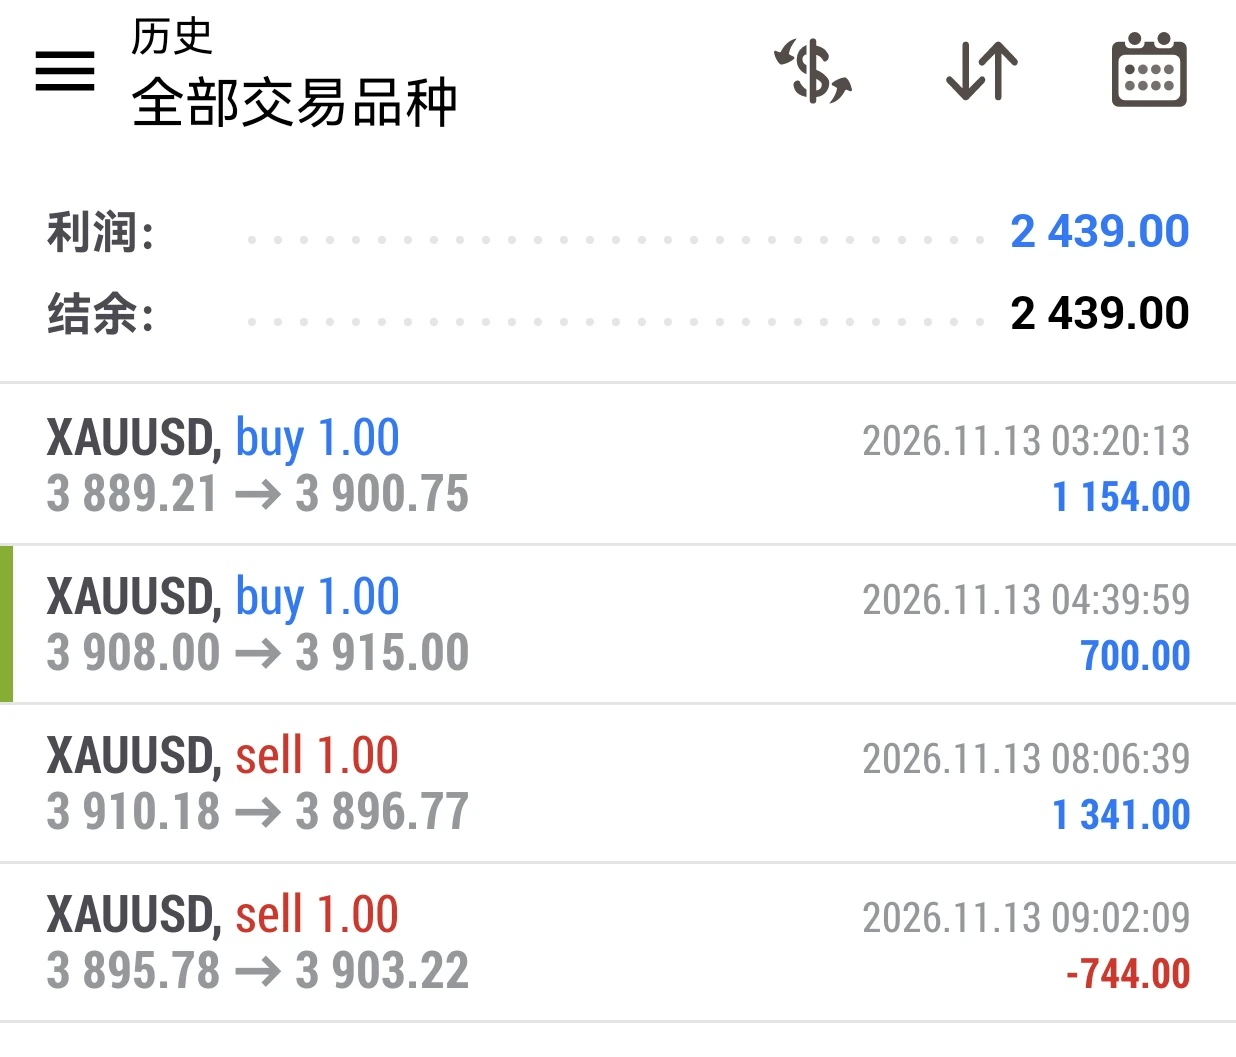
Intraday winning streak snapped, another surge higher hit stop-losses$XAU #BTC跌4% #黄金
post-image
XAU+0.38%
Load More

Join 40 M users in our growing community

⚡️ Join 40 M users in the crypto craze discussion

💬 Engage with your favorite top creators

👍 See what interests you

Trending Topics

JensenHuangResigns

508.8K Views7.8K Discussing

Jensen Huang has resigned as NVIDIA CEO and stepped down from the board. CFO Colette Kress will serve as interim CEO while NVIDIA considers internal and external successors. $NVDA fell more than 10% in premarket trading following the announcement. With one of AI’s most influential leaders stepping aside, markets are now reassessing NVIDIA’s leadership stability, AI strategy, and long-term valuation.

GateIPOAccessAnthropic

276.3K Views2.6K Discussing

Dr.HanOxfordUnionSpeech

143.8K Views416 Discussing

View More