Share your thoughts
placeholder
Article
BNB Surpasses 770 USDT with a 7.24 Increase in 24 Hours
live-cover
LIVE1,503
#GateEventContractTradeSharingChallenge
The Real Edge Isn’t the 5 USDT Rebate — It’s How Efficiently You Earn It.
Gate’s Event Contract Trade Sharing Challenge offers attractive incentives, including 5 USDT rebates and lucky draws. But smart traders know that the headline reward is only one side of the equation.
The real question is:
How much does it actually cost to complete a qualifying trade?
That’s where execution friction becomes critical.
🔍 1. Spread vs. Rebate
A 5 USDT rebate sounds attractive until spread and slippage consume most of it. Before entering a qualifying trade, check the
60 million users reached! Do you remember your first trade?
Gate's global user base has officially surpassed 60 million.
Seeing this number, my first reaction wasn't “There are really so many users,” but a sudden realization: behind it are actually 60 million completely different crypto journeys.
Some may be veterans who joined Gate in 2017 and experienced cycle after cycle of bull and bear markets; some entered during the hottest market in 2021 and saw a major rally on their very first coin purchase; others may have just registered and are still figuring out the difference between “spot” and
BTC+0.28%
$ZEC — Bulls Are Still In Control
$ZEC just delivered a massive breakout, ripping from the consolidation zone toward $1,223.
The 1D structure is clearly bullish: 📈 Strong impulsive candles
📈 Breakout from the previous range
📈 Buyers maintaining control
📈 Higher highs with aggressive momentum
Now the key area is $1,220–$1,225.
A clean breakout and daily close above this zone could open the door for another leg higher.
But after such a vertical move, a pullback or consolidation would be completely normal. I’d rather see $ZEC build support than chase the candle.
Trend is strong. Let the pri
post-image
ZEC+16.77%
A few days ago, I was still calculating whether I had enough money for instant noodles this month; this morning, I was already thinking about whether to add sausage 😂. I opened my account and saw that 0.4595 had already moved well below 0.5290, with +936.23% secured—my instant noodles got upgraded with sausage.

Going back to when everyone was still waiting on the sidelines, $JTO the rebound was clearly weak at the key level, and several attempts failed to bring in enough volume. I judged that the selling pressure above was too heavy, so I opened a short position directly. Panic comes from h
post-image
JTO+10.21%
BTC+0.27%
SOL+3.85%
$AVAX Avalanche Is Getting Ready To Push To The Upside
Entered into the long on $AVAX.
Price action is preparing for an advance to the upside.
The 1D money printer formation will complete at about $8.06.
If the 1D 200MA is flipped the we look to the 2D money printer formation. Currently the 2D 200MA is at $13.23.
Remember that moving averages are dynamic just like price action. This mean it is always moving.
Could see some nice move for $AVAX soon.
NFA, DYOR ⚠️
#Crypto #Trading #AVAX
post-image
AVAX+1.93%
$ACE — What’s the next move? 👀
The 4H structure is still bearish. Since the rejection around $0.289, ACE has been printing a clear sequence of lower highs and lower lows.
Current price: ~$0.168
My read: ACE is sitting near support. If $0.160–0.165 breaks decisively, another leg lower becomes likely.
But if buyers reclaim $0.179–0.192 and hold it, that would be the first meaningful sign of a structure shift and could trigger a stronger relief rally.
So right now: bearish until proven otherwise. 📉
post-image
ACE-4.28%
How is this a rebound? This is CPR for my empty account, isn’t it? 😏

That surge before bed a few days ago looked pretty intimidating, but I watched it for quite a while and the volume simply didn’t follow through. $BEAT was pressed back down by overhead resistance every time it tested a high. I gave a short signal right at the resistance level, without trying to call the bottom or chase the trade—just waiting for the rebound to lose momentum before making a move. 🔥

Now the price has ground down to 0.1247, and against our short entry at 0.1339, a +133.81% return is sitting right there on
post-image
BEAT-0.16%
LAB-3.59%
BNB-1.08%
Everyone’s staring at DOGE’s pump—but the 4H clock just ticked against the crowd.

$DOGE /USDT - SHORT

Trade Plan:
Entry: 0.08974 – 0.09032
SL: 0.09277
TP1: 0.08797
TP2: 0.08660
TP3: 0.08454

Why this setup?
Why now? The 1D range is the cage, and price is pinned at 0.09003—dead center of your entry zone. RSI on the 15m is cooling at 42, not oversold, just weak. With ATR at 0.001143, the squeeze is tight: if 0.08974 breaks, TP1 (0.08797) is a 2.3% slide, but TP3 (0.08454) is a 6% vacuum. The short bias is armed, not screaming—55% confidence says “probable,” not “certain.” The invalidation a
DOGE+2.74%
Everyone’s chasing SKYAI pumps, but the 4H chart just whispered a 95% secret.

$SKYAI /USDT - SHORT

Trade Plan:
Entry: 0.05863 – 0.05919
SL: 0.06161
TP1: 0.05688
TP2: 0.05554
TP3: 0.05351

Why this setup?
- The 1D trend is bearish, and our 4H bias flips SHORT with 95% confidence—this isn’t a guess, it’s a freight train.
- RSI on the 15m sits at 49.54—neutral, but that’s the calm before the breakdown, not a bounce signal.
- Entry zone: 0.05891–0.05919. If we lose 0.05865, the invalidation triggers—but until then, TP1 at 0.05688 is the first exit ramp, TP2 at 0.05554 is the real money.
SKYAI-0.53%
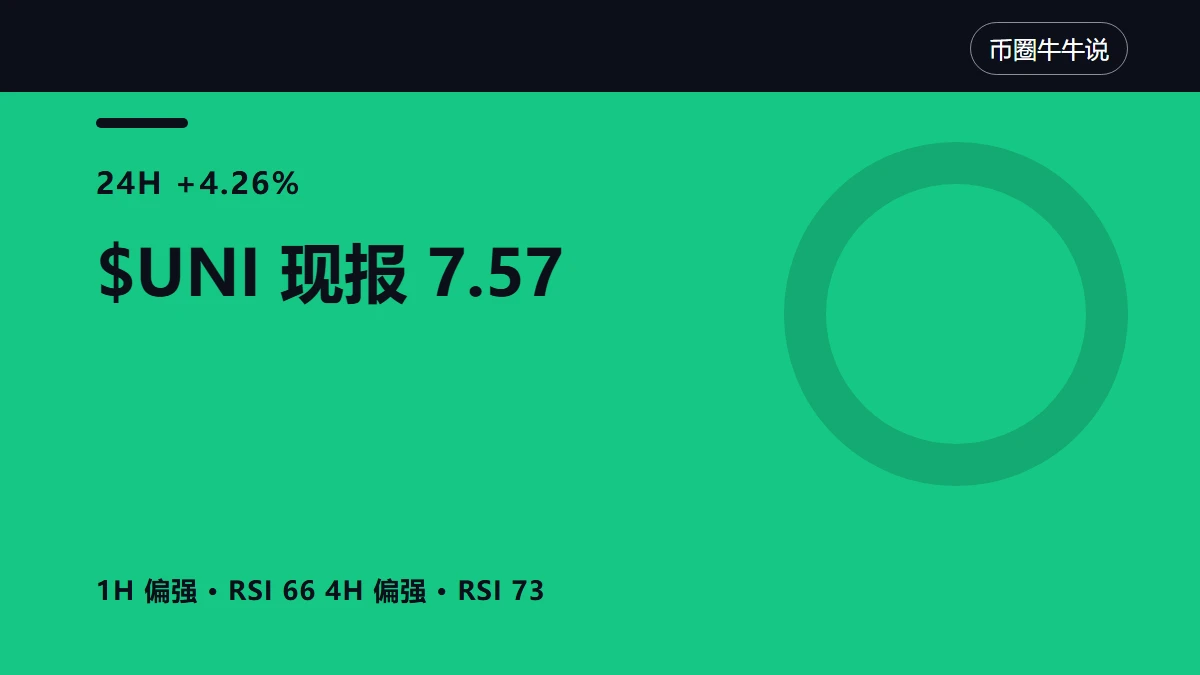
I did nothing—just went to the restroom, and when I came back, the candlestick chart had already done the work for me. During the repeated intraday swings, $UNI pulled back to a key level. It didn’t break through, and every dip was pulled back up by buying pressure. Once it held the retest, I judged that this was the opportunity and entered directly around 4.490. It then took off.
For a trade I’m not confident in, taking a look is clear-headed, but buying even one unit is foolish. I understood this trade, so I was able to hold it. The current price is 7.053, with returns reaching +2582.3%. It
post-image
UNI+11.95%
ADA+1.67%
ETH+1.73%
I just switched the software to the background, and it shot right back up—are you playing hide-and-seek with me?

I said it during the intraday bottoming phase: every time $ASTER dipped, someone stepped in to buy. The longer it moved sideways at the bottom, the cleaner the weak hands were shaken out, and buying pressure was quietly strengthening. That wasn’t weakness—it was building up power.

Later, everyone saw it too: from 0.6658 to 0.7672, floating profit +1083.53%. This move gave us the answer; keeping an eye on the market wasn’t in vain.

As for my trades, I’ve taken 80% profit first
post-image
ASTER-5.40%
ETH+1.73%
BNB-1.08%
[$COTI Signal] Long: Negative funding rate short squeeze + 4H breakout
$COTI 4H Bollinger upper band at 0.0177 was broken, with the current price at 0.017886. The funding rate is -0.0811%, with shorts continuously paying fees. OI is stable; the price has reached a new high while open interest has not followed, leaving ample fuel for a short squeeze. The 1H RSI at 63.24 has cooled significantly from 80.88 on the 4H, and short-term overheating has been absorbed. Order book depth imbalance is -21.44%, with sell orders suppressing price around 0.0185, while buying support remains at 0.0178.
🎯Dir
COTI+19.88%
BTC returns to $81,000! The market rebounds after finding suppor
live-cover
LIVE1,080
🔥 Which Memes are heating up fast in this wave?
$MARSCOIN , $USELESS , $PONS , $BASECAT , and $牛来 have been active recently, with new and established Meme hotspots taking turns leading the market.
From hundredfold narratives to new-chain Memes, and from established favorites to market newcomers,
opportunities in the Meme market often lie in the next rotation of hotspots.
Hot Memes, all on Gate Futures
Join the Robinhood Meme frenzy now: New users get 3 USDT on their first order, and trading rewards can reach up to 8,000 USDThttps://www.gate.com/announcements/article/101528
MARSCOIN-18.49%
USELESS-9.80%
PONS-0.87%
BASECAT-4.62%
牛来-12.65%
I originally wanted to hold the position until the end of time, but it obediently came down on its own. 😂

When I checked the chart after lunch, the resistance above $TSLAX was too obvious. Every time it moved up, there was no one willing to take the other side, and the rebound was pitifully weak. I directly said this was where the bears should step in, so I opened a short on the rebound and left the rest to the market. Sure enough, it slowly declined afterward, with the rhythm basically on point. 🙌

I entered at 361.69, and it has now reached 356.94, with a +118.22% return already in my p
post-image
TSLAX+0.45%
LAB-3.59%
ADA+1.67%
This was purely the market being in a good mood and casually tossing out some gold coins—one just happened to hit me on the head. 🤔 While everyone else was running, I instead spotted a shorting opportunity on $MOVR —a drop isn’t panic; a low-volume rebound is the real bull trap, and insufficient buying support is the shorts’ best fuel.

I opened a short position around 0.995, and before long, the market had moved down to 0.816, with the account showing +216.35%. Those who got on board should be laughing in their sleep—the price dragged its feet for ages on the way up, then came down cleanly
post-image
MOVR+0.62%
BTC+0.27%
ADA+1.67%
Analyst notes Bitcoin’s 365-day net spot buying volume just topped $83B, the strongest since the last bear market, signaling improving demand even as futures still dominate. $BTC
post-image
BTC+0.28%
#BTCReclaims80K
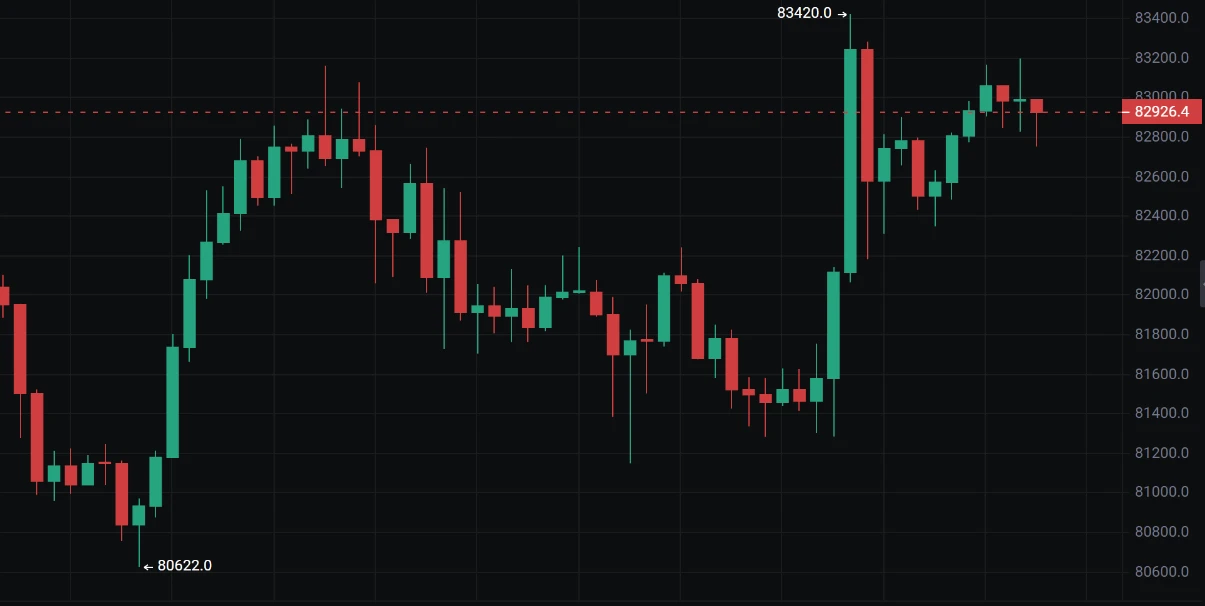
BITCOIN AT $79,907: THE $80K BATTLE IS NOT OVER
Bitcoin is back at $79,907, sitting just below the psychological $80,000 level after a week of violent swings. The market has already shown that bulls are willing to defend the lower levels, but Friday’s jobs shock proved that macroeconomic data can still overpower even strong institutional demand.
The real question now is simple:
Is BTC preparing for another breakout above $80K, or is this just another temporary recovery before a deeper correction?
📊 THE WEEK IN ONE VIEW
Bitcoin has experienced an unusually wide range over the
BTC+0.28%
Everyone’s watching ASTER’s range—but the 4h chart just whispered a secret most traders missed.

$ASTER /USDT - SHORT

Trade Plan:
Entry: 0.7760 – 0.7838
SL: 0.8173
TP1: 0.7519
TP2: 0.7332
TP3: 0.7051

Why this setup?
- RSI at 47.8 on the 15m shows zero bullish momentum, just dead air before the drop.
- ATR (0.0156) is coiling tight—this range is a spring, and shorts are the trigger.
- Why now? Entry ref 0.7799 sits mid-range, but TP1 at 0.7519 is only 3.6% away—low risk, high probability.
- Trend 1D is “range,” but range lows always break when RSI flattens like this.

Debate:
Are we
post-image
ASTER-5.40%
Load More

Join 40 M users in our growing community

⚡️ Join 40 M users in the crypto craze discussion

💬 Engage with your favorite top creators

👍 See what interests you

View More