Square
Following
Hot
News
Profile
Share your thoughts
placeholder
Article
$BTC BTCUSDT
Bitcoin is currently attempting a recovery after a sharp bearish move, following a strong rejection from higher levels and a liquidity sweep near the 80,500 –81,000 region. Price has bounced back toward $83,800, but the broader structure remains under pressure while BTC trades below the descending trendline.
The next move will depend on whether buyers can break and hold above the nearby resistance zones or sellers step back in and resume the bearish trend.
Key Levels to Watch
Resistance: 85,250 / 86,515
Support: 83,000 / 82,600
Strong Support: 81,800 / 81,200
As long as Bitcoin re
post-image
BTC+0.98%
Tom Lee: Ethereum may break $5,000 by the end of the year, and this cycle is expected to hit $50,000.
Tom Lee said in an interview that Ethereum could rise to $25,000–$50,000 in this cycle and may exceed $5,000 by the end of the year. According to him, ETH has been trading in the same range for five years, and prolonged accumulation could form the basis for a major breakout. If Bitcoin rises above $100,000, ETH could reach approximately $7,500.
It is important to understand: this is a forecast, not a guarantee. Traders, according to the prediction market, estimate the probability of reaching $
ETH+1.15%
BTC+0.99%
$XAU /USDT is about to break range in a direction nobody expects

$XAU /USDT - SHORT

Trade Plan:
Entry: 4208.70 – 4210.06
SL: 4215.91
TP1: 4204.48
TP2: 4201.22
TP3: 4196.32

Why this setup?
Why now? The 1h price is sitting at 4209.38 inside a tight entry zone between 4208.70 and 4210.06, which is the exact level the daily range has been respecting all week. The 15m RSI is at 76.76, showing the short-term move is stretched and due for a mean reversion. The 1h ATR of 2.720633 tells us the average hourly swing is small, so a single spike can carry the price from the entry straight to TP1 at 4
XAU+0.20%
If market pumps, $troll will go parabolic.
Fud can be deleted. Chart can always be reversed in crypto.
post-image
TROLL+5.56%
TROLLFACE-10.94%
Nobody is talking about this SYMBOL setup while the 15m RSI whispers oversold.

$US /USDT - LONG

Trade Plan:
Entry: 0.01145 – 0.01219
SL: 0.00722
TP1: 0.01527
TP2: 0.01757
TP3: 0.02102

Why this setup?
Why now? The 4h trend is range-bound, but the 15m RSI sits at 16.82, signaling a sharp exhaustion that often precedes a snap-back move. The 1h ATR of 0.01181 shows the average hourly volatility is compressing into the entry zone between 0.01145 and 0.01219, a tight band where a breakout is overdue. If price pushes to TP1 at 0.01527, it validates the long thesis immediately, with TP2 at 0.017
US-37.75%
Singapore F1 with Gate Team! $GT #f1
GT+3.30%
  • 1
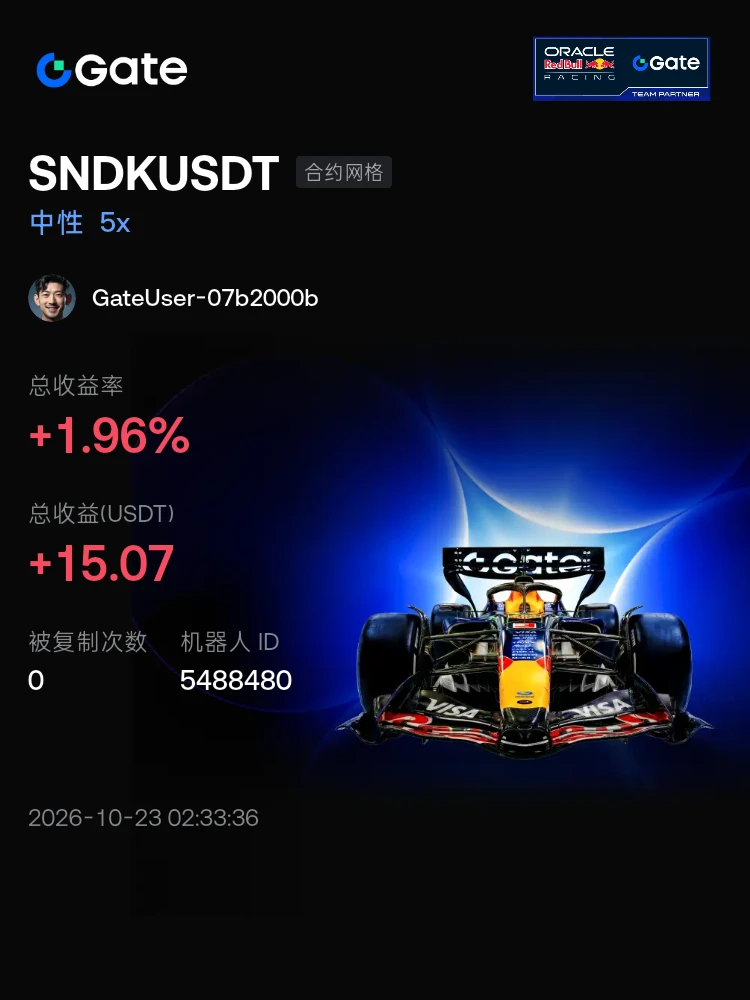
#Share My Holding Returns# $STAMP
post-image
STAMP-0.33%
  • 2
$ETH USDT Long Setup
🟢 Entry Zone: 2,520 - 2,545
🎯 TP1: 2,640
🎯 TP2: 2,700
🎯 TP3: 2,780
🛑 SL: 2,470
ETH bounced off 2,405 and is now back above the MA7 and MA25, with the MA99 around 2,642 as the next real test. Volume is thin, so I wouldn’t chase. Spot/Alpha holders can just hold; I’d only add on a clean 4H close above 2,640. Lose 2,470 and the setup is off.
⚠️ This is not financial advice. Always do your own research (DYOR).
post-image
ETH+1.16%
$BTC 🚨A sudden upside breakout early Monday! Don’t blindly chase longs! The core logic behind this rally + entry levels explained in full
Many people saw the market surge in the early hours, got hot-headed and chased the top, only to get trapped as prices pulled back after spiking! Today, we’ll break down the underlying drivers of this breakout, the criteria for distinguishing a real breakout from a fake one, and subsequent entry opportunities—nothing superficial.
1. Direct catalyst: concentrated short squeeze and liquidations
After an extended period of narrow-range movement over the weekend
BTC+0.99%
$LUMIA 's two charts are giving opposite answers: the short term has already turned, but the larger timeframe refuses to acknowledge it. I would rather lay out the counterargument first.
Bears see the risk of breaking below 0.1008, while bulls need to prove that buyers remain after a breakout above 0.1833. Current volume is 0.66x.
The current price is 0.13, approximately 22.46% from the 1-hour support at 0.1008 and 41.00% from the resistance at 0.1833. Position determines which side is more urgent; the next level to watch shifts to 0.0758.
Letting the boundaries provide the answer is more reli
post-image
LUMIA+19.29%
BTC update
live-cover
LIVE985
this is nuts ngl
post-image
$BTC USDT Long Setup
🔴 Entry: 83,000 - 83,500
🎯 TP1: 84,800
🎯 TP2: 86,000
🎯 TP3: 87,300
🟢 SL: 82,200
BTC bounced off the 80.4K low and is now testing the MA(99) near 84,050, with MA(7) and MA(25) holding underneath. Volume is quiet, so I'd rather buy a small dip than chase.
⚠️ This is not financial advice. Always do your own research (DYOR).
post-image
BTC+0.98%
  • 1
“Machi Big Brother’s Position Checkup: One ATM, Two Bleeding Points”📊
$BTC : 40X full-position short, -243.96 coins. Entry at $84070, liquidation at $105740.41. Unrealized profit of +$259,600, funding income of +$51,200—temporarily looking like an ATM.🤑
$ETH : 25X full-position long, 8742.06 coins. Entry at $2546.58, liquidation at $1844.71. Unrealized loss of -$405,500, funding cost of -$9867.82. Still some distance from liquidation, but the wound is widening.😬
$HYPE : 5X full-position short, -233,900 coins. Entry at $63.9481, liquidation at $106.59. Unrealized loss of -$4,861,700, the big
post-image
BTC+0.98%
ETH+1.16%
HYPE+1.35%
Layout: Bitcoin, Ethereum, Dogecoin
live-cover
LIVE68
$TRUMP ‌TRUMP/USDT – Perp
🇺🇸 Why did Trump pump? Because it promised to make crypto great again. 🗳️
Bias: Bullish structure after breakout above 1.898, now testing resistance at 1.936. Overbought short-term — pullback or continuation likely. 📊
---
📈 Long – Breakout
Entry: 1.936 – 1.940
TP1: 1.960
TP2: 1.985
TP3: 2.010
SL: 1.920
📈 Long – Pullback Buy
Entry: 1.898 – 1.910
TP1: 1.936
TP2: 1.960
TP3: 1.985
SL: 1.880
📉 Short – Rejection
Entry: 1.936 – 1.940
TP1: 1.910
TP2: 1.898
TP3: 1.880
SL: 1.950
📉 Short – Breakdown
Entry: 1.898 – 1.905
TP1: 1.880
TP2: 1.862
TP3: 1.845
SL: 1.920
🟢 Spot
post-image
TRUMP+1.69%
$S USDT Long Setup
🟢 Entry Zone: 0.0540 - 0.0585
🎯 TP1: 0.0667
🎯 TP2: 0.0720
🎯 TP3: 0.0790
🛑 SL: 0.0495
S just went vertical, up about 41% today on a huge volume spike, and price is way above the MA7 (0.0505). That’s stretched, so I’m not chasing the top. A pullback into the 0.054 to 0.058 area is the cleaner spot. Spot/Alpha holders can hold and trim near 0.0667. Lose 0.0495 and the idea is off.
⚠️ This is not financial advice. Always do your own research (DYOR).
post-image
S+40.31%
  • 1
$BTC $ETH
15 trades since October 8, with only two mistakes
The ability is beyond doubt
Tonight's livestream document—save it if needed #BTC回调触及81000美元
post-image
BTC+0.98%
ETH+1.16%
  • 1
Load More

Join 40 M users in our growing community

⚡️ Join 40 M users in the crypto craze discussion

💬 Engage with your favorite top creators

👍 See what interests you

Trending Topics

GateAtTOKEN2049

41.23k Views21.84k Discussing

Gate brought a series of major events to TOKEN2049 Singapore! From the official launch of Gate Money to the F1 Red Bull driver meet-and-greet and the Gate Gala, we witnessed a new chapter of "One Gate, Borderless Finance." Which moment from TOKEN2049 stood out most to you?

LedgerLossesNear90Million

39.49k Views300 Discussing

GateWCTCS9GlobalTradingCompetition

34.52k Views5.15k Discussing

View More