Square
Following
Hot
News
Notifications
Profile
Share your thoughts
placeholder
Article
Analysis new crypto coin
live-cover
LIVE1,836
🔹South Koreas KOSPI Plunges 8, Triggering a Trading Halt! Losses Narrow After Trading Resumes. Are
live-cover
LIVE1,749
Trenches
ZIG
Z
bade
b
ZIG
0x8c...1145
Market Cap
$.
Change
.
24h Vol
$.
Holders
.
BTC
B
bade
b
BTC
C5xp...pump
Market Cap
$.
Change
.
24h Vol
$.
Holders
.
STONK
S
bade
b
STONK
6GmA...UNgx
Market Cap
$.
Change
.
24h Vol
$.
Holders
.
DESSA
D
bade
b
DESSA
npz2...pump
Market Cap
$.
Change
.
24h Vol
$.
Holders
.
Diamond
D
bade
b
Diamond
5VCE...pump
Market Cap
$.
Change
.
24h Vol
$.
Holders
.
Gm chat
Sometimes you need spa day everyday
post-image
Ethereum is pulling back sharply in sync with Bitcoin. After facing resistance at higher levels, selling pressure was released in a concentrated wave, driving prices down consecutively and intensifying the pullback and volatility.

A series of bearish candles on the four-hour chart has broken through multiple short-term support levels, completely undermining the previous weak rebound structure. The rebound itself lacked volume and was weak in quality. After concentrated selling pressure hit, bullish support quickly gave way, and the higher-timeframe trend officially entered a deep correction.
ETH-1.23%
I. The takeaway first
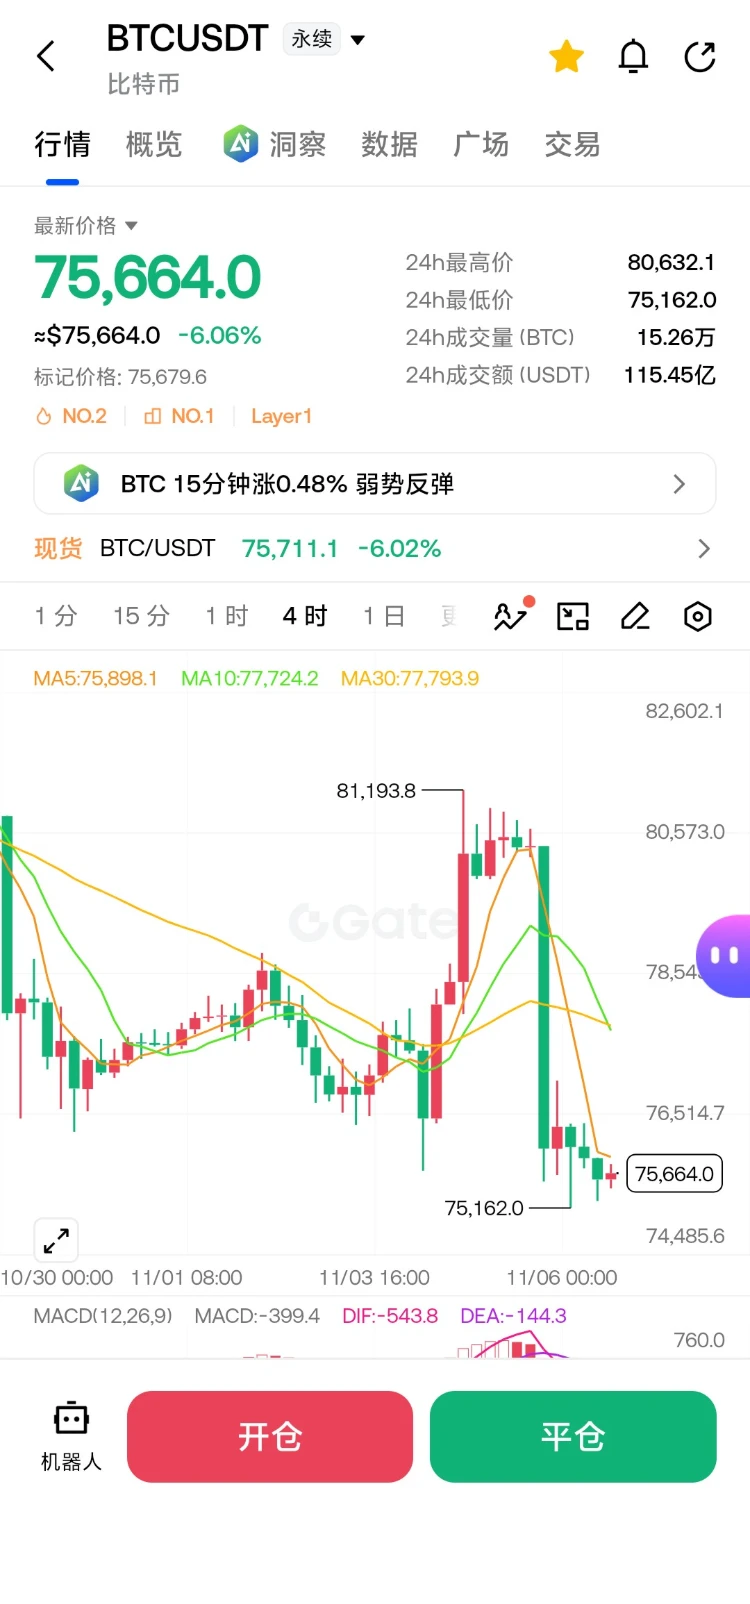
BTC had just moved above 80000 yesterday, but today it was pushed back down near 75000; ETH also fell all the way from 2450 to around 2200.
This is not an ordinary minor pullback, but a sudden reversal in market risk sentiment. The most dangerous move right now is to rush in and buy the dip just because prices have fallen a lot.
As of publication, BTC was around 75600, with a 24-hour high of 80790 and low of 75200, down more than 6%; ETH was around 2225, with a high of 2434 and low of 2206, down more than 8%.
The structure has turned weak again, but after consecutive decl
post-image
ETH-1.26%
BTC-0.67%
The drop in the storage sector this time has been pretty extreme 😑

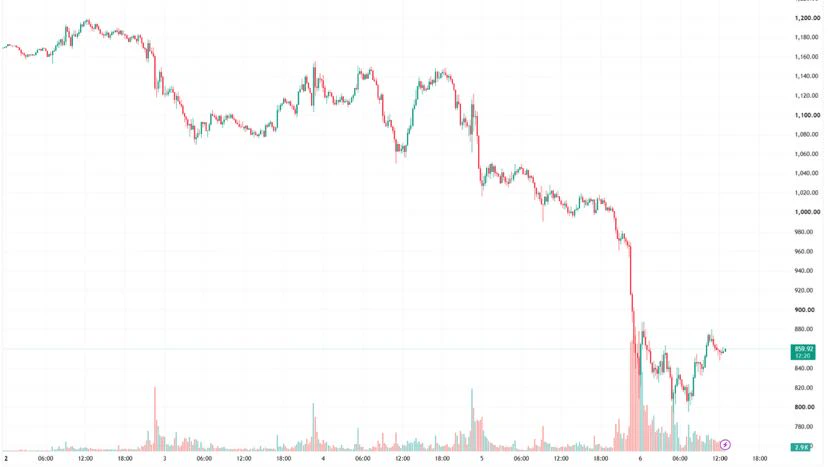
SanDisk $SNDK plunged more than 22% overnight, Micron $MU fell over 17%, and South Korea's SK Hynix $SKHYNIX was also down over 13% at one point in morning trading

Several storage leaders have been hit by selling almost simultaneously. What's going on with the market? Here are some personal thoughts

Previously, the market's pricing logic for storage was very clear: the expansion of AI computing power drove HBM demand, data center investment boosted DRAM and NAND demand, and relatively tight supply further reinforced expe
post-image
SNDK-0.18%
MU-0.63%
SKHYNIX+1.41%
  • 9
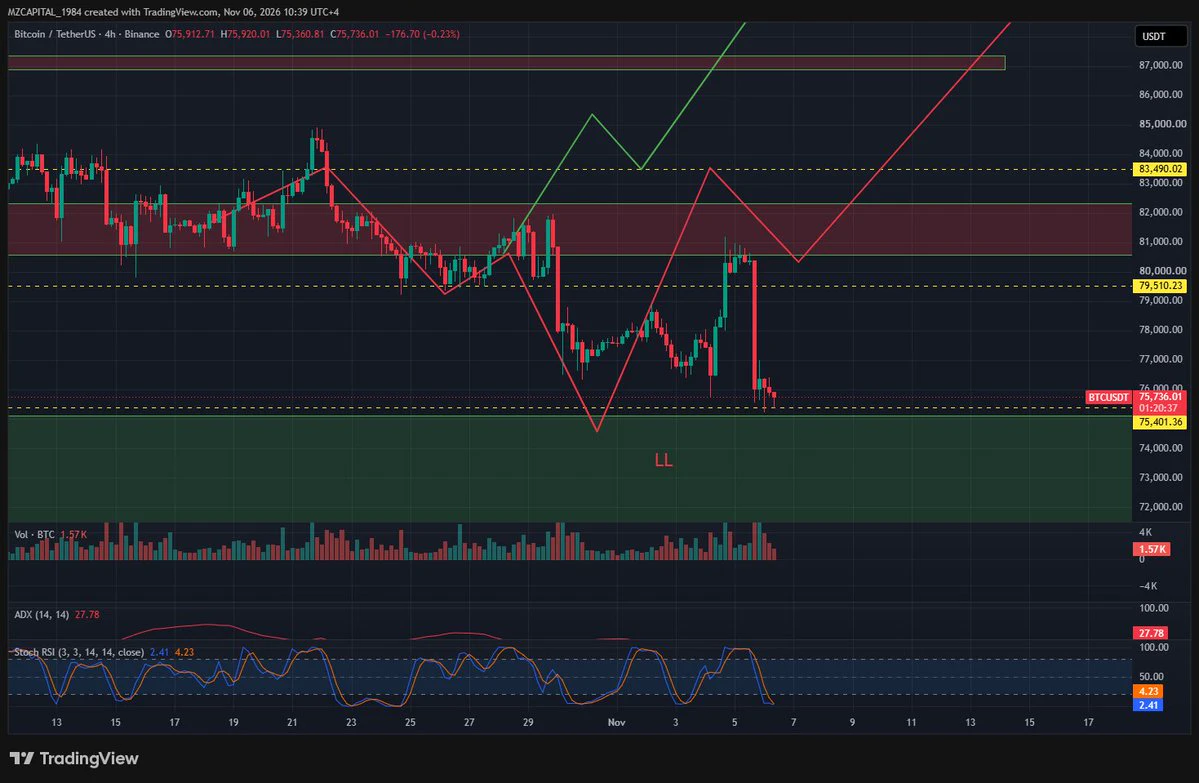
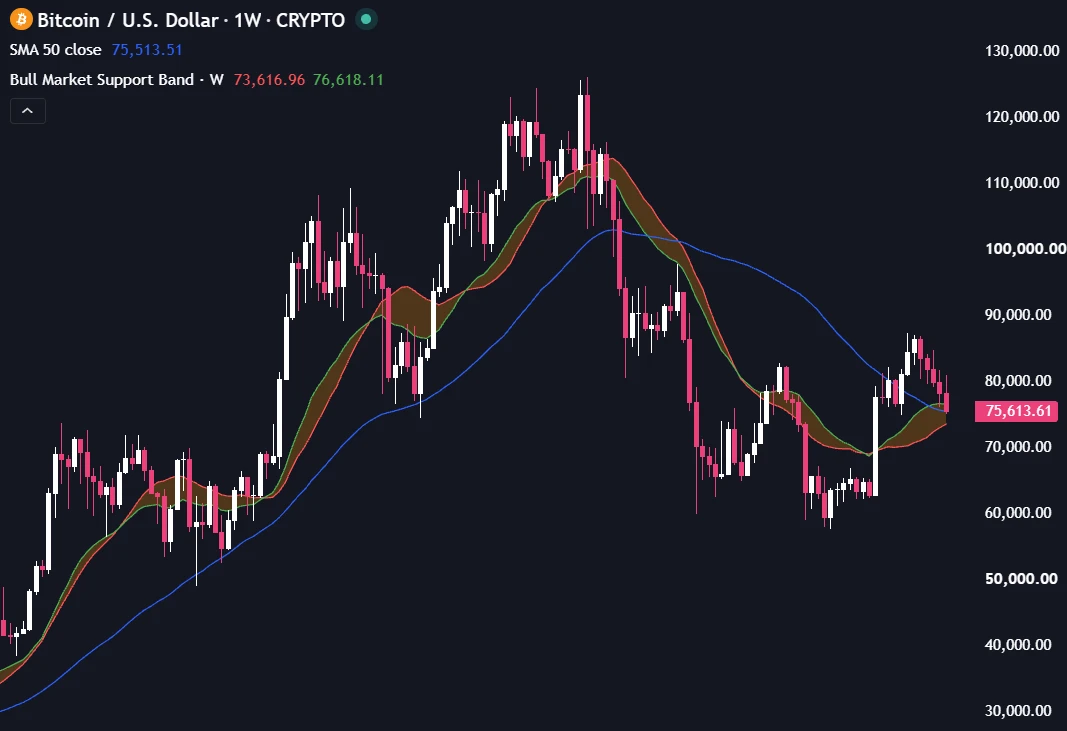
$BTC is now at its most important zone which is between $73.6K and $75.6K
Both the 50W MA and Bull Market Support Band sit in this range and it's a must hold
A weekly close above this and we are safe
A weekly close below and we should start looking for jobs
post-image
BTC-0.67%
What Is Trade Expectancy? How Can Win Rate, Average Wins and Losses, and Trading Costs Help Determine Whether a Strategy Has a Long-Term Edge?

In cryptocurrency trading, making money with a strategy in the short term does not mean it will work over the long term. Getting lucky and catching one big market move may hide problems with the strategy itself. Trade expectancy helps us evaluate a strategy overall, rather than judging it based on just a few wins or losses.

First, what is trade expectancy?

Trade expectancy is the average potential return per trade when repeatedly trading according to
post-image
What Verifiable Metrics Should We Use to Determine Whether a Web3 Network Is Making Progress?

In the Web3 world, we often see all kinds of exciting news: ecosystem partnerships are growing, new features are launching, development roadmaps are being updated, or new technological breakthroughs are being achieved.

But there is a more important question to ask:

Have these developments actually translated into improvements in the network’s capabilities?

Announcing a partnership does not mean users have started using the product; launching a new feature does not mean it solves a real problem; pu
post-image
🌅 Good morning, friends.
The market was hit by a real storm yesterday.
Nasdaq fell 5.5%, VIX rose nearly 70%, and $BTC fell from the 80K region to 75.5K. More than $1 billion in crypto liquidations occurred.
Today, all eyes are on US employment data.
For $BTC , 75.4K is a critical stronghold. If it holds, a rebound is still possible. But if this level is lost too, the market could enter a much more dangerous zone.
For now, the most important levels are: 75.4K → 76.5K → 78.6K.
Volatility will be very high today. Risk management is more important than ever.
#BTC #Bitcoin #Crypto
post-image
NDAQ-2.63%
BTC-0.67%
Before getting excited about a new crypto project, take a closer look.
Check its website.
Read its documentation.
Understand its tokenomics.
Look into its team and community.
Research the risks.
A little homework can make a big difference. DYOR!
#DYOR #CryptoResearch #Altcoins
post-image
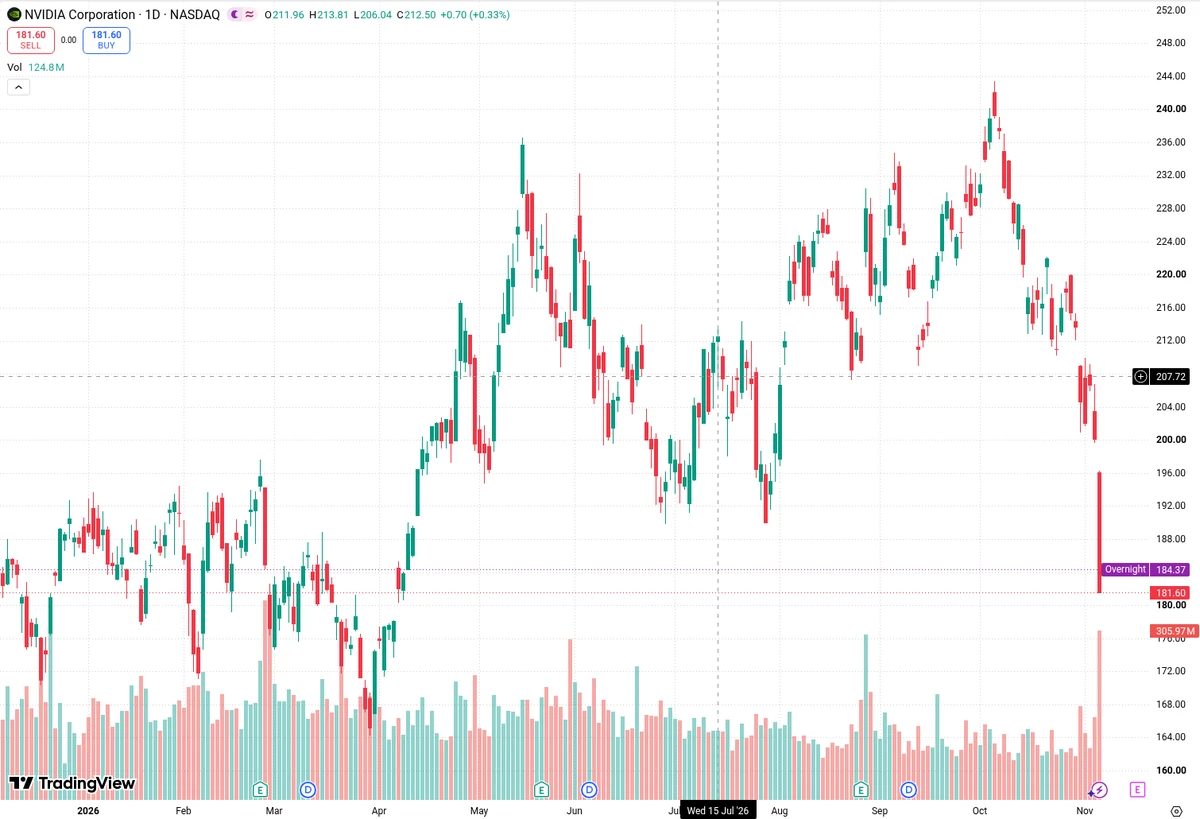
📉 The Epic U.S. Stock Sell-Off: Short-Term Flush or Deeper AI Correction?

Markets experienced an intense wave of volatility when U.S. stocks faced heavy selling on Thursday, with the Nasdaq plunging and closing down over 5%. High-flying AI and chip stocks—including major market drivers like NVDA and AMD—took a severe hit, tumbling across the board.

This dramatic market movement sparks a critical debate for traders and investors alike: Is this sharp downturn merely a short-term deleveraging event to clear out excess margin, or is the monumental AI trade entering a much deeper, structural
NVDA-9.33%
AMD-17.64%
NAS100+1.64%
  • 4
  • 1
Gold shorts during the day banked 50 points, with room to spare! The bearish outlook for NFP in the evening session remains unchanged! Short boldly! Short gold down to 4000–3980! Bitcoin’s first target is 736!
GLDX-0.40%
PAXG+0.37%
XAU+0.38%
BTC-0.67%
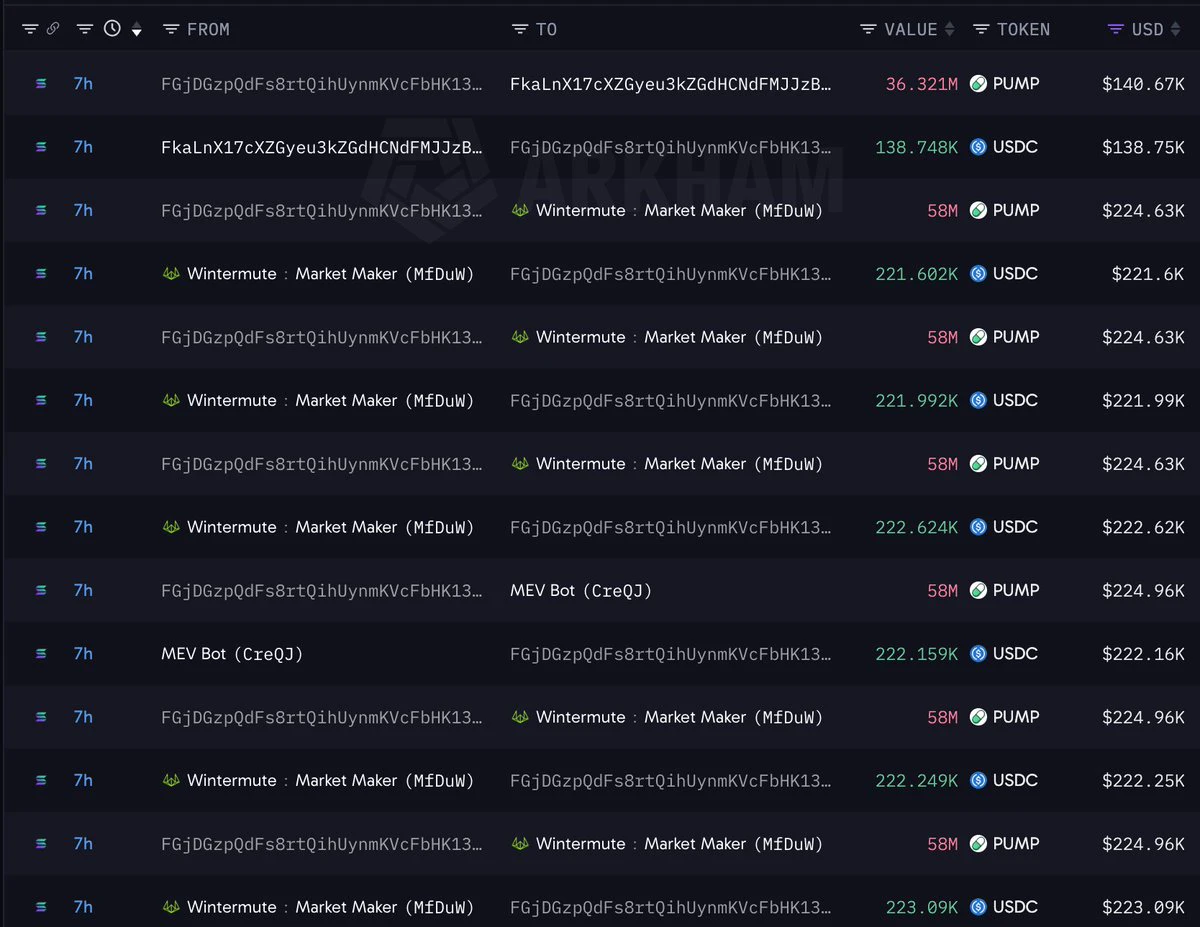
Whale FGjDGz dumped 674.32M $PUMP for 2.59M $USDC 7 hours ago, taking a $409K loss.
post-image
PUMP-1.06%
USDC+0.01%
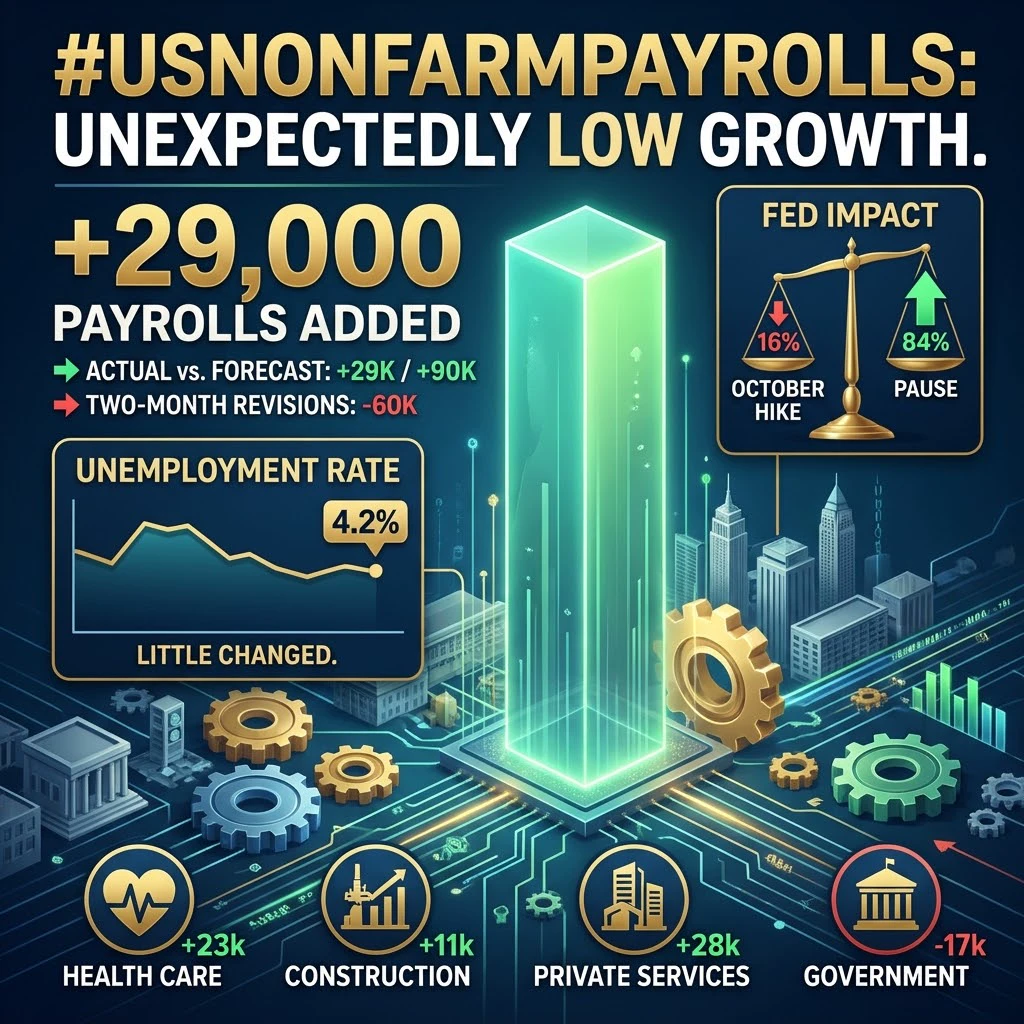
#USNonfarmPayrolls

WORKED FOR 8S
US NONFARM PAYROLLS: THE JOBS NUMBER THAT CAN CHANGE THE ECONOMIC STORY

IS MORE JOB CREATION ALWAYS GOOD NEWS?

Many people believe that when the United States creates more jobs, the economy is automatically getting stronger. It sounds logical: more jobs mean more workers, more income and more spending. But economic data can tell a more complicated story.

Imagine a small business that hires 20 new employees in one month. At first, this looks like excellent news. However, if wages are rising too quickly, costs are increasing and the business is struggling to
post-image
Noted ✍️, BTC could be a long at this level, 80000-83500. Let’s see how the market makers plan to push it up
post-image
BTC-0.67%
This joke used to be really funny, now _________?
post-image
What Is Position Sizing, and Why Can Oversized Positions Cause You to Get Knocked Out Early Even If Your Trading Strategy Has an Edge?

In cryptocurrency trading, correctly predicting market direction is important, but how much capital you commit to each trade also determines whether your account can survive long term. Even a strategy with positive expected returns can lead to hard-to-recover losses if your position is too large and an unexpected price swing or a string of losses occurs.

First, what is position sizing?

Position sizing is the process of deciding how much capital to commit to
post-image
The post-election rally was wiped out overnight. With nonfarm payrolls due again tonight, I’m keeping my position light and waiting for the data😮‍💨
Tech and semiconductors took the biggest hit. I’m not chasing shorts or rushing to buy the dip. I’ll wait for the data and see how rate expectations shift.
At times like this, staying on the sidelines is more reassuring than blindly guessing the direction.
#美股 #非农
post-image
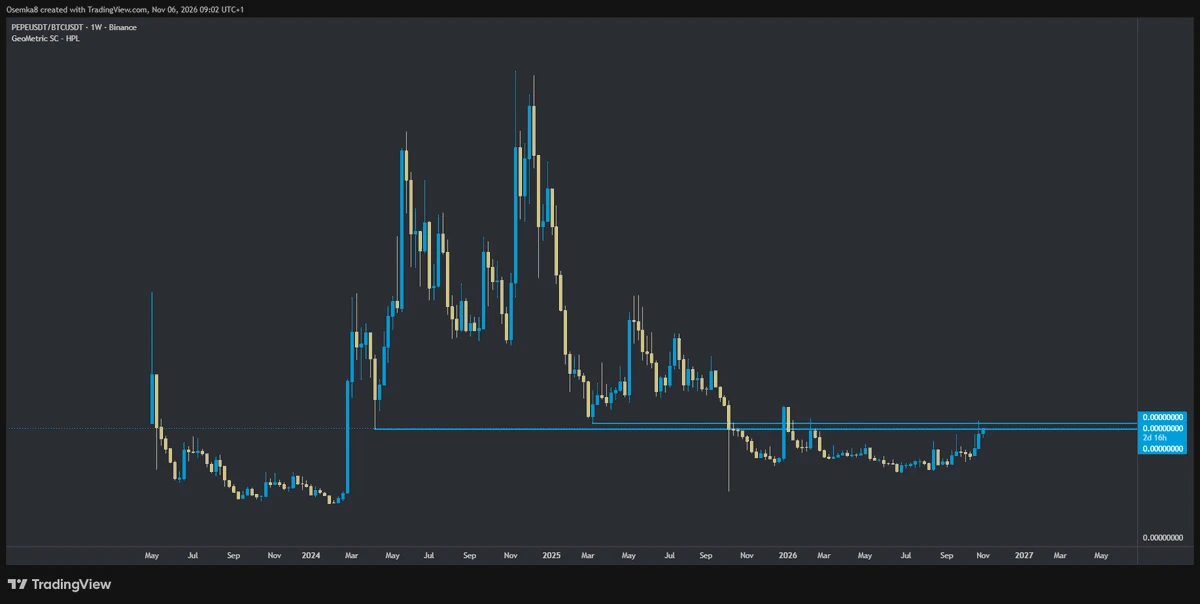
$PEPE vs $BTC looks amazing, ngl
Clear the zone and pop
post-image
PEPE+0.97%
BTC-0.67%
Load More

Join 40 M users in our growing community

⚡️ Join 40 M users in the crypto craze discussion

💬 Engage with your favorite top creators

👍 See what interests you

Trending Topics

USStocksFaceHistoricSelloff

4.09k Views3.61k Discussing

U.S. stocks suffered a sharp selloff on Thursday, with the Nasdaq closing down more than 5% and the Philadelphia Semiconductor Index falling over 12%. AI and chip stocks including $NVDA and $AMD were hit especially hard. Markets are reassessing AI valuations, data-center spending and future returns. Is this just short-term deleveraging, or the start of a deeper correction in the AI trade? Which sectors are you watching next?

GateLaunchesPoSECProofOfSecurity

14.32k Views587 Discussing

USNonfarmPayrolls

12.42k Views4.04k Discussing

View More