


Share your thoughts
placeholder
Article
BTC Bitcoin | Current price 79030

✅Short-term
Bullish-bearish dividing line: 79350

- Long: Hold above 79350 to go long, target 80200, stop-loss 78900

- Short: Rejected at 79350 to go short, target 78650, stop-loss 79780

✅Medium- to long-term
Support 77200, strong support 74900
Resistance 81800, strong resistance 83500

- Set up a long position near 77300 on a pullback, target 83000, stop-loss 76400

- If 83500 is not broken, set up a mid-term short on a rally to 83200


ETH Ethereum | Current price 2485.6

✅Short-term
Bullish-bearish dividing line: 2498

- Long: Hold above 2498
BTC-0.64%
ETH-0.10%
SOL-1.20%
BNB-0.70%
Market Alert

$DOGE /USDT - SHORT

Trade Plan:
Entry: 0.09038 – 0.09088
SL: 0.09298
TP1: 0.08886
TP2: 0.08769
TP3: 0.08592

Why this setup?
Technical setup found.

Debate:
Thoughts?

⚠️ Personal market analysis only. NFA — manage risk and DYOR.
Educational content, not investment advice or a recommendation to buy, sell, deposit, or withdraw any asset. No paid promotion or referral/affiliate links.
DOGE+1.65%
Yesterday, gold prices saw no major fluctuations, remaining in a weak, range-bound pattern overall. The rally encountered resistance around 4435, so do not chase the rise.
Multiple attempts to move higher were met with pressure and retraced. Bullish momentum weakened, while the stronger dollar and rising U.S. Treasury yields suppressed gold’s upside.
From the chart, the highs are gradually declining, and the rebound has clearly weakened. Selling pressure above remains evident, with bears still dominating in the short term.
This is currently a rebound correction following a sharp decline, and t
post-image
I didn’t chase when the price broke above the previous high, waiting instead to go long after it stabilized around 2394.32 on the pullback. A true breakout won’t be completed in one move; positions built after a confirmed pullback are often more solid.
The price then moved upward in small steps, continuously forming higher lows at key levels. The fake bearish candle in the middle shook out quite a few short-term traders, but the bulls did not break down and continued at their own pace.
After the unrealized profit reached +698.1%, I reduced the position by 70% and moved the protection level for
post-image
SNDK+1.72%
BTC-0.62%
Bitcoin was repeatedly emphasized yesterday as having 78,600 as support for a rebound, and that was indeed correct. Although the rebound only reached around 79,400 at its peak, there was still some profit to be made.
Those who went long around 78,600 are still slightly in profit. You can exit according to your own needs. For now, the upside resistance is around 79,500/79,900.
post-image
BTC-0.64%
9.8 Su Wan’s Morning Market Analysis and Trading Strategy
BTC and ETH are still fluctuating broadly within a sideways range. On the hourly chart, the low touched support near 785 before rebounding. The hourly chart has seen two consecutive bullish candles, with the KDJ golden cross moving upward.
BTC: Buy near 78,500–78,000, with a target near 80,000–81,000.
ETH: Buy near 2,460–2,440, with a target near 2,500–2,540. $BTC $ETH #Gate上线打金狗限时免Gas费
post-image
BTC-0.64%
ETH-0.10%
🚀 The yen just soared to a six-month high! 📈 Speculation around BOJ interest rates is shaking up the currency market. How will this impact your crypto positions? $JPY $USD #Forex
I didn’t watch the market or use my brain; it was jumping on its own, as if working overtime for me.
A few days ago before bed, I glanced at $HOLO . The rebound was weak, each upward push falling just short, and volume failed to follow. This structure clearly showed that no one was willing to take it higher, so I judged it to be a short-term bullish opportunity.
Placed at 0.06140, now at 0.06639, +395.58%. Those already on board should be waking up laughing.
The profit is thin, but it grew on its own—I didn’t touch it at all.
A reminder on position management: close 70% first, leave 30%, and mo
post-image
HOLO-0.04%
ETH-0.04%
BTC-0.62%
$$UAI The data looks off: the 24-hour amplitude is 47%, and trading volume reached $209 million, but the price is stuck at 0.7281, unable to move up or down. The high of 0.7597 was slammed back three times. This is not an ordinary pump—it looks like someone is executing precise price control.
First, the unusual points: the 24-hour low of 0.5152 to the high of 0.7597 means it went from hell to heaven and back to the middle of the mountain, yet trading volume did not explode and instead remained steady. If retail traders were really FOMO-chasing the price, there should have been massive volume a
UAI+18.54%
Why is the 1h RSI sitting at 54.59 right before a potential short squeeze on SYMBOL?

$XAUT /USDT - SHORT

Trade Plan:
Entry: 4416 – 4420
SL: 4442
TP1: 4400
TP2: 4388
TP3: 4371

Why this setup?
Why now? The daily trend is a range, which usually compresses before a directional break, and the 1h price is pinned at 4418. The 1h ATR of 9.877088 shows that volatility is still expanding, so a fast move toward TP1 at 4400 is within one average true range. If momentum stalls, the 15m RSI at 54.59 gives the short side room to push toward TP2 at 4388. The invalidation level at 4442 is the line in the
XAUT+0.87%
The current crypto market is difficult to trade in terms of trends. Trends are lasting for shorter and shorter periods, and after completing a trend trade, the market often moves sideways for several months.
Because of my strategy’s risk-reward ratio, the profit from a single trade can be gradually eroded by sideways volatility over 2–3 months. Not to mention that trends are becoming increasingly shorter—the profitable market conditions of an entire year have been compressed into just a few days. If you miss those few days, the rest of the time is all sideways price action and losses.
The good
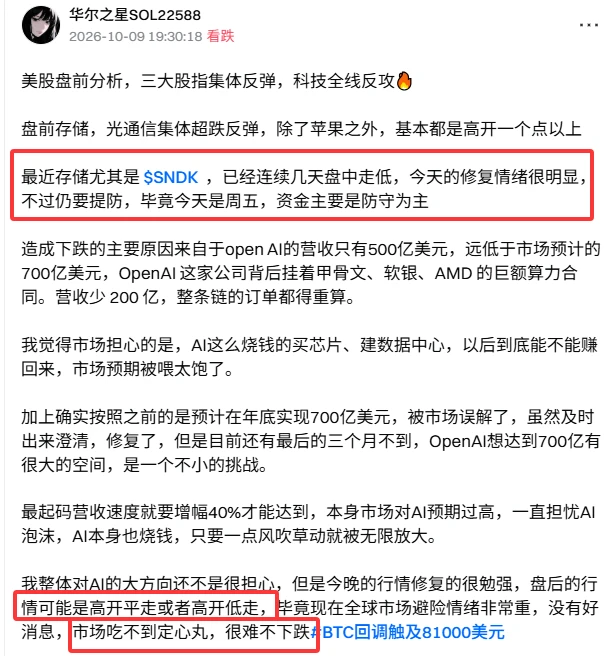
The $SNDK long was a bit of a grind to hold, with one dip in between sweeping out quite a few short chasers and coming just a few points from my protective stop. I didn’t manually cut it at the time because the four-hour structure had not yet broken.
I entered based on a double bottom on the hourly chart. After the right-side breakout, it retested the prior-high neckline and held firm, so I went long after confirmation. The entry wasn’t particularly cheap, but the stop was very close—an attempt to use limited risk to capture a trend continuation.
After it rallied into the target zone, I manage
post-image
SNDK+1.72%
BTC-0.62%
ZEC-3.69%
This was purely because market sentiment was good—the market casually tossed out a few gold coins, and one just happened to hit me on the head.

During the repeated intraday swings, I saw that $AERO had held its key level and that buy orders were still sitting at the bottom, so I went along with it and opened a long at 0.4598. The logic was straightforward: accept the loss if support broke, and let it choose its own direction if support held.

Taking another look just now, the price has already pushed up to 0.618, with unrealized profit on the position at +2443.04%. This was a satisfying pie
post-image
AERO+17.60%
ETH-0.04%
SNDK+1.72%
🎁 5,000 USDT in rewards await you! Round 2️⃣ 2️⃣ of the Growth Points Draw is ongoing!
300 Growth Points = 1 draw. Up to 10 draws daily, and every draw wins! 🤩
💫 Interact every day and earn Growth Points with ease
🔹 Visit Square: Post, like, comment, and share for up to +600 daily
🔹 Watch Live: Watch, follow, like, comment, and share for up to +300 daily
🔹 Join Hot Chat: Participate in discussions and share trading cards for up to +90 daily
🔹 Creator bonus: Post designated token/trading card content for up to +300 per task
Gate VIP football jerseys, prediction market experience vouchers
Gate_Square
🎁 5,000 USDT in rewards await you! Round 2️⃣ 2️⃣ of the Growth Points Draw is ongoing!
300 Growth Points = 1 draw. Up to 10 draws daily, and every draw wins! 🤩
💫 Interact every day and earn Growth Points with ease
🔹 Visit Square: Post, like, comment, and share for up to +600 daily
🔹 Watch Live: Watch, follow, like, comment, and share for up to +300 daily
🔹 Join Hot Chat: Participate in discussions and share trading cards for up to +90 daily
🔹 Creator bonus: Post designated token/trading card content for up to +300 per task
Gate VIP football jerseys, prediction market experience vouchers, trading fee rebate vouchers, and more await your unlock!
Draw now 👉️ https://www.gate.com/activities/pointprize?now_period=22
#BTC #BTC #HYPE
🎁 5,000 USDT for grabs! Round 2️⃣ 2️⃣ of Growth Points Draw is ongoing!
300 points = 1 draw. Up to 10 draws daily. Every draw wins! 🤩
💫 Stay active and earn points every day:
🔹 Square: Post, like, comment — up to 600 pts/day
🔹 Live: Watch, like, comment, share streams — up to 300 pts/day
🔹 Chat: Join discussions — up to 90 pts/day
🔹 Creators: Post designated token/trading card content — up to 300 pts/task
Win Gate VIP football jerseys, trading fee rebate vouchers & more!
👉 Try your luck now:
https://www.gate.com/activities/pointprize?now_period=22
#ETH #ETH #HYPE
repost-content-media
BTC-0.64%
ETH-0.10%
HYPE-2.30%
GT+3.16%
ZEC-3.67%
Why is everyone ignoring the bullish setup forming on HYPE right now?

$HYPE /USDT - LONG

Trade Plan:
Entry: 84.723 – 85.111
SL: 83.054
TP1: 86.314
TP2: 87.245
TP3: 88.642

Why this setup?
Why now? The daily trend is bullish, setting the macro stage for a continuation move. The 1h ATR of 0.776096 shows enough volatility to fuel a strong push, while the 15m RSI at 36.72 signals room to run before hitting overbought territory. The entry zone sits between 84.723 and 85.111, with the precise entry reference at 84.917, positioning us perfectly to catch the wave. The first target is 86.314, foll
HYPE-2.24%
BTC found support and rebounded near 78,600, but why shouldn’t we rush to say it has turned stronger before reclaiming 79,500?
After retreating from around 80,000 over the past two days, BTC found buying support near 78,600 and has now moved back above 79,000.
Seeing the rebound, many people’s first reaction is: the pullback is over, and the market is about to move higher again.
But the easiest thing to misread today is equating a “rebound after finding a floor” directly with a “structural recovery.”
From the one-hour structure, the fact that 78,600 has held for now shows there is buying inter
post-image
BTC-0.62%
  • 2
Last night, Ethereum came under pressure and retreated from around 2513, briefly stabilizing after dipping to a low of 2465, then fluctuating narrowly around the 2475-2500 range. It is currently trading near 2495. Overall, it is showing a weak consolidation pattern after retreating from a high and experiencing a lackluster rebound.
The 2513 area has formed a short-term top, with rebounds repeatedly encountering resistance near the 2500 level, indicating clear overhead selling pressure. As an intraday support level, 2475 has been tested multiple times, and its support is gradually weakening. Th
post-image
ETH-0.04%
I was just about to go rant on the forum, but then I checked my balance—forget it, the market is always right.😌
A few days ago, I took one last look before bed. $SOL retraced to 84.84, but not only did it hold the level, the rebound grew stronger each time. I placed an order on the side, thinking the worst-case scenario would be getting stopped out. I didn’t expect to wake up and find the price had gone straight to 103.65.
The unrealized profit is now +2062.43%. Although I didn’t catch the entire move with a full position, I did hold on to the most comfortable part of the launch. Getting the
post-image
SOL-1.09%
SNDK+1.72%
LAB-1.75%
Load More

Join 40 M users in our growing community

⚡️ Join 40 M users in the crypto craze discussion

💬 Engage with your favorite top creators

👍 See what interests you

View More