Square
Following
Hot
News
Profile
Share your thoughts
placeholder
Article
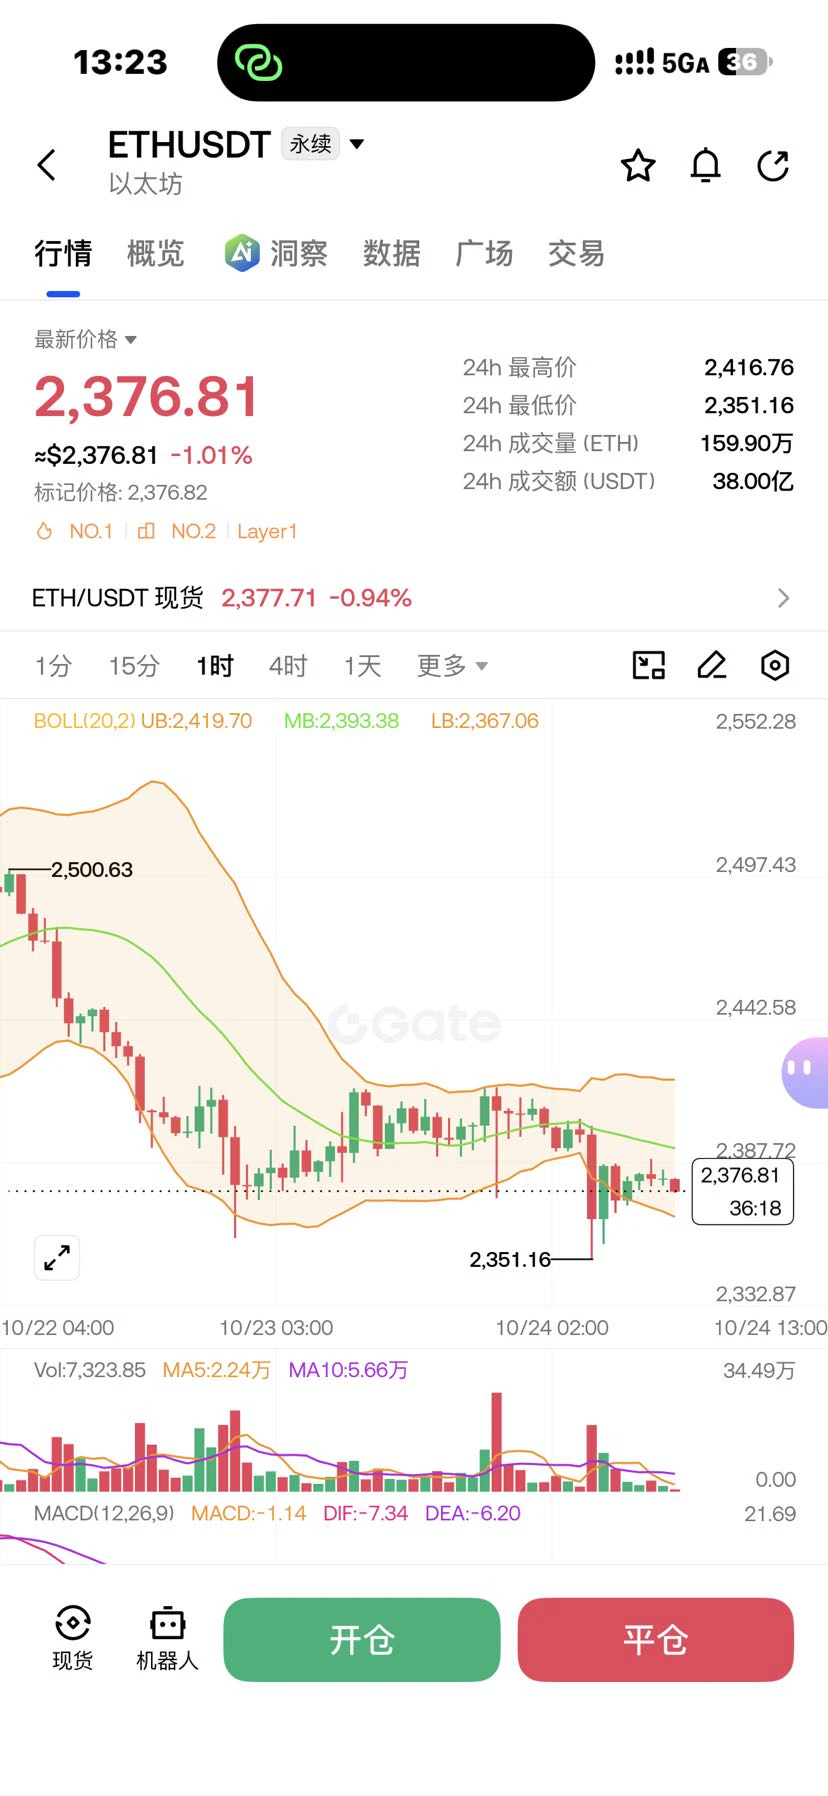
The afternoon long positions were indeed stopped out during the sharp drop. After realizing that the trend had reversed, I immediately set up long positions on Zhibo $BTC and $ETH —two trades totaling 12,000U.
Extreme market conditions can indeed leave people confused and overwhelmed, but fortunately, I managed to get back into the rhythm in the end.
I tend to interpret this rally as a short squeeze following the liquidation of long positions, so a pullback cannot be ruled out going forward.
I’m not calling it a night until two trades are completed tonight. Everyone should control their posit
BTC+0.59%
ETH+1.40%
$ICNT Up 21% in half a day, it surged straight from 0.1015 to 0.1371, with 13.7M in trading volume pouring in. That’s not the kind of volume retail investors can generate. I took a quick look on-chain just now: the top 10 addresses’ holding concentration hasn’t declined, indicating this move is not distribution but someone accumulating. On the macro side, here’s an anchor: during the week when the Fed minutes leaned hawkish, the 30-day correlation between altcoins and the Nasdaq surged to 0.78. Small-cap assets like ICNT have higher beta, so as long as rate-hike expectations don’t rebound, it
ICNT+20.42%
In 2006, bored out of my mind, I went online for the first time and casually bought 1,000 Bitcoin.
Back then, Bitcoin was worth jack shit, so I just treated it like in-game currency.
post-image
BTC+0.60%
BREAKING: Aster now lets traders deposit and withdraw BTC directly on the Bitcoin network. It adds to existing support for wrapped BTC on EVM chains, on an exchange holding $762.31M in deposits.
@Aster_DEX
ASTER+1.27%
BTC+0.60%
🚀 GT/USDT Technical Insights: Is GateToken Preparing for a Bullish Reversal at $10.00 Support?
Pair: GT/USDT (Spot)
Current Price: ~$10.42
24h Range: $10.00 – $10.45
24h Volume: ~67.70K GT (~$691.81K turnover)
📊 1. Key Technical Breakdown Across Timeframes
1-Hour Chart (Short-Term Recovery):
GT tested strong psychological support around $10.00 before staging a clean V-shaped rebound back above $10.40.
Short-term EMAs (EMA5 at 10.38 and EMA10 at 10.33) are sloping upward, crossing above the short-term Moving Averages, signaling early bullish momentum in micro-timeframes.
MACD has fli
GT-0.09%
  • 3
Everyone, listen‼️ Quickly open a second long position on $ETH
now.entry: $2,451 – $2,455targets: $2,465 / $2,480 / $2,500sl: $2,418
post-image
ETH+1.40%
Beautiful day to touch grass.
post-image
Robinhood's stock tokens have generated $15B in cumulative trading volume as Robinhood Chain, built on Arbitrum, passes 100 days live. About 200,000 people hold the tokens, which track 190+ US stocks and funds.
@arbitrum
post-image
ARB+6.98%
2026-10-15 20:14 UTC. Following clean target completions on BTC and SOL in the previous session, WAL/USDT rejected off its upper boundary and pulled back -4.87% from its 0.05385 peak. Price now sits around ~0.05123 USDT, resting in the lower third of its range just below its central equilibrium. Upper resistance is mapped at the SHORT ZONE (0.0535882 - 0.0537676 USDT), while lower demand holds the LONG ZONE (0.0498204 - 0.0499998 USDT) around the primary TARGET ZONE at ~0.052276 USDT. AKE/USDT also holds a clean structure (SHORT: 0.0367231 - 0.0370425 | LONG: 0.0300153 - 0.0303347 | TARGET: ~0
post-image
BTC+0.60%
SOL+1.92%
WAL-13.93%
AKE+17.90%
SNXX+0.22%
Honestly, there is still support below overall, and it has been holding above 82000, but I still couldn’t hold on. I’ll take profits first and redeploy later. 😁
post-image
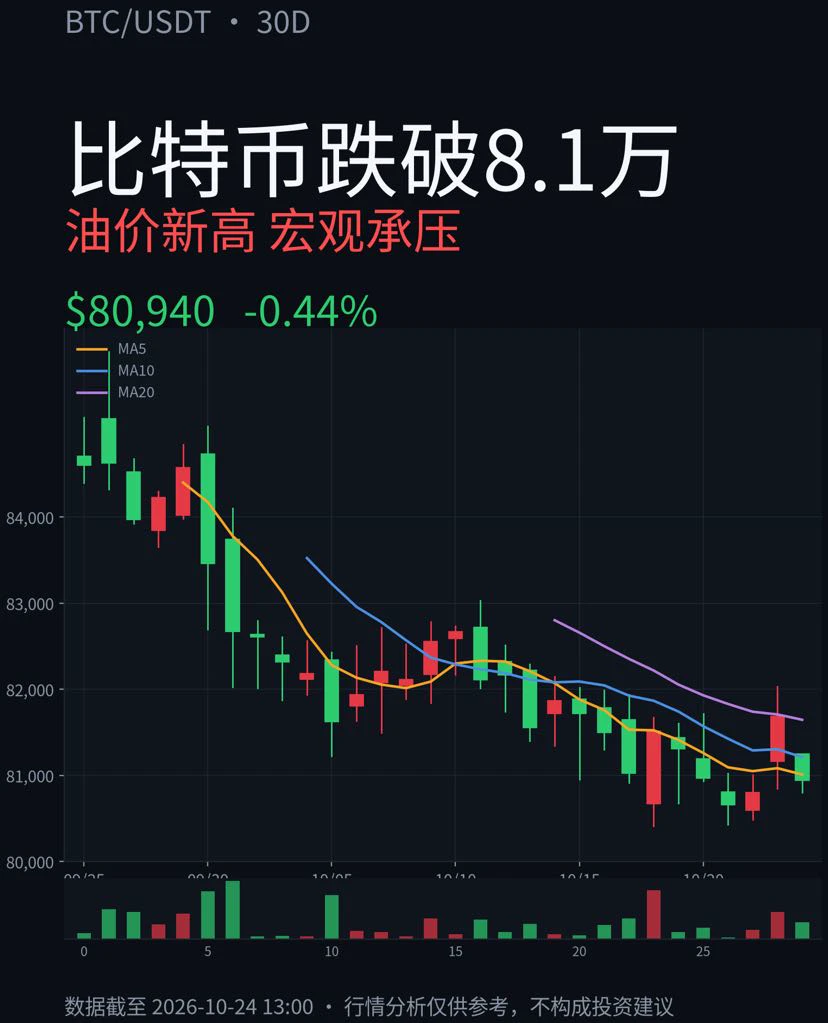
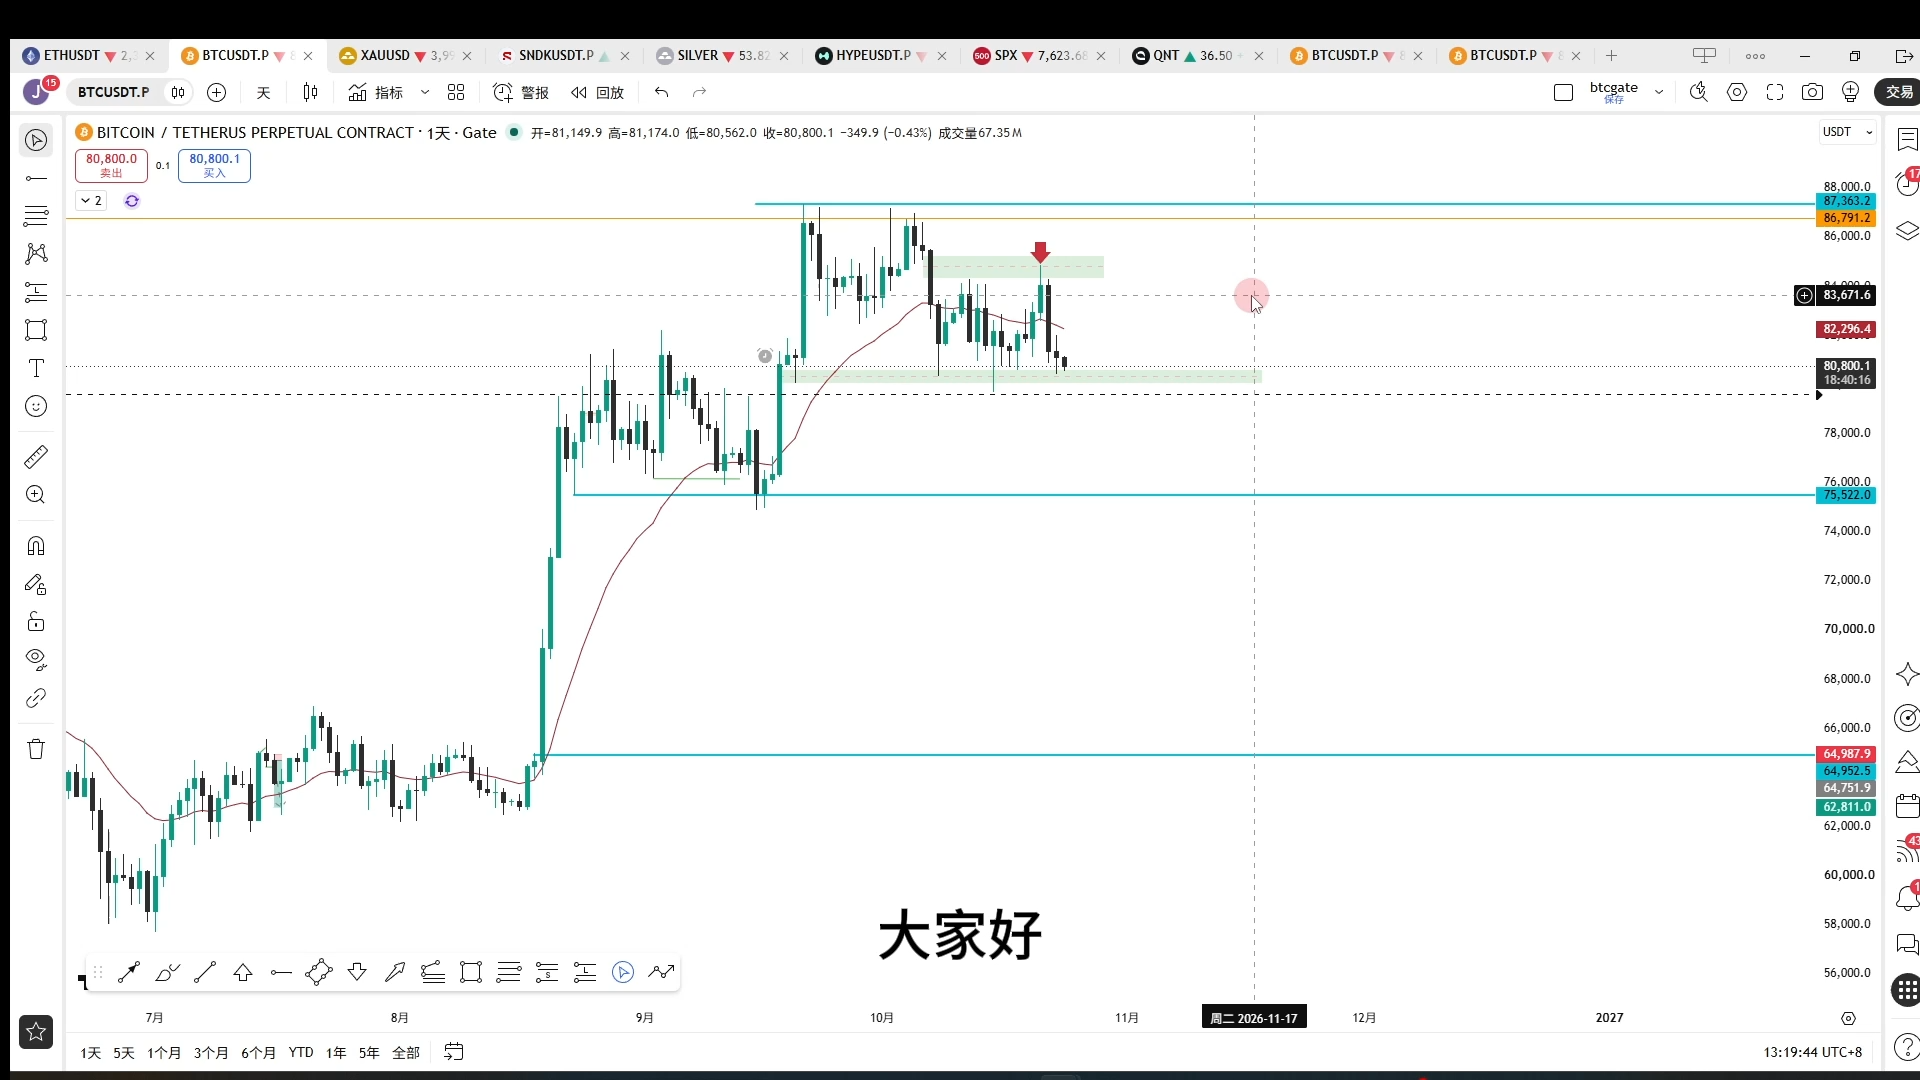
As Bitcoin attempts to hold its ground at the $82,400 level, the market is simultaneously navigating a heavy flow of macroeconomic data. Over the past 24 hours, the price dipped to as low as $79,795 before recovering to test the $82,630 mark. This movement cannot be attributed to a single factor; rather, several distinct pressures have come into play at once.
PPI surprise and interest rate expectations
The Producer Price Index (PPI) data released in the U.S. for September came in significantly higher than anticipated. On an annual basis, the PPI rose by 6.3%, reaching its highest level in four
post-image
BTC+0.60%
GT-0.09%
ETH+1.62%
SOL+1.92%
XRP+1.33%
  • 7
  • 2
SOL oscillated downward from the earlier high of 124.99, with the intraday low dipping to 100.51 before a slight rebound, reaching a high of 106.49. This rebound is merely a minor corrective bounce during the decline; the overall broader downtrend channel remains intact, and a rebound to resistance presents an opportunity to enter short.

From the chart, the daily highs have been gradually moving lower, and the bearish trend structure remains intact. This rebound is only a brief pause amid the decline. MACD remains weak and trending downward, while heavy pressure from previously trapped posit
post-image
SOL+1.74%
To the guys who grow out or keep their hair: what hair creams and treatments do you use to give it a great look, texture, and healthy shine?
Abeg recommend!
post-image
Let’s go!!! 🚀🚀🚀
( new streamer) market overview
live-cover
LIVE1,532
$SKHY
The memory market is straight out of the hog cycle: prices rise, capacity expands; capacity expands, the market crashes; the market crashes, production is cut; production is cut, prices surge again. The entire industry is now pushing hard to ramp up production. If AI demand can’t outrun capacity, beware of the accelerated version of “storage means death” turning into “storage means king.” Those holding positions should wait for the November earnings reports, sell into the rebound, and keep something in reserve. Spend less time scrolling short videos—the sentiment is even more volatile th
post-image
SKHY-0.94%
Buy $QNT before its too late.
Day 1069.
post-image
QNT-0.11%
Bitcoin Shakes Off Spooky Season Jitters: Can Bulls Keep It Going?
Bitcoin is trading at $83,591.79, up 2.24% on the day, after dipping to $80,953.41 earlier Tuesday. That low held about $588 above the $80,365.12 swing low that kicked off the bounce, a higher low that traders look for in an uptrend.
The Crypto Fear and Greed Index, a 0-to-100 sentiment gauge built from momentum, volatility, options positioning and social data, sits at 55 today, a neutral reading. It fell from an "extreme greed" peak of 82 on Aug. 26. The August euphoria is gone, but traders aren't panicking either.
⚠️ Personal
post-image
BTC+0.60%
  • 1
Load More

Join 40 M users in our growing community

⚡️ Join 40 M users in the crypto craze discussion

💬 Engage with your favorite top creators

👍 See what interests you

Trending Topics

USSeptemberPPIBeatsExpectations

91.35k Views1.88k Discussing

US September PPI came in at 6.3% YoY, well above the 5.3% market expectation, pointing to renewed producer-side inflation pressure. Weekly jobless claims were 199K, broadly in line with forecasts. Could hotter inflation further reduce room for rate cuts, and what does it mean for $BTC, US stocks, and gold?

DrLinHanSpeaksAtOxfordUnion

135.63k Views1.86k Discussing

JapanAndKoreaStocksPlunge

47.27k Views1.76k Discussing

View More